OPEN-SOURCE SCRIPT
已更新 PEV Price Band
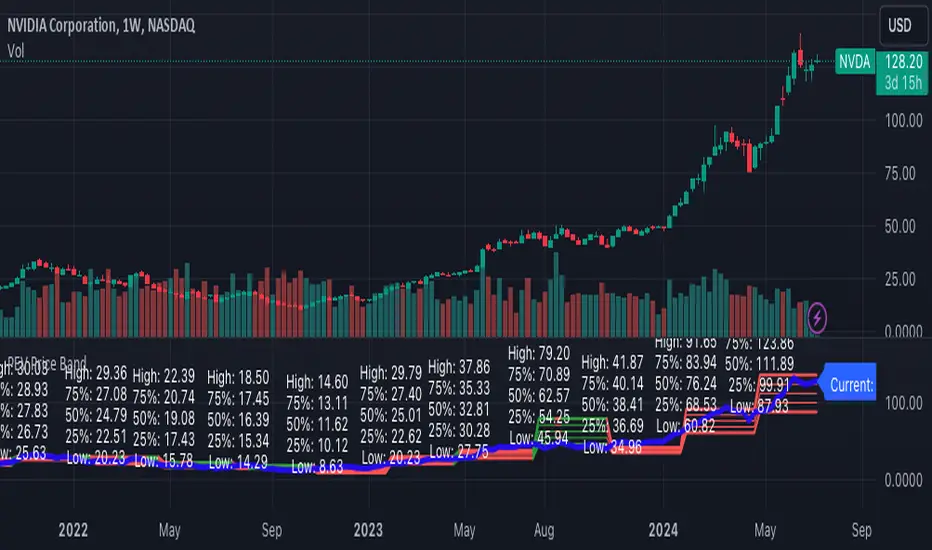
The PEV Price Band shows prices calculated using the high and low P/FQ EV of the previous period. (price to enterprise value per share for the last quarter) multiplied by FQ's current EVPS (similar to comparing marketcap to enterprise value but edit equations that are close to the theory of P/E)
If the current price is lower than the minimum P/EVPS, it is considered cheap. In other words, a current price is above the maximum is considered expensive.
PEV Price Band consists of 2 parts.
- First of all, the current P/EVPS value is "green" (if the markecap is less than the enterprise value) or "red" (if the marketcap is more than the enterprise value) or "gold" (if the market value is less than the enterprise value and less than equity)
- Second, the blue line is the closing price.
版本注释
1. Fixed bug in 5000 bars in day timeframe- Added attribute "calc_bars_count = 5000" in indicator
2. Changed "TOTAL_SHARES_OUTSTANDING" to "DILUTED_SHARES_OUTSTANDING"
3. Changed condition from checking uptrend condition to current price less than enterprise value for easy understanding
开源脚本
秉承TradingView的精神,该脚本的作者将其开源,以便交易者可以查看和验证其功能。向作者致敬!您可以免费使用该脚本,但请记住,重新发布代码须遵守我们的网站规则。
免责声明
这些信息和出版物并非旨在提供,也不构成TradingView提供或认可的任何形式的财务、投资、交易或其他类型的建议或推荐。请阅读使用条款了解更多信息。
免责声明
这些信息和出版物并非旨在提供,也不构成TradingView提供或认可的任何形式的财务、投资、交易或其他类型的建议或推荐。请阅读使用条款了解更多信息。