PROTECTED SOURCE SCRIPT
已更新 Nifty SentiMeter
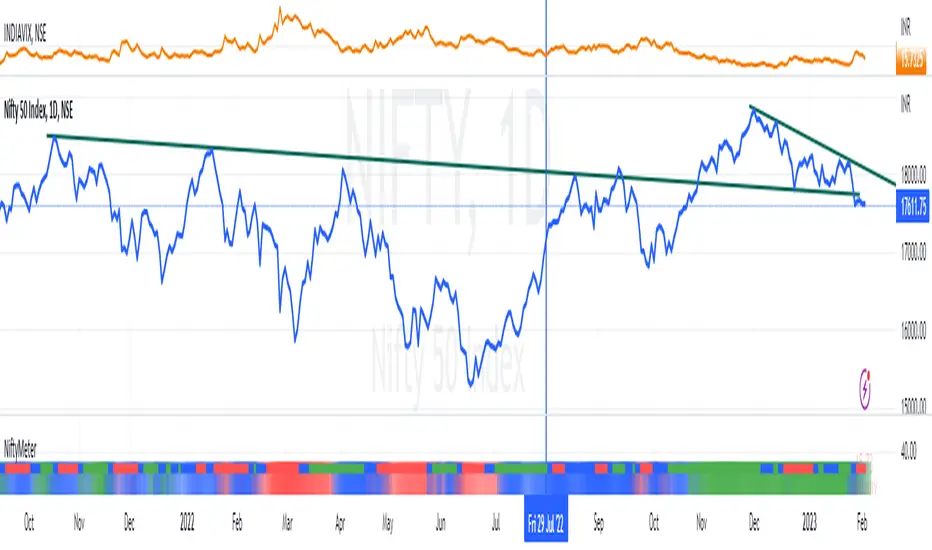
This meter displays a colour code based sentiment for the Nifty50 Index.
In order to do so, it uses the IndiaVix, that is the standard for determining the broader market Investor sentiment. The IndiaVix and the Nifty50 are inversely correlated. A spiking Vix on the upside indicates panic and fear in the market, that is reflected in price of the Nifty50, usually accompanied by steep falls. On the other hand, a stabilised and low volatile Vix, creates an atmosphere conducive for positive investor activity.
This indicator, uses this concept of inverse correlation between the Vix and the Benchmark, to plot the changes of investor sentiments over a period of time and the current sentiment.
This indicator should be used only on the DAILY timeframe for best results.
The best way to analyse the NiftyMeter is to observe the colour changes, that will help in understanding the changing investor sentiments.
A quick guide is as follows:
In general, Red indicates fear, Blue indicates a transitioning phase of sentiment (bull to bear or bear to bull), Green indicates bullish sentiment.
A stronger shade of the colour will indicate a stronger sentiment.
In order to do so, it uses the IndiaVix, that is the standard for determining the broader market Investor sentiment. The IndiaVix and the Nifty50 are inversely correlated. A spiking Vix on the upside indicates panic and fear in the market, that is reflected in price of the Nifty50, usually accompanied by steep falls. On the other hand, a stabilised and low volatile Vix, creates an atmosphere conducive for positive investor activity.
This indicator, uses this concept of inverse correlation between the Vix and the Benchmark, to plot the changes of investor sentiments over a period of time and the current sentiment.
This indicator should be used only on the DAILY timeframe for best results.
The best way to analyse the NiftyMeter is to observe the colour changes, that will help in understanding the changing investor sentiments.
A quick guide is as follows:
- Blue to Red, Green to Red - Indicates the positive investor sentiment has turned into bear - fear.
- Red and getting Stronger Red - Indicates that the fear is sustained.
- Blue to Green, Red to Green - Indicates that positive investor sentiment is back. It is now time for bulls to be active again.
In general, Red indicates fear, Blue indicates a transitioning phase of sentiment (bull to bear or bear to bull), Green indicates bullish sentiment.
A stronger shade of the colour will indicate a stronger sentiment.
版本注释
- Some clean up
- Added a "Fast" check over the existing "Slow"
受保护脚本
此脚本以闭源形式发布。 但是,您可以自由使用,没有任何限制 — 了解更多信息这里。
免责声明
这些信息和出版物并非旨在提供,也不构成TradingView提供或认可的任何形式的财务、投资、交易或其他类型的建议或推荐。请阅读使用条款了解更多信息。
受保护脚本
此脚本以闭源形式发布。 但是,您可以自由使用,没有任何限制 — 了解更多信息这里。
免责声明
这些信息和出版物并非旨在提供,也不构成TradingView提供或认可的任何形式的财务、投资、交易或其他类型的建议或推荐。请阅读使用条款了解更多信息。