OPEN-SOURCE SCRIPT
已更新 Grover Llorens Cycle Oscillator [alexgrover & Lucía Llorens]
Cycles represent relatively smooth fluctuations with mean 0 and of varying period and amplitude, their estimation using technical indicators has always been a major task. In the additive model of price, the cycle is a component :
Price = Trend + Cycle + Noise
Based on this model we can deduce that :
Cycle = Price - Trend - Noise
The indicators specialized on the estimation of cycles are oscillators, some like bandpass filters aim to return a correct estimate of the cycles, while others might only show a deformation of them, this can be done in order to maximize the visualization of the cycles.
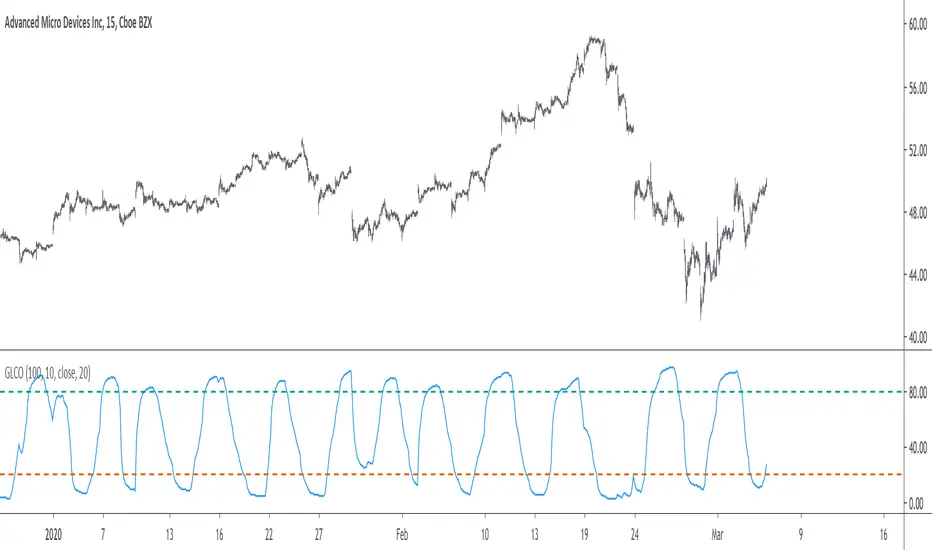
Today an oscillator who aim to maximize the visualization of the cycles is presented, the oscillator is based on the difference between the price and the previously proposed Grover Llorens activator indicator. A relative strength index is then applied to this difference in order to minimize the change of amplitude in the cycles.
![Grover Llorens Activator [alexgrover & Lucía Llorens]](https://s3.tradingview.com/u/UVzC9TOv_mid.png)
The Indicator
The indicator include the length and mult settings used by the Grover Llorens activator. Length control the rate of convergence of the activator, lower values of length will output cycles of a faster period.

here length = 50
Mult is responsible for maximizing the visualization of the cycles, low values of mult will return a less cyclical output.

Here mult = 1
Finally you can smooth the indicator output if you want (smooth by default), you can uncheck the option if you want a noisy output.

The smoothing amount is also linked with the period of the rsi.

Here the smoothing amount = 100.
Conclusion
An oscillator based on the recently posted Grover Llorens activator has been proposed. The oscillator aim to maximize the visualization of cycles.
Maximizing the visualization of cycles don't comes with no cost, the indicator output can be uncorrelated with the actual cycles or can return cycles that are not present in the price. Other problems arises from the indicator settings, because cycles are of a time-varying periods it isn't optimal to use fixed length oscillators for their estimation.
Thanks for reading !
If my work has ever been of use to you you can donate, addresses on my signature :)
Price = Trend + Cycle + Noise
Based on this model we can deduce that :
Cycle = Price - Trend - Noise
The indicators specialized on the estimation of cycles are oscillators, some like bandpass filters aim to return a correct estimate of the cycles, while others might only show a deformation of them, this can be done in order to maximize the visualization of the cycles.
Today an oscillator who aim to maximize the visualization of the cycles is presented, the oscillator is based on the difference between the price and the previously proposed Grover Llorens activator indicator. A relative strength index is then applied to this difference in order to minimize the change of amplitude in the cycles.
The Indicator
The indicator include the length and mult settings used by the Grover Llorens activator. Length control the rate of convergence of the activator, lower values of length will output cycles of a faster period.
here length = 50
Mult is responsible for maximizing the visualization of the cycles, low values of mult will return a less cyclical output.
Here mult = 1
Finally you can smooth the indicator output if you want (smooth by default), you can uncheck the option if you want a noisy output.
The smoothing amount is also linked with the period of the rsi.
Here the smoothing amount = 100.
Conclusion
An oscillator based on the recently posted Grover Llorens activator has been proposed. The oscillator aim to maximize the visualization of cycles.
Maximizing the visualization of cycles don't comes with no cost, the indicator output can be uncorrelated with the actual cycles or can return cycles that are not present in the price. Other problems arises from the indicator settings, because cycles are of a time-varying periods it isn't optimal to use fixed length oscillators for their estimation.
Thanks for reading !
If my work has ever been of use to you you can donate, addresses on my signature :)
版本注释
Fixed repainting issues开源脚本
秉承TradingView的精神,该脚本的作者将其开源,以便交易者可以查看和验证其功能。向作者致敬!您可以免费使用该脚本,但请记住,重新发布代码须遵守我们的网站规则。
Check out the indicators we are making at luxalgo: tradingview.com/u/LuxAlgo/
"My heart is so loud that I can't hear the fireworks"
"My heart is so loud that I can't hear the fireworks"
免责声明
这些信息和出版物并非旨在提供,也不构成TradingView提供或认可的任何形式的财务、投资、交易或其他类型的建议或推荐。请阅读使用条款了解更多信息。
开源脚本
秉承TradingView的精神,该脚本的作者将其开源,以便交易者可以查看和验证其功能。向作者致敬!您可以免费使用该脚本,但请记住,重新发布代码须遵守我们的网站规则。
Check out the indicators we are making at luxalgo: tradingview.com/u/LuxAlgo/
"My heart is so loud that I can't hear the fireworks"
"My heart is so loud that I can't hear the fireworks"
免责声明
这些信息和出版物并非旨在提供,也不构成TradingView提供或认可的任何形式的财务、投资、交易或其他类型的建议或推荐。请阅读使用条款了解更多信息。