INVITE-ONLY SCRIPT
已更新 Planetary Time Intervals [Javonnii]
🪐 Planetary Time Intervals Indicator🪐
This innovative planetary time-based market timing indicator enables traders to analyze and project planetary degree intervals directly onto any chart with exceptional accuracy. Built on a custom planetary framework, it calculates planetary positions down to the arc-second across all timeframes, accommodating up to 500 future bars. This capability allows for both clean intraday analysis and long-term market timing.
The framework operates autonomously and requires no external data or updates. It reliably computes planetary positions across centuries and supports seamless analysis across all markets—whether 24/7 assets like crypto or session-based instruments like stocks—with smooth, gap-free planetary data on any ticker or timeframe. Perfect for time-based market studies on deep historical datasets such as the Dow Jones.
🔶 FEATURES
Key planetary timing tools include:
- Standard Degree Interval Plotting (Fixed Increments)
- Price-to-Planetary Degree Conversions (360 Units Reduction & 1/10 Price Method) for Direct Price-to-Time Harmonics
- Geocentric & Heliocentric Models (Including Moon for Lunar Cycles)
- Absolute Degree Handling for Retrogrades
- Visual Projections: Background Highlights, Vertical Lines, and Degree Labels
- Math Display for Calculation Transparency
- Scaling Adjustments for Volatile Assets (e.g., Crypto, Indices)
- Multi-Timeframe Support Up to 500 Bars
- Alert Conditions for Interval Projections
- Customizable Interval Logic and Styling
- + More (Check changelog for updates)
🔶 BASIC DEMONSTRATION
On a daily stock chart, select a key low as your reference point (datetime and price). Choose a 30° interval for Mercury, and the indicator projects vertical lines forward at each degree milestone, with shaded backgrounds indicating potential cycle zones. Labels display traversed degrees, highlighting alignments in real-time.
For the 360 Conversion, input a price like $5,000—it reduces to 320° via modular arithmetic (5000 mod 360 = 320°), converting the price directly into a planetary time interval that may sync with numerological patterns or past turns.
🔶 USAGE & EXAMPLES
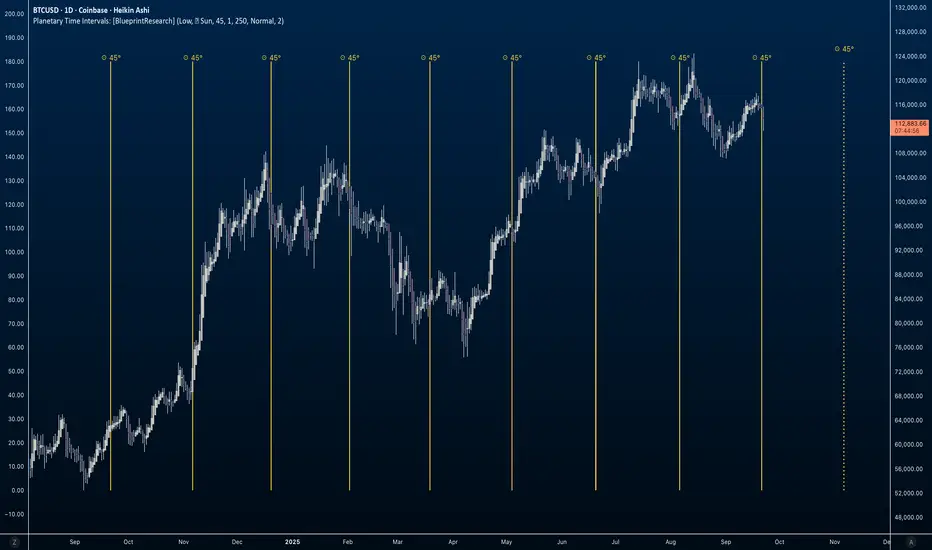
In the image below, the indicator is applied to a long-term weekly BTCUSD chart from 2015 to 2026. Selecting a historical low point (price = 198.02) as the reference, the 360 Conversion method derives the interval directly from the price. Since 198.02 is already under 360, the interval is simply 198.02° (no further reduction needed). Vertical yellow lines project these Sun-based intervals forward, aligning with a few key market turns, bull runs, and corrections. The math is displayed in the label "198.02° Low = 198.02° 360 Conversion 198.02°", illustrating the price-to-planetary time conversion process. Numerology enthusiasts might reduce 198.02° further (1+9+8+0+2=20, then 2+0=2) for symbolic insights into market balance or duality.

Supported planets: Sun, Moon, Mercury, Venus, Mars, Jupiter, Saturn, Uranus, Neptune, Pluto.
🔶 SETTINGS
- Timing Method: Select Standard Interval, 360 Conversion, or 1/10 Price.
- Planetary View: Geocentric/Heliocentric; Toggle Moon Inclusion.
- Interval Setup: Enter degrees (e.g., 45°); Enable Absolute for Retrogrades.
- Base Reference: Input datetime and price from high/low.
- Visuals: Toggle highlights, lines, math labels; Set colors/styles.
- Scaling: Adjust for asset ranges (e.g., multipliers for high or low prices).
- Limits: Bar count (up to 500)
- Styling: Label formats, projection options.
🔶 CONCLUSION
Planetary and numerological timing offers a unique lens on market rhythms, blending celestial mechanics with number-based insights for deeper analysis. This indicator is an original creation providing precise, flexible tools to explore these concepts, with a strong focus on converting price data into actionable planetary time intervals. As with all trading, past patterns aren't guarantees—pair with sound risk management and your overall approach.
🔶 HOW TO GET ACCESS
This public invite-only script is for planetary traders, market analysts, numerology enthusiasts, and anyone interested in harmonic degree-based timing. Reach out to the author for access details to this indicator and related resources.
This innovative planetary time-based market timing indicator enables traders to analyze and project planetary degree intervals directly onto any chart with exceptional accuracy. Built on a custom planetary framework, it calculates planetary positions down to the arc-second across all timeframes, accommodating up to 500 future bars. This capability allows for both clean intraday analysis and long-term market timing.
The framework operates autonomously and requires no external data or updates. It reliably computes planetary positions across centuries and supports seamless analysis across all markets—whether 24/7 assets like crypto or session-based instruments like stocks—with smooth, gap-free planetary data on any ticker or timeframe. Perfect for time-based market studies on deep historical datasets such as the Dow Jones.
🔶 FEATURES
Key planetary timing tools include:
- Standard Degree Interval Plotting (Fixed Increments)
- Price-to-Planetary Degree Conversions (360 Units Reduction & 1/10 Price Method) for Direct Price-to-Time Harmonics
- Geocentric & Heliocentric Models (Including Moon for Lunar Cycles)
- Absolute Degree Handling for Retrogrades
- Visual Projections: Background Highlights, Vertical Lines, and Degree Labels
- Math Display for Calculation Transparency
- Scaling Adjustments for Volatile Assets (e.g., Crypto, Indices)
- Multi-Timeframe Support Up to 500 Bars
- Alert Conditions for Interval Projections
- Customizable Interval Logic and Styling
- + More (Check changelog for updates)
🔶 BASIC DEMONSTRATION
On a daily stock chart, select a key low as your reference point (datetime and price). Choose a 30° interval for Mercury, and the indicator projects vertical lines forward at each degree milestone, with shaded backgrounds indicating potential cycle zones. Labels display traversed degrees, highlighting alignments in real-time.
For the 360 Conversion, input a price like $5,000—it reduces to 320° via modular arithmetic (5000 mod 360 = 320°), converting the price directly into a planetary time interval that may sync with numerological patterns or past turns.
🔶 USAGE & EXAMPLES
In the image below, the indicator is applied to a long-term weekly BTCUSD chart from 2015 to 2026. Selecting a historical low point (price = 198.02) as the reference, the 360 Conversion method derives the interval directly from the price. Since 198.02 is already under 360, the interval is simply 198.02° (no further reduction needed). Vertical yellow lines project these Sun-based intervals forward, aligning with a few key market turns, bull runs, and corrections. The math is displayed in the label "198.02° Low = 198.02° 360 Conversion 198.02°", illustrating the price-to-planetary time conversion process. Numerology enthusiasts might reduce 198.02° further (1+9+8+0+2=20, then 2+0=2) for symbolic insights into market balance or duality.
Supported planets: Sun, Moon, Mercury, Venus, Mars, Jupiter, Saturn, Uranus, Neptune, Pluto.
🔶 SETTINGS
- Timing Method: Select Standard Interval, 360 Conversion, or 1/10 Price.
- Planetary View: Geocentric/Heliocentric; Toggle Moon Inclusion.
- Interval Setup: Enter degrees (e.g., 45°); Enable Absolute for Retrogrades.
- Base Reference: Input datetime and price from high/low.
- Visuals: Toggle highlights, lines, math labels; Set colors/styles.
- Scaling: Adjust for asset ranges (e.g., multipliers for high or low prices).
- Limits: Bar count (up to 500)
- Styling: Label formats, projection options.
🔶 CONCLUSION
Planetary and numerological timing offers a unique lens on market rhythms, blending celestial mechanics with number-based insights for deeper analysis. This indicator is an original creation providing precise, flexible tools to explore these concepts, with a strong focus on converting price data into actionable planetary time intervals. As with all trading, past patterns aren't guarantees—pair with sound risk management and your overall approach.
🔶 HOW TO GET ACCESS
This public invite-only script is for planetary traders, market analysts, numerology enthusiasts, and anyone interested in harmonic degree-based timing. Reach out to the author for access details to this indicator and related resources.
版本注释
Improvements have been made to ensure more accurate intervals for both historical data and future projections.仅限邀请脚本
只有作者授权的用户才能访问此脚本。您需要申请并获得使用许可。通常情况下,付款后即可获得许可。更多详情,请按照下方作者的说明操作,或直接联系BlueprintResearch。
TradingView不建议您付费购买或使用任何脚本,除非您完全信任其作者并了解其工作原理。您也可以在我们的社区脚本找到免费的开源替代方案。
作者的说明
Access to this script will be granted at my discretion after approval. In the future, access may require a subscription or other requirements. For inquiries or feedback, feel free to reach out via direct message.
© 2025 Blueprint Research LLC · CC BY-NC-SA 4.0
免责声明
这些信息和出版物并非旨在提供,也不构成TradingView提供或认可的任何形式的财务、投资、交易或其他类型的建议或推荐。请阅读使用条款了解更多信息。
仅限邀请脚本
只有作者授权的用户才能访问此脚本。您需要申请并获得使用许可。通常情况下,付款后即可获得许可。更多详情,请按照下方作者的说明操作,或直接联系BlueprintResearch。
TradingView不建议您付费购买或使用任何脚本,除非您完全信任其作者并了解其工作原理。您也可以在我们的社区脚本找到免费的开源替代方案。
作者的说明
Access to this script will be granted at my discretion after approval. In the future, access may require a subscription or other requirements. For inquiries or feedback, feel free to reach out via direct message.
© 2025 Blueprint Research LLC · CC BY-NC-SA 4.0
免责声明
这些信息和出版物并非旨在提供,也不构成TradingView提供或认可的任何形式的财务、投资、交易或其他类型的建议或推荐。请阅读使用条款了解更多信息。