PROTECTED SOURCE SCRIPT
Power Momentum by Atilla Yurtseven
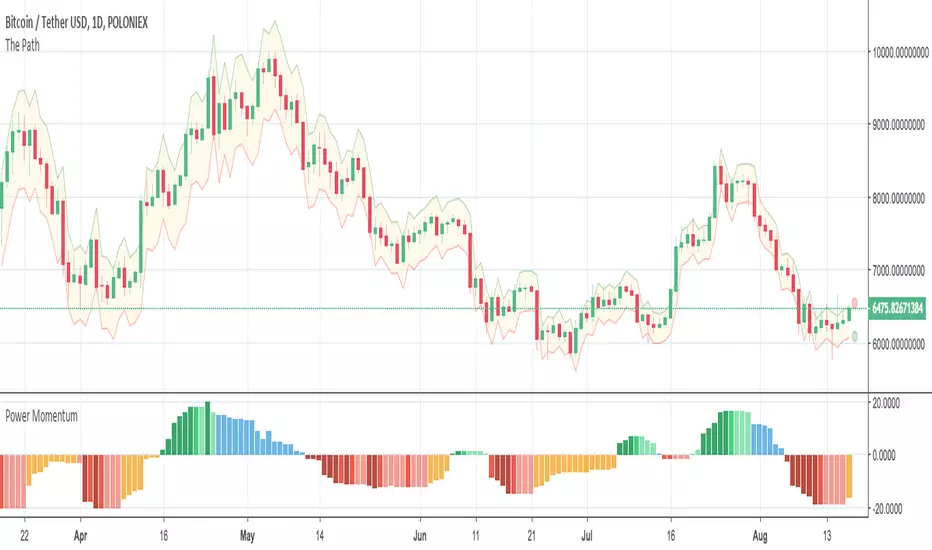
The Power Momentum indicator calculates momentum in a different way. The graph may look similar. The important part is the color of the bars.
If you set the "Base Line" to "Zero", there are two important things to notice. The orange color when the bars are below the base and the blue color when the bars are above the base.
If you set the "Base Line" to "Stats", instead of coloring bar, you see the bars in exact positions. For example; "Zero" shows you orange bar below the base line but "Stats" shifts the bars over the Base line.
Momentum is calculated statistically. If the momentum moves over to the preset levels, bar colors change concurrently.
BAR STATES
Orange: Orange bar below the base line means high possibility of an upcoming up movement
Blue: Blue bar above the base line means high possibility of an upcoming down movement
I hope you enjoy this indicator. As I stated in my previous indicators, i use statistical methods while developing my indicators.
Disclaimer: All the information in this article, including the indicator, was provided and published for informational purposes only and should not be considered legal or financial advice. Please use at your own risk.
Please remember to follow me and post some comments so i can share more indicators.
Happy trading! :)
Atilla Yurtseven
受保护脚本
此脚本以闭源形式发布。 但是,您可以自由使用,没有任何限制 — 了解更多信息这里。
I know Kung-Fu!
免责声明
这些信息和出版物并非旨在提供,也不构成TradingView提供或认可的任何形式的财务、投资、交易或其他类型的建议或推荐。请阅读使用条款了解更多信息。
受保护脚本
此脚本以闭源形式发布。 但是,您可以自由使用,没有任何限制 — 了解更多信息这里。
I know Kung-Fu!
免责声明
这些信息和出版物并非旨在提供,也不构成TradingView提供或认可的任何形式的财务、投资、交易或其他类型的建议或推荐。请阅读使用条款了解更多信息。