INVITE-ONLY SCRIPT
D Indicators - Positional tool
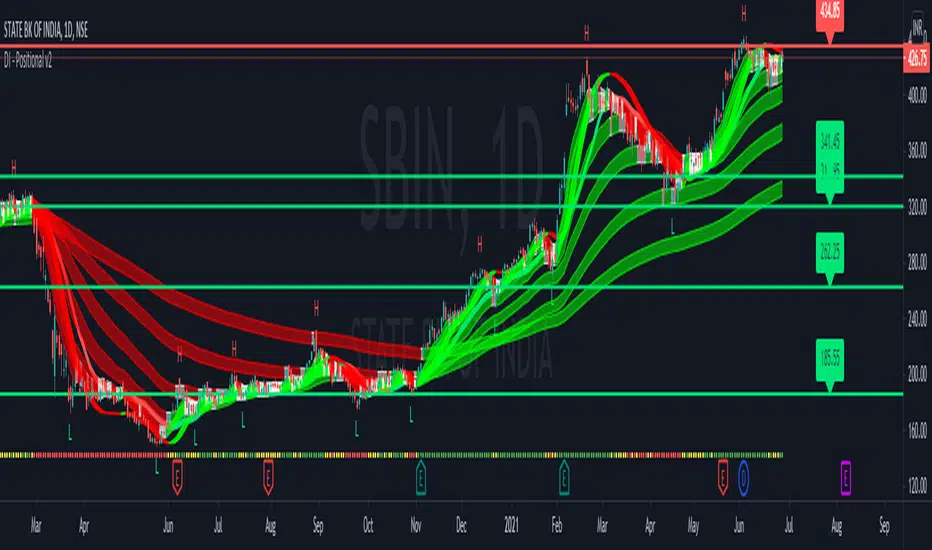
*Presenting a perfect setup for Positional and Swing traders.
1) Slow and Fast Bands
# 3 fast and 3 slow, in total of 6 EMA bands are added to the indicator in order
to make accurate decisions and helping find out in which trend the price is.
Enter when price gives a breakout above or below all of the 6 bands.
2) Trend Indicators
# Total of 3 trend indicators are also included:
Trend Indicator 1 ---> It is a SMA(20) and its color changes based upon
Trend Indicator 2 ---> will be plotted at the bottom of the screen. Based upon RSI
Trend Indicator 3 ----> EHMA
Their color will be yellow whenever the market is sideways which will act
as a cautionary sign that in about next phase the price will be rangebound.
Use them as a helping hand, and check whether they show the same trend or not while you enter.
3) Support/Resistance lines
# On charts, this indicator is used to locate levels of support and resistance.
As a function, Targets and SL can be planned.
When a candle closes above the support/resistance line, the lines change
color automatically. It'll turn green.
If the price is below the sup, it will also change color to red.
4) High/Low
# Will mark the high/low of a particular swing so that, one can place the SL over there and enter.
Thank you and regards,
D Indicators
仅限邀请脚本
只有作者授权的用户才能访问此脚本。您需要申请并获得使用许可。通常情况下,付款后即可获得许可。更多详情,请按照下方作者的说明操作,或直接联系D_Indicators。
TradingView不建议您付费购买或使用任何脚本,除非您完全信任其作者并了解其工作原理。您也可以在我们的社区脚本找到免费的开源替代方案。
作者的说明
For access, please contact us. 📞: +91 - 7984128073 WhatsApp: https://wa.me/message/PWOK6HXQWJ6LF1 Telegram: http://t.me/dindicators1
免责声明
这些信息和出版物并非旨在提供,也不构成TradingView提供或认可的任何形式的财务、投资、交易或其他类型的建议或推荐。请阅读使用条款了解更多信息。