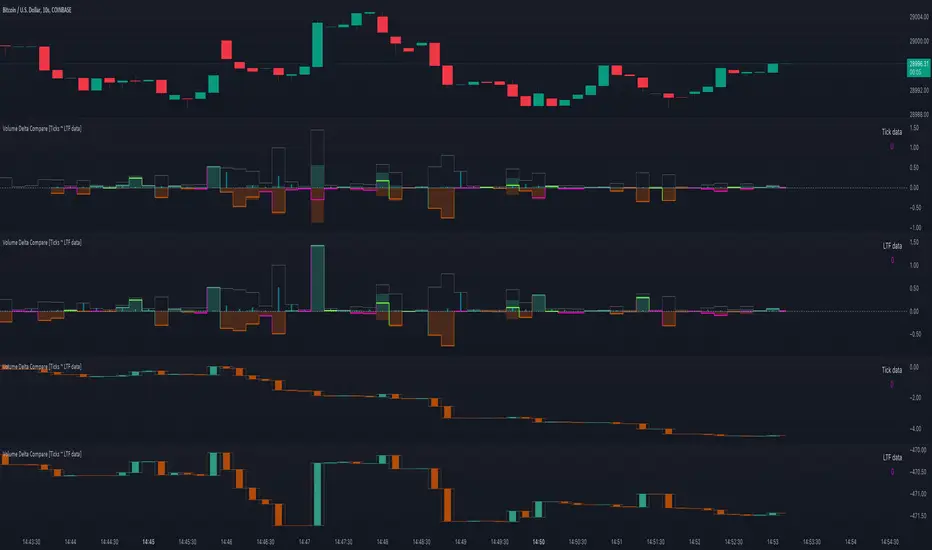
The "Volume Delta Compare [Ticks ~ LTF data]" publication shows 2 different techniques to show into-depth details of Volume, using Tick and Lower-Time-Frame (LTF) data.
🔶 USAGE
Check for divergences between price and volume movement
Check details (why and when a ΔV developed)
Or if you want to see a lot of data stacked on each other )
🔶 CONCEPTS
🔹 Tick vs. LTF data
a Tick is an measure of (upward or downward) movement in price OR volume.
We can use this data by using varip in the code.
Advantage:
• Detail, detail, detail
• Accurate, per tick
Disadvantage:
• Only realtime
• Can reset 'easily' -> loss of data
• Will reset when settings are changed
LTF data, through the request.security_lower_tf() function, measures the OHLCV data per LTF bar
Advantage:
• Access to history when loading a chart
• No 'loss' of data when chart resets
Disadvantage:
• Less detailed
• Less accurate
This script makes it possible to compare the 2 techniques and enables you to show different values.
🔹 Values
There are mainly 3 important values:
• UP volume (uV): volume when price rises
• DOWN volume (dV): volume when price falls
• NEUTRAL volume (nV): volume when price stays the same
From this, additional data is calculated:
• Volume Delta (ΔV): uV minus dV
• Cumulative Delta Volume (cΔV): sum of ΔV
One typical nV is at open: at that moment there isn't a base price to compare with,
so when the first trade doesn't fully fill the first supply (up or down), volume will rise, but price just is 'open', no movement -> no uV or dV.
• Tick data: every volume changement per tick will be added to the concerning variable (uV, dV or nV)
• LTF data: every volume changement of each bar will be added to the concerning variable (uV, dV or nV)
-> this can easily give a difference, for example (Tick vs. 1 minute LTF), when most of the ticks caused a rise of price, but at the last few seconds, a few ticks causes the close to come below open, with Tick data this could give more UP Volume, while LTF data will show 1 value of DOWN Volume.
🔶 EXAMPLES
🔹 Details
In these examples you can see:
• grey line: Total volume (higher precision)
• UP/DOWN/NEUTRAL Volume
• green columns: uV
• orange columns: dV
• blue pillars: nV
• coloured stepline: reflects ΔV
• close > open and positive ΔV -> green
• close > open but negative ΔV -> fuchsia
• close < open and negative ΔV -> orange
• close < open but positive ΔV -> bright lime green
• Right side -> indication of used data (Tick/LTF data) + last ΔV
• labels (can be disabled)
Above 0 (only with Tick data): data from EVERY tick (ΔV [ΔP]):
• first the amount of Volume (0 when the amount is very minimal)
• between brackets: price movement
Below 0:
• Σ V: sum of uV, dV and nV, for that bar
• Σ up: sum of uV for that bar
• Σ dn: sum of dV for that bar
• Σ nt: sum of nV for that bar
• Σ P: sum of price movement, for that bar (only at Tick data)
(At the right you'll see a new bar just started)
Here is a detail of the first second at opening:
🔹 Cumulative Volume Delta (CVD)
Difference CVD based on Tick vs. LTF data:
(horizontal lines added for reference)
🔶 FEATURES
🔹 Minimal plotting of na values
Data window and status line only show what is applicable (tick or LTF data) to diminish clutter of data values:
The Tick option has a label above 0 which includes details of every Tick.
If data is added every tick, that label on a 10 minute chart will be filled beyond limitations pretty quickly (string max_length = 4096 limit).
To prevent the script stopping to execute, at a certain limit, this label will stop updating and show the message "Too much data".
The label below the 0-line won't reach that limit, so it will keep on updating.
Timeframes closer to 1 second will have less risk to reach that 4096 limit. Details will remain to show in this case.
🔹 Automatic label colour adaption when changing between dark/light mode values
Label background/text-colour will adapt according to the dark/light-mode by using chart.fg_color/chart.bg_color
🔶 SETTINGS
🔹 Data from: Ticks vs. LTF data
🔹 LTF: Lower Time-Frame for when LTF option is chosen: 1, 5, 10, 15, 30 Seconds or 1 minute
🔹 Also start when bar already has data: only for tick data -> when disabled calculations only start on a new bar.
🔹 CVD, Only show Cumulative Delta Volume: enable to just display CVD
🔹 Colours: colour at the right is for price/volume direction divergences
🔹 Label: choose what you want to display + size labels
🔹 0-line: The label under the 0-line sometimes goes below the chart. this can be adjusted with this setting.
版本注释
Set LTF default at "1" (minute) since certain plans cannot have access to second-time based timeframes. In that way they still can load the indicator. However, upgrading the plan to Premium, Expert, Elite or Ultimate is necessary to be able to use the LTF second options 开源脚本
秉承TradingView的精神,该脚本的作者将其开源,以便交易者可以查看和验证其功能。向作者致敬!您可以免费使用该脚本,但请记住,重新发布代码须遵守我们的网站规则。
Who are PineCoders?
tradingview.com/chart/SSP/yW5eOqtm-Who-are-PineCoders/
TG Pine Script® Q&A: t.me/PineCodersQA
- We cannot control our emotions,
but we can control our keyboard -
tradingview.com/chart/SSP/yW5eOqtm-Who-are-PineCoders/
TG Pine Script® Q&A: t.me/PineCodersQA
- We cannot control our emotions,
but we can control our keyboard -
免责声明
这些信息和出版物并非旨在提供,也不构成TradingView提供或认可的任何形式的财务、投资、交易或其他类型的建议或推荐。请阅读使用条款了解更多信息。
开源脚本
秉承TradingView的精神,该脚本的作者将其开源,以便交易者可以查看和验证其功能。向作者致敬!您可以免费使用该脚本,但请记住,重新发布代码须遵守我们的网站规则。
Who are PineCoders?
tradingview.com/chart/SSP/yW5eOqtm-Who-are-PineCoders/
TG Pine Script® Q&A: t.me/PineCodersQA
- We cannot control our emotions,
but we can control our keyboard -
tradingview.com/chart/SSP/yW5eOqtm-Who-are-PineCoders/
TG Pine Script® Q&A: t.me/PineCodersQA
- We cannot control our emotions,
but we can control our keyboard -
免责声明
这些信息和出版物并非旨在提供,也不构成TradingView提供或认可的任何形式的财务、投资、交易或其他类型的建议或推荐。请阅读使用条款了解更多信息。
