OPEN-SOURCE SCRIPT
已更新 Camarilla Fibonachi Breakout Indicator with Alerts
This Script can be used for Intraday Only.
This Script will Plot the following Lines in the Chart
1. VWAP (Colour will be ploted as per the following condition)
VWAP Line will Plotted in Green if Open Price is Greater Than Close
VWAP Line will Plotted in Red if Open Price is Less Than Close
2. VWMA (VWMA Period used 14)
3. Atr Trailing Stoploss
(ATR Period 5, ATR Multiplier 2.5 is used to plot the Lines)
4. 15 Min High Low of the day will be plotted as dotted Purple lines
5. H4 as BuyAbove Level
6. H3 as Buy Stop Loss Level
7. H5 as Buy Target 1 Level
8. H6 as Buy Target 2 Level
9. H7 as Buy Target 3 Level
10. H8 as Buy Target 4 Level
11. H9 as Buy Bonus 1 Level
12. H10 as Buy Bonus 2 Level
13. H11 as Buy Bonus 3 Level
14. H12 as Buy Bonus 4 Level
15. L4 as Sell Below Level
16. L3 as Sell Stop Loss Level
17. L5 as Sell Target 1 Level
18. L6 as Sell Target 2 Level
19. L7 as Sell Target 3 Level
20. L8 as Sell Target 4 Level
21. L9 as Sell Bonus 1 Level
22. L10 as Sell Bonus 2 Level
23. L11 as Sell Bonus 3 Level
24. L12 as Sell Bonus 4 Level
This script will generate Buy signal on he following condition
1.Close Must be Greater than H4
if Calculate Inside Camarilla is Enabled then the Script will check whether Yesterdays H4 is Less than Todays H4
2.Close Must be Greater than VWAP
3.Volume Must be Greater Than 20 Period Simple Moveing Average
4.Buy Signal will be Displayed only Once for a Day.
This script will generate Sell signal on he following condition
1.Close Must be Less than L4
if Calculate Inside Camarilla is Enabled then the Script will check whether Yesterdays L4 is Less than Todays L4
2.Close Must be Less than VWAP
3.Volume Must be Greater Than 20 Period Simple Moveing Average
4.Sell Signal will be Displayed only Once for a Day.
and the Alert Message will be Generated for Buy and Sell
版本注释
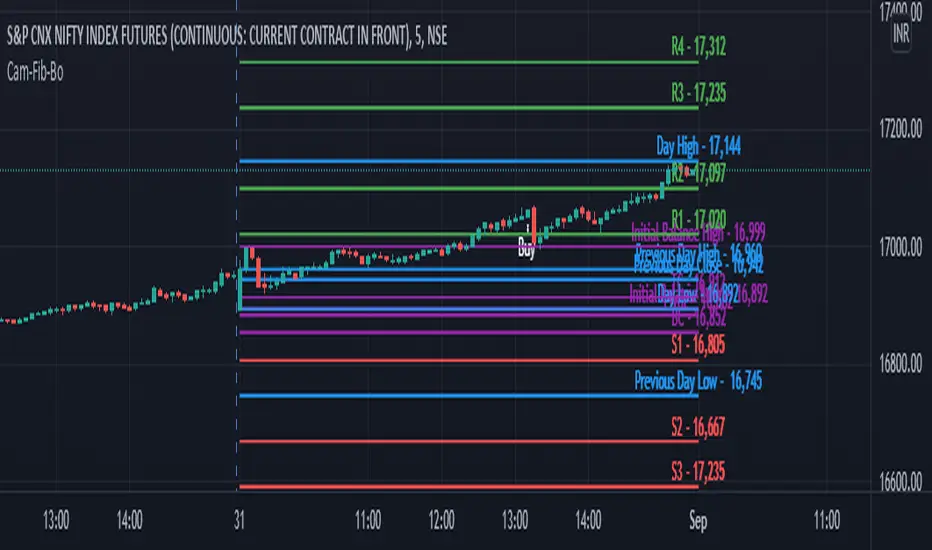
Improvements in this Version 1. Initial Balance Period can be Set by the User
2. Show/Hide Initial Balance High/Low
3. Show/Hide Standard Pivot Points
4. Show/Hide Previous Day High/Low/Close
版本注释
in this version you can choose the way indicator values are plotted, i.e.
if you choose default then values will be plotted in the chart as per tradingview default settings
if you choose continues plot then values will be plotted as a line upto the days end in the morning itself.
版本注释
in this version previous day values are also covered under continuous line format while plotting the indicator values版本注释
In This Version Initial Balance is also Covered in continuous line plotting style.开源脚本
秉承TradingView的精神,该脚本的作者将其开源,以便交易者可以查看和验证其功能。向作者致敬!您可以免费使用该脚本,但请记住,重新发布代码须遵守我们的网站规则。
免责声明
这些信息和出版物并非旨在提供,也不构成TradingView提供或认可的任何形式的财务、投资、交易或其他类型的建议或推荐。请阅读使用条款了解更多信息。
开源脚本
秉承TradingView的精神,该脚本的作者将其开源,以便交易者可以查看和验证其功能。向作者致敬!您可以免费使用该脚本,但请记住,重新发布代码须遵守我们的网站规则。
免责声明
这些信息和出版物并非旨在提供,也不构成TradingView提供或认可的任何形式的财务、投资、交易或其他类型的建议或推荐。请阅读使用条款了解更多信息。