OPEN-SOURCE SCRIPT
FED Rate Decisions (Cuts & Hikes)
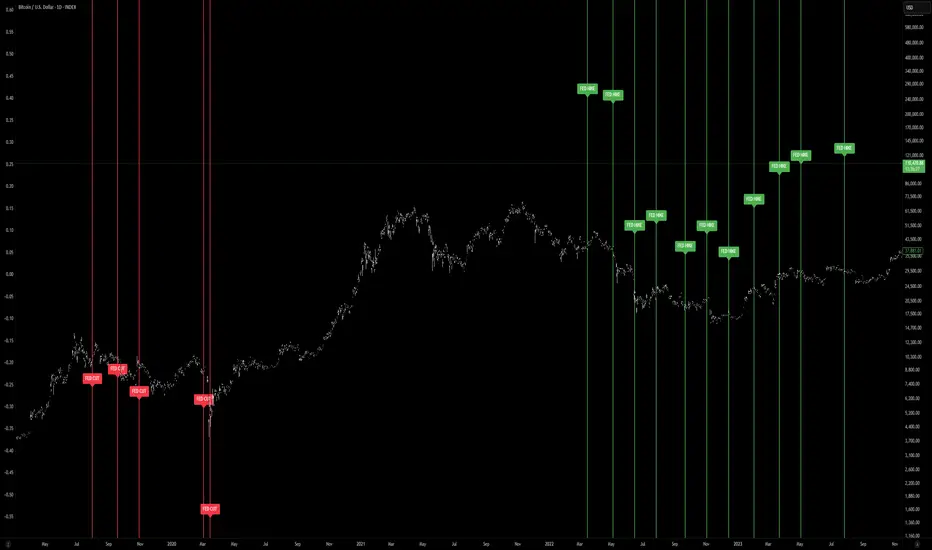
This indicator highlights key moments in U.S. monetary policy by plotting vertical lines on the chart for Federal Reserve interest rate decisions.
Features:
Rate Cuts (red): Marks dates when the Fed reduced interest rates.
Rate Hikes (green): Marks dates when the Fed increased interest rates.
Configurable view: Choose between showing all historical decisions or only those from 2019 onwards.
Labels: Each event is tagged with “FED CUT” or “FED HIKE” above or below the bar (adjustable).
Alerts: You can set TradingView alerts to be notified when the chart reaches a Fed decision day.
🔧 Inputs:
Show decisions: Switch between All or 2019+ events.
Show rate cuts / hikes: Toggle visibility separately.
Colors: Customize line and label colors.
Label position: Place labels above or below the bar.
📈 Usage:
This tool helps traders and investors visualize how Fed policy shifts align with market movements. Rate cuts often signal economic easing, while hikes suggest tightening monetary policy. By overlaying these events on price charts, you can analyze historical reactions and prepare for similar scenarios.
开源脚本
秉承TradingView的精神,该脚本的作者将其开源,以便交易者可以查看和验证其功能。向作者致敬!您可以免费使用该脚本,但请记住,重新发布代码须遵守我们的网站规则。
免责声明
这些信息和出版物并非旨在提供,也不构成TradingView提供或认可的任何形式的财务、投资、交易或其他类型的建议或推荐。请阅读使用条款了解更多信息。
开源脚本
秉承TradingView的精神,该脚本的作者将其开源,以便交易者可以查看和验证其功能。向作者致敬!您可以免费使用该脚本,但请记住,重新发布代码须遵守我们的网站规则。
免责声明
这些信息和出版物并非旨在提供,也不构成TradingView提供或认可的任何形式的财务、投资、交易或其他类型的建议或推荐。请阅读使用条款了解更多信息。