OPEN-SOURCE SCRIPT
US 10Y - US 2Y Spread
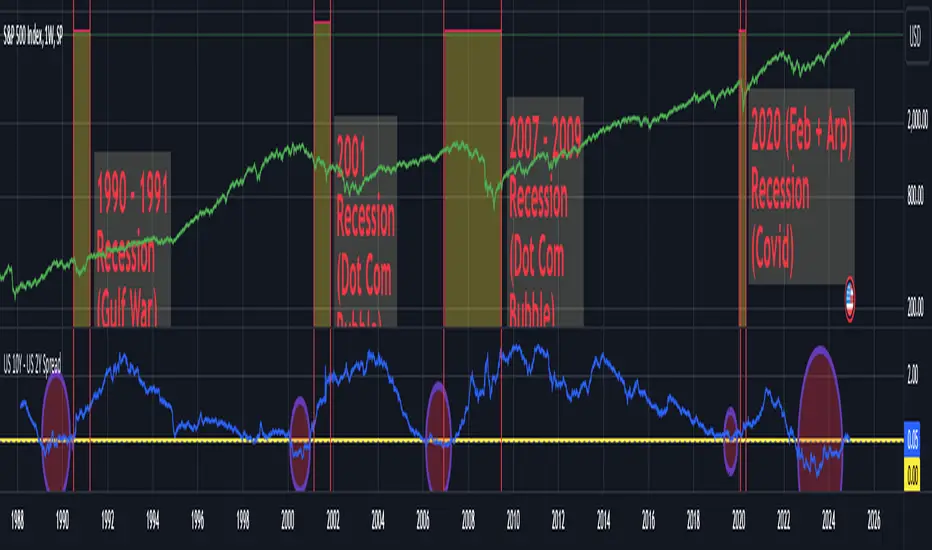
This script displays the Yield Spread between the 10 Year US Treasury Bond (US10Y) and the 2 Year US Treasury Bond (US02Y) as a blue line beneath the chart. It is best to be used on weekly charts a the yield spread is a leading indicator used for detecting possible recessions within the US economy.
A negative yield spread means the 2 year treasury bonds are paying a higher yield than 10 year treasury bonds indicating a possible slowdown of the US economy. In the past negative yield spreads where often followed by recessions and major corrections of the S&P500... you can see examples for this on the above chart for the Gulf War recession, the DotCom Bubble recession, the great recession due to the US housing market collapse and the short COVID recession.
Currently we are in an extended phase of negative yield spreads and if history repeats itself we could be in for a major correction on the financial markets within the next years.
开源脚本
秉承TradingView的精神,该脚本的作者将其开源,以便交易者可以查看和验证其功能。向作者致敬!您可以免费使用该脚本,但请记住,重新发布代码须遵守我们的网站规则。
免责声明
这些信息和出版物并非旨在提供,也不构成TradingView提供或认可的任何形式的财务、投资、交易或其他类型的建议或推荐。请阅读使用条款了解更多信息。
开源脚本
秉承TradingView的精神,该脚本的作者将其开源,以便交易者可以查看和验证其功能。向作者致敬!您可以免费使用该脚本,但请记住,重新发布代码须遵守我们的网站规则。
免责声明
这些信息和出版物并非旨在提供,也不构成TradingView提供或认可的任何形式的财务、投资、交易或其他类型的建议或推荐。请阅读使用条款了解更多信息。