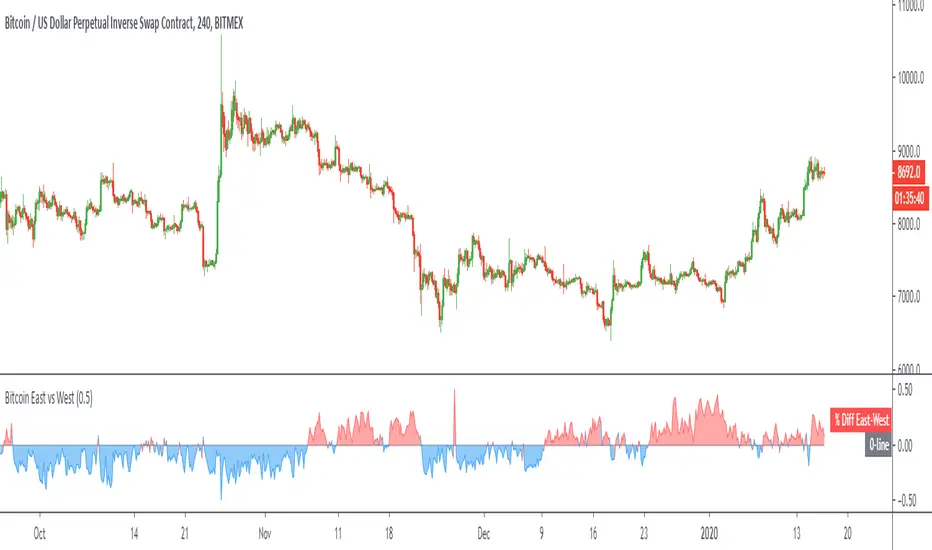
Bitcoin East vs WestPlots the volume weighted price difference between the top spot exchanges in the "East" (Asian markets) versus the "West" (US/UK/EU markets). Optional: view the volume difference between the two.Pine Script®指标由capriole_charles提供1010313
Bitcoin Halving CountdownHello traders, I offer you today the BTC halving countdown updated in real-time on your charts I inspired myself greatly from the gentleman @everget's script LTC halving countdown below ( The countdown date is coming from that source www.bitcoinblockhalf.com. The halving date is estimated to be around May 13th, 2020 . That date is hardcoded in the script and is used for the countdown calculation. The Bitcoin block mining reward halves every 210,000 blocks, the coin reward will decrease from 12.5 to 6.25 coins. Enjoy the weekend DavePine Script®指标由Daveatt提供77138
PVT Osc - Price Volume Trend Oscillator [UTS]The oscillator version of the Price Volume Trend indicator (PVT) can be considered as a leading indicator of future price movements. The PVT Indicator is similar to the On Balance Volume indicator as it is also used to measure the strength of a trend. The difference between the OBV and the PVT is that where the OBV adds all volumes when price achieves higher daily closes and subtracts them when price registers a lower daily close, the PVT adds or subtracts only a portion of the volume from the cumulative total in relation to a percentage change in price. The general market consensus is that this difference enables the PVT to more accurately represent money flow volumes in and out of a stock or commodity. The PVT has been designed so that it is capable of forecasting directional changes in price. For instance, if the price of a stock is rising and the PVT begins to fall, then this is indicative that a price reversal could occur very soon. The general consensus is that the PVT is more accurate at detecting new trading opportunities than the OBV because of the differences in their construction. The OBV is designed so that it adds the same amount of volume whether the price closes upwards by just a small fraction or by multiples of its day opening value. On the other hand, the PVT adds volume proportional to the amount the price closed higher. General Usage Plain old PVT can be used to confirm trends, as well as spot possible trading signals due to divergences. A benefit of the oscillator version is that it can produce LONG or SHORT signals on zero line cross. Or controversy, disallow LONG trades in bearish territory and disallow SHORT trades in bullish territory. Moving Averages 4 different Moving Averages are available: EMA (Exponential Moving Average) SMA (Simple Moving Average) VWMA (Volume Weighted Moving Average) WMA (Weighted Moving Average)Pine Script®指标由UberTradingSystems提供已更新 1919 1.4 K
MFI - Money Flow Index [UTS]Money Flow Index (MFI) is the technical indicator, which indicates the rate at which money is invested into a security and then withdrawn from it. Construction and interpretation of the indicator is similar to Relative Strength Index with the only difference that volume is important to MFI. Usage: When analyzing the money flow index one needs to take into consideration the following points: divergences between the indicator and price movement. If prices grow while MFI falls (or vice versa), there is a great probability of a price turn; Money Flow Index value, which is over 80 or under 20, signals correspondingly of a potential peak or bottom of the market. Common known variants of this type of indicator are the On Balance Volume, Chaikin Oscillator or Chaikin Money Flow. Based on www.metatrader5.com Pine Script®指标由UberTradingSystems提供114
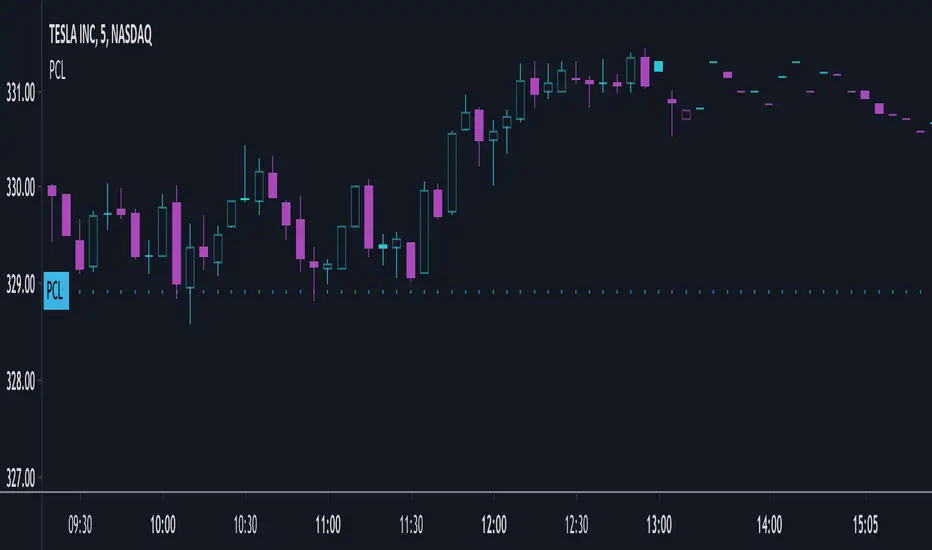
(PCL) Previous CloseI have recently been reading How to Day Trade for a Living by Andrew Aziz and one of the important support and resistance levels he talks about is the Previous Day Close Price. I did not find an indicator that would simply plot this so I wrote a short simple pine script to plot the indicator. Please feel free to edit or suggest improvements.Pine Script®指标由PremiumAlgos提供2323413
[RS]Plot in 3DEXPERIMENTAL: plotting price,time,volume + additional price shift from moving average.Pine Script®指标由RicardoSantos提供88235
PriceScalperThis is a simple script that will visually show where buy and sell points occur based upon configurable price action. I wrote this purposefully to evaluate stablecoins and other narrow or fixed ranged markets where algorythms don't generally do well. Putple triangles, pointing up, are buy signals. Purple triangles, pointing down are sell signals Alert conditions of BUY ASSET and SELL ASSET are provided for convience.Pine Script®指标由RobertD7723提供已更新 33529
R100 Volatility Combo Bands v1 (*v*)The Volatility Combo Bands are made from 4 separate volatility bands- two Bollinger Bands (10 and 20 period) and two Price Headley Acceleration Bands (10 and 20 period). The Volatility Combo Bands plot the innermost upper and lower points from these bands and then plots a mid-line. By default, only the standard 20 period Bollinger Bands and Combo Bands with mid-line are displayed, but can be configured however you want. Try it out- see squeezes earlier, ride the bands earlier in trending markets, trade pullbacks to the Combo Bands and mid-line, trade the range of the band or use them to help identify potential support and resistance levels. Hopefully they can add another dimension to identifying volatility contraction patterns or whatever you currently use these things for! I hope you get some value out of it. Only conditions of use are that if you improve it, let me know and if you publish something that uses it, don't hide the code! Enjoy! Code for the Price Headley Acceleration Bands pinched and modified from LazyBear - thankyou. Pine Script®指标由Rooster100提供22108
Strategy based on the principles of Price ActionIt is considered the percentage of candles with low and high closure for a certain period. Then, a moving average is built from these values. When the moving average of the ratio of tall candles to low candles is greater than the ratio of low candles to high, then long (that is, when the green line crosses the red). And vice versa - a condition for short. It also works on crypto with other settings. Idea for improvement: you can make partial exit by taking, at certain profit levels, the chart will be more stable. Result with a commission of 0.004% You can create an optimizer, and use this strategy on any liquid asset. (Sorry for google translator)Pine Script®策略由UnknownUnicorn3282100提供22581
Waves in Price (Volume Waves)Waves in Price (Volume Waves) TheDowVolumeBigot>0 (Bullish) =Lime color Very High=Dark Green color High=Green color TheDowVolumeBigot<0 (Bearish) =Orange color Low=Red color Very Low=Dark Red color Barcolor Pine Script®指标由ceyhun提供已更新 99558
Bitcoin Price Model v1.1Bitcoin Price Model - Long Term Support Resistance Lines with error bands.Pine Script®指标由UnknownUnicorn30297提供44194
Forecast Oscillator & Point of ForceThis is a scaled version of the Forecast Oscillator, paired with a Point of Force Indicator, my modification of an indicator, whose original name and developer happened to be missing on my notes, so my regards to the author). Point of force is a spot from where price action will dynamically evolve in the same direction or soon reverse and pursue that reversed path. It may be an indication of a turning point or entry point to consider going long/short and should be use together with a background oscillator showing a prevailing local trend.Pine Script®指标由capissimo提供33237
Previous OHLC LevelsQuick dirty code for personal use. Plots previous OHLC levels based on a selected time-frame on the chart. Not bad if you want to see different time-frame levels. Fill function can serve to highlight the daily range (high-low or open-close) on non-standard charts Uses base code from JayRogersPine Script®指标由kewbimingle提供11548
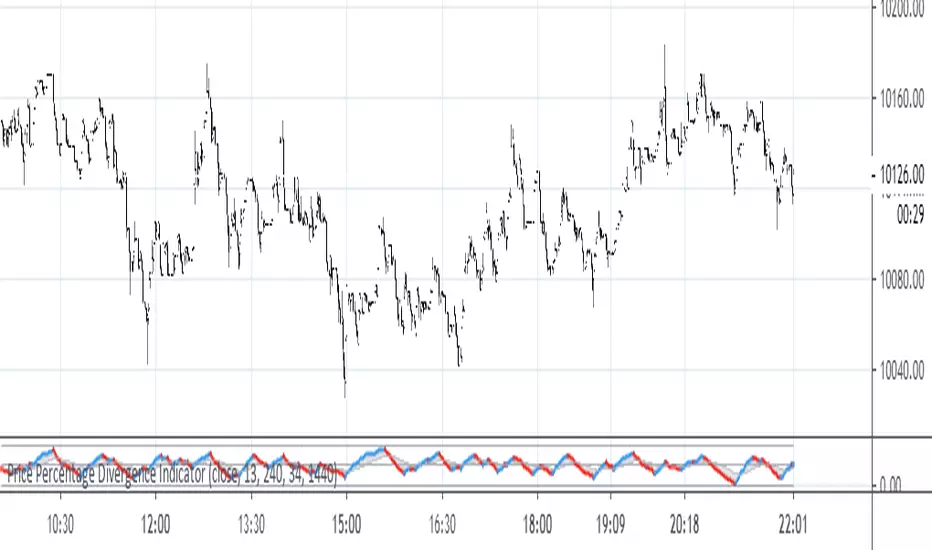
Price Percentage Divergence IndicatorThis is a price percentage divergence ( PPO ) indicator. It may as well be called a turning points indicator.)Pine Script®指标由capissimo提供44151
Current Price Label by Westy_A simple Indicator to display the current price of the asset above the current bar. It shows a green label if the close is equal or greater than the open, red otherwise. Pine Script®指标由Westy_提供44136
Current Price Bar LabelA simple Indicator to display the current price of the asset above the current bar. It shows a green label if the close is equal or greater than the open, red otherwise. Pine Script®指标由Westy_提供22108
PriceDivergence (ps4)This script implements price divergence module using signals from several factors like: RSI, RSI Stochastic, MACD, Volume MA, Accumulation/Distribution, Fisher Transform and CCI Pine Script®指标由capissimo提供已更新 22246
Multi Horizontal Lines 540Draws horizontal lines depends on condition of regular price, if 10000 then increment is 540, otherwise increment by 54Pine Script®指标由SuperUserek提供11143
IO_Volatility Quality Zero LineThis is the Volatility Quality Zero Line Indicator. This indicator measures volatility strength. Pine Script®指标由sarangab提供已更新 55450
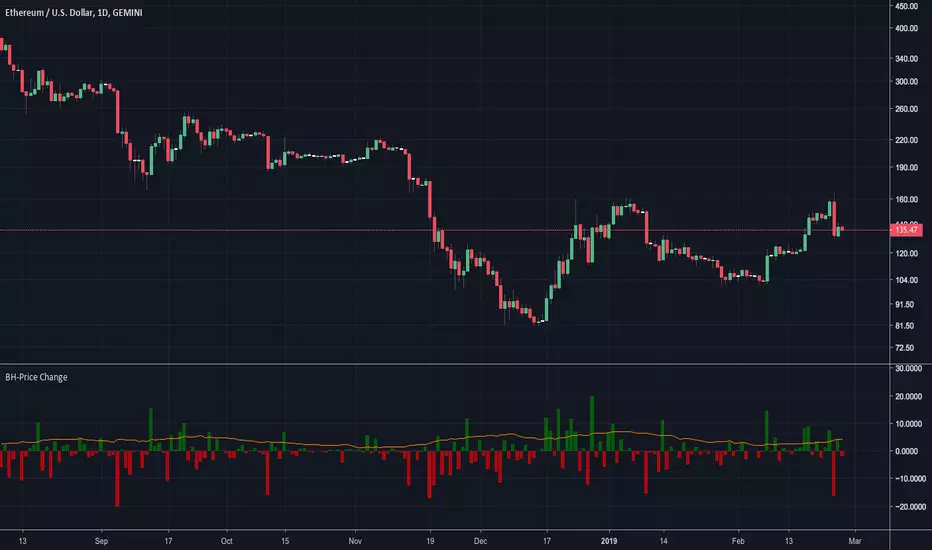
BossHouse - Price ChangeBossHouse - Price Change What it is: In the stock market, a price change is the difference in trading prices from one period to the next or the difference between the daily opening and closing prices of a share of stock. Here you have a timeline with a bar price change. In seconds you can see if the selected market has good and high price changes or not. The values are in percentage and you have a limiter in the settings, so you can show only bar/values above a value. Ex. 2.4%. Why it Matters: Price changes are a core component of financial analysis, and predicting price changes can be as, if not more, important than an actual price change. It is important to remember, however, that percent-based price changes are useful only in the context of the number of dollars involved. A 75% change in the price of a company X, for example, may only involve a few dollars while a 75% change in the price of company Y may involve thousands of dollars. Settings: Show the SMA 21 line Minimum Limit - Set the minimum value to show a bar Calculation: For example, let's say Company XYZ shares opened at $25 this morning and closed at $24. The price change is -$1, or -$1/$25 = -4%. Any help and suggestions will be appreciated. Marcos Issler @ IsslermanPine Script®指标由isslerman提供44120
Dynamic Price ChannelsThis indicator plots dynamic price channels based on the security highest close and lowest open. The default is to display 8 core channels (with the option to plot the sub channel lines, off by default). It’s simple really—this just divides the price action into equal channels. I’ve found this pattern helpful across all markets. It’s dynamic because if a new high close or a new low close is created the all channels will adjust. The key levels are 75% (blue), 50% (aqua), 25% (blue). In between those key levels is a level separator. The high close and the low open are both red. These can all be customized in the settings. What you’ll typically see at these channel boundaries are price slow downs, reversals, support and resistance. Turning on sub-channels will provide further channel plots. On these sub-channels you’ll also see the same type of price action activity as mentioned above. I’ve developed a trading system where this indicator helps identify key pivot areas. Combined with a few other indicators and key EMAs this trade system provides high probability trades around these key channel areas. Pine Script®指标由RexDogActual提供已更新 44330