Volume Delta Highlighted (Pane)A simple volume delta indicator that highlights blue when the bar has no wicks and white with it has only opposite end wicks ,a good confluence and visual
note :
not as accurate as the paid tradingview indicator since it uses chart data
成交量升降线(ADVL)

Session Dominance Profile [Pointalgo]Session Dominance Profile is a visual volume-distribution tool that shows which global trading session (Asia, London, or New York) dominates price activity across different price levels within a defined historical range.
The indicator builds a horizontal volume profile using candle close prices and volume, then classifies each price level by the session that contributed the highest volume.
How It Works :
The script analyzes a configurable lookback period
Price range is divided into multiple horizontal bins
Volume is accumulated per price level
Each bin is split into three session buckets:
Asia Session (Yellow)
London Session (Blue)
New York Session (Red)
The session with the highest volume at that price level determines the color
This results in a Session-based Dominance Profile, helping traders visually identify:
Where major sessions were most active
Session-specific acceptance or rejection zones
Potential intraday and swing reaction areas
Practical Use Cases :
Identify price levels dominated by a specific session
Understand session rotation and participation
Combine with:
Market structure
Support & resistance
VWAP or moving averages
Useful for intraday, scalping, and swing trading
Inputs Explained:
Lookback – Number of historical bars used to build the profile
Resolution – Number of price bins (higher = more detail)
Fixed Width (Bars) – Maximum horizontal width of the profile
Offset (Bars) – Distance of the profile from the current bar
Profile Direction – Left-to-Right or Right-to-Left rendering
Session Time Reference:
All sessions are calculated using UTC time.
Important Notes:
This indicator is visual and analytical only
It does not generate buy or sell signals
No repainting: the profile is calculated on the last bar only
Designed for educational and research purposes
Disclaimer:
This script does not provide financial advice.
Trading involves risk, and past volume behavior does not guarantee future results.
Always confirm signals using additional analysis and proper risk management.

Multi-Timeframe EMA Trend Dashboard with Volume and RSI Filters═══════════════════════════════════════════════════════════
MULTI-TIMEFRAME EMA TREND DASHBOARD
═══════════════════════════════════════════════════════════
OVERVIEW
This indicator provides a comprehensive view of trend direction across multiple timeframes using the classic EMA 20/50 crossover methodology, enhanced with volume confirmation and RSI filtering. It aggregates trend information from six timeframes into a single dashboard for efficient market analysis.
The indicator is designed for educational purposes and to assist traders in identifying potential trend alignments across different time horizons.
═══════════════════════════════════════════════════════════
FEATURES
═══════════════════════════════════════════════════════════
MULTI-TIMEFRAME ANALYSIS
• Monitors 6 timeframes simultaneously: 1m, 5m, 15m, 1H, 4H, 1D
• Each timeframe analyzed independently using request.security()
• Non-repainting implementation with proper lookahead settings
• Calculates overall trend strength as percentage of bullish timeframes
EMA CROSSOVER SYSTEM
• Fast EMA (default: 20) and Slow EMA (default: 50)
• Bullish: Fast EMA > Slow EMA
• Bearish: Fast EMA < Slow EMA
• Neutral: Fast EMA = Slow EMA (rare condition)
• Visual EMA plots with optional fill area
VOLUME CONFIRMATION
• Optional volume filter for crossover signals
• Compares current volume against moving average (default: 20-period SMA)
• Categorizes volume as: High (>1.5x average), Normal (>average), Low (70), oversold (<30), and neutral zones
• Used in quality score calculation
• Optional display toggle
SUPPORT & RESISTANCE DETECTION
• Automatic detection using highest/lowest over lookback period (default: 50 bars)
• Plots resistance (red), support (green), and mid-level (gray)
• Step-line style for clear visualization
• Optional display toggle
QUALITY SCORING SYSTEM
• Rates trade setups from 1-5 stars
• Considers: MTF alignment, volume confirmation, RSI positioning
• 5 stars: 4+ timeframes aligned + volume confirmed + RSI 50-70
• 4 stars: 4+ timeframes aligned + volume confirmed
• 3 stars: 3+ timeframes aligned
• 2 stars: Exactly 3 timeframes aligned
• 1 star: Other conditions
VISUAL DASHBOARD
• Clean table display (position customizable)
• Color-coded trend indicators (green/red/yellow)
• Extended statistics panel (toggleable)
• Shows: Trends, Strength, Quality, RSI, Volume, Price Distance
═══════════════════════════════════════════════════════════
TECHNICAL SPECIFICATIONS
═══════════════════════════════════════════════════════════
CALCULATIONS
Trend Determination per Timeframe:
• request.security() fetches EMA values with gaps=off, lookahead=off
• Compares Fast EMA vs Slow EMA
• Returns: 1 (bullish), -1 (bearish), 0 (neutral)
Trend Strength:
• Counts number of bullish timeframes
• Formula: (bullish_count / 6) × 100
• Range: 0% (all bearish) to 100% (all bullish)
Price Distance from EMA:
• Formula: ((close - EMA) / EMA) × 100
• Positive: Price above EMA
• Negative: Price below EMA
• Warning when absolute distance > 5%
ANTI-REPAINTING MEASURES
• All request.security() calls use lookahead=barmerge.lookahead_off
• Dashboard updates only on barstate.islast
• Historical bars remain unchanged
• Crossover signals finalize on bar close
═══════════════════════════════════════════════════════════
USAGE GUIDE
═══════════════════════════════════════════════════════════
INTERPRETING THE DASHBOARD
Timeframe Rows:
• Each row shows individual timeframe trend status
• Look for alignment (multiple timeframes same direction)
• Higher timeframes generally more significant
Strength Indicator:
• >66.67%: Strong bullish (4+ timeframes bullish)
• 33.33-66.67%: Mixed/choppy conditions
• <33.33%: Strong bearish (4+ timeframes bearish)
Quality Score:
• Higher stars = better confluence of factors
• 5-star setups have strongest multi-factor confirmation
• Lower scores may indicate weaker or conflicting signals
SUGGESTED APPLICATIONS
Trend Confirmation:
• Check if multiple timeframes confirm current chart trend
• Higher agreement = stronger trend confidence
• Use for position sizing decisions
Entry Timing:
• Wait for EMA crossover on chart timeframe
• Confirm with higher timeframe alignment
• Volume above average preferred
• RSI not in extreme zones
Divergence Detection:
• When lower timeframes diverge from higher
• May indicate trend exhaustion or reversal
• Requires additional confirmation
CUSTOMIZATION
EMA Settings:
• Adjust Fast/Slow lengths for different sensitivities
• Shorter periods = more responsive, more signals
• Longer periods = smoother, fewer signals
• Common alternatives: 10/30, 12/26, 50/200
Volume Filter:
• Enable for higher-quality signals (fewer false positives)
• Disable in always-liquid markets or for more signals
• Adjust MA length based on typical volume patterns
Display Options:
• Toggle EMAs, S/R levels, extended stats as needed
• Choose dashboard position to avoid chart overlap
• Adjust colors for visibility preferences
═══════════════════════════════════════════════════════════
ALERTS
═══════════════════════════════════════════════════════════
AVAILABLE ALERT CONDITIONS
1. Bullish EMA Cross (Volume Confirmed)
2. Bearish EMA Cross (Volume Confirmed)
3. Strong Bullish Alignment (4+ timeframes)
4. Strong Bearish Alignment (4+ timeframes)
5. Trend Strength Increasing (>16.67% jump)
6. Trend Strength Decreasing (>16.67% drop)
7. Excellent Trade Setup (5-star rating)
Alert messages use standard placeholders:
• {{ticker}} - Symbol name
• {{close}} - Current close price
• {{time}} - Bar timestamp
═══════════════════════════════════════════════════════════
LIMITATIONS & CONSIDERATIONS
═══════════════════════════════════════════════════════════
KNOWN LIMITATIONS
• Lower timeframe data may not be available on all symbols
• 1-minute data typically limited to recent history
• request.security() subject to TradingView data limits
• Dashboard requires screen space (may overlap on small screens)
• More complex calculations may affect load time on slower devices
NOT SUITABLE FOR
• Highly volatile/illiquid instruments (many false signals)
• News-driven markets during announcements
• Automated trading without additional filters
• Markets where EMA strategies don't perform well
DOES NOT PROVIDE
• Exact entry/exit prices
• Stop-loss or take-profit levels
• Position sizing recommendations
• Guaranteed profit signals
• Market predictions
═══════════════════════════════════════════════════════════
BEST PRACTICES
═══════════════════════════════════════════════════════════
RECOMMENDED USAGE
✓ Combine with price action analysis
✓ Use appropriate risk management
✓ Backtest on historical data before live use
✓ Adjust settings for specific market characteristics
✓ Wait for higher-quality setups in important trades
✓ Consider overall market context and fundamentals
NOT RECOMMENDED
✗ Using as standalone trading system without confirmation
✗ Trading every signal without discretion
✗ Ignoring risk management principles
✗ Trading without understanding the methodology
✗ Applying to unsuitable markets/timeframes
═══════════════════════════════════════════════════════════
EDUCATIONAL BACKGROUND
═══════════════════════════════════════════════════════════
EMA CROSSOVER STRATEGY
The Exponential Moving Average crossover is a classical trend-following technique:
• Golden Cross: Fast EMA crosses above Slow EMA (bullish signal)
• Death Cross: Fast EMA crosses below Slow EMA (bearish signal)
• Widely used since the 1970s in various markets
• More responsive than SMA due to exponential weighting
MULTI-TIMEFRAME ANALYSIS
Analyzing multiple timeframes helps traders:
• Identify alignment between short and long-term trends
• Reduce false signals from single-timeframe noise
• Understand market context across different horizons
• Make informed decisions about trade duration
VOLUME ANALYSIS
Volume confirmation adds reliability:
• High volume suggests institutional participation
• Low volume signals may indicate false breakouts
• Volume precedes price in many market theories
• Helps distinguish genuine moves from noise
═══════════════════════════════════════════════════════════
TECHNICAL IMPLEMENTATION
═══════════════════════════════════════════════════════════
CODE STRUCTURE
• Organized in clear sections with proper commenting
• Uses explicit type declarations (int, float, bool, color, string)
• Constants defined at top (BULLISH=1, BEARISH=-1, etc.)
• Functions documented with @function, @param, @returns
• Follows PineCoders naming conventions (camelCase variables)
PERFORMANCE OPTIMIZATION
• var keyword for table (created once, not every bar)
• Calculations cached where possible
• Dashboard updates only on last bar
• Minimal redundant security() calls
SECURITY IMPLEMENTATION
• Proper gaps and lookahead parameters
• No future data leakage
• Signals finalize on bar close
• Historical bars remain static
═══════════════════════════════════════════════════════════
VERSION INFORMATION
═══════════════════════════════════════════════════════════
Current Version: 2.0
Pine Script Version: 5
Last Updated: 2024
Developed by: Zakaria Safri
═══════════════════════════════════════════════════════════
SETTINGS REFERENCE
═══════════════════════════════════════════════════════════
EMA SETTINGS
• Fast EMA Length: 1-500 (default: 20)
• Slow EMA Length: 1-500 (default: 50)
VOLUME & MOMENTUM
• Use Volume Confirmation: true/false (default: true)
• Volume MA Length: 1-500 (default: 20)
• Show RSI Levels: true/false (default: true)
• RSI Length: 1-500 (default: 14)
PRICE ACTION FEATURES
• Show Price Distance: true/false (default: true)
• Show Key Levels: true/false (default: true)
• S/R Lookback Period: 10-500 (default: 50)
DISPLAY SETTINGS
• Show EMAs on Chart: true/false (default: true)
• Fast EMA Color: customizable (default: cyan)
• Slow EMA Color: customizable (default: orange)
• EMA Line Width: 1-5 (default: 2)
• Show Fill Between EMAs: true/false (default: true)
• Show Crossover Signals: true/false (default: true)
DASHBOARD SETTINGS
• Position: Top Left/Right, Bottom Left/Right
• Show Extended Statistics: true/false (default: true)
ALERT SETTINGS
• Alert on Multi-TF Alignment: true/false (default: true)
• Alert on Trend Strength Change: true/false (default: true)
═══════════════════════════════════════════════════════════
RISK DISCLAIMER
═══════════════════════════════════════════════════════════
This indicator is provided for educational and informational purposes only. It should not be considered financial advice or a recommendation to buy or sell any security.
IMPORTANT NOTICES:
• Past performance does not indicate future results
• All trading involves risk of capital loss
• No indicator guarantees profitable trades
• Always conduct independent research and analysis
• Use proper risk management and position sizing
• Consult a qualified financial advisor before trading
• The developer assumes no liability for trading losses
By using this indicator, you acknowledge that you understand these risks and accept full responsibility for your trading decisions.
═══════════════════════════════════════════════════════════
SUPPORT & CONTRIBUTIONS
═══════════════════════════════════════════════════════════
FEEDBACK WELCOME
• Constructive comments appreciated
• Bug reports help improve the indicator
• Feature suggestions considered for future versions
• Share your experience to help other users
OPEN SOURCE
This code is published as open source for the TradingView community to:
• Learn from the implementation
• Modify for personal use
• Understand multi-timeframe analysis techniques
If you find this indicator useful, please consider:
• Leaving a thoughtful review
• Sharing with other traders who might benefit
• Following for future updates and releases
═══════════════════════════════════════════════════════════
ADDITIONAL RESOURCES
═══════════════════════════════════════════════════════════
RECOMMENDED READING
• TradingView Pine Script documentation
• PineCoders community resources
• Technical analysis textbooks on moving averages
• Multi-timeframe trading strategy guides
• Risk management principles
RELATED CONCEPTS
• Trend following strategies
• Moving average convergence/divergence
• Multiple timeframe analysis
• Volume-price relationships
• Momentum indicators
═══════════════════════════════════════════════════════════
Thank you for using this indicator. Trade responsibly and continue learning!
═══════════════════════════════════════════════════════════

Volume Profile AnalysisThe Volume Profile Dashboard is a professional-grade analysis tool built for TradingView. It focuses on displaying a comprehensive volume profile breakdown within a dashboard format directly on the chart. The purpose of this tool is to help traders quickly assess buy versus sell volume dynamics, momentum, and sentiment in order to support informed trading decisions.
Instead of plotting simple bars, this indicator uses a detailed table and visual progress bar to summarize live and historical market activity. By condensing key metrics into a structured format, traders can analyse market behaviour without manually calculating or switching between multiple indicators.
________________________________________
How the Script Works
1. Data Gathering
The script uses lower-timeframe price and volume data to calculate buy volume, sell volume, and total traded volume for the current and previous candles.
2. Volume Allocation
Buy and sell volumes are estimated by looking at the candle’s range (high to low) and how the closing price aligns within that range. The closer the close is to the high, the stronger the buying pressure. The closer the close is to the low, the stronger the selling pressure.
3. Delta and Momentum
o Delta measures the difference between buy and sell volume.
o Volume momentum compares the current candle’s activity to the previous one, showing if interest is rising or fading.
4. Point of Control (POC)
An average of high, low, and close is calculated to give an approximate “point of control” level—an area of balance where buyers and sellers previously agreed on price.
5. Dashboard Visualization
All these calculations are displayed inside a clean dashboard table with separate rows for the current candle, previous candle, and a summary row. Icons, colors, and progress bars make it visually intuitive.
6. On-Chart Progress Indicator
A dynamic horizontal progress bar is plotted on the chart above price, showing the balance between buy and sell volume for the latest activity.
7. Alerts
Built-in alerts trigger when strong buying or selling pressure is detected or when there is a significant spike in total traded volume.
________________________________________
How This Tool Can Be Used
• Intraday Trading: Quickly gauge whether buyers or sellers are in control of the market at any moment.
• Swing Trading: Compare momentum shifts between candles to identify early trend reversals.
• Risk Management: Use delta and sentiment signals to confirm whether to hold or reduce exposure.
• Confirmation: Align the volume profile dashboard with other indicators (such as RSI, MACD, or trendlines) for stronger trading conviction.
________________________________________
Using Mixed Indicators for Decisions
This dashboard alone provides volume insights, but better decisions come when it is combined with other tools:
• Pairing it with an RSI can show whether heavy buying is happening in overbought conditions.
• Combining with a SuperTrend or moving averages can confirm if volume momentum aligns with the price trend.
• Overlaying support/resistance levels can identify whether strong buy/sell signals occur at critical levels.
Mixed indicators prevent relying on one signal alone, reducing false trades.
________________________________________
Importance of This Tool
• Clarity: Condenses complex volume data into a simple, visual format.
• Speed: Traders can react faster with pre-calculated buy/sell percentages.
• Precision: Highlights hidden imbalances that are not obvious from candles alone.
• Professional-grade dashboard: Offers an institutional-style view of market behavior directly within TradingView.
________________________________________
Parameters in the Dashboard Table
• Period: Shows whether the row is for the current or previous candle, along with trend arrows.
• Price Range: The high–low range of the candle.
• Total Volume: The sum of buy and sell activity.
• Buy Volume / Sell Volume: Separated distribution of transactions leaning bullish or bearish.
• Delta: The net difference between buy and sell volumes, highlighting pressure imbalance.
• Buy % / Sell %: The percentage contribution of each side to total volume.
• POC: An average reference level where market consensus was strongest.
• Progress: A graphical bar showing buy vs sell dominance.
• Signal: Simplified output like Strong Buy, Buy, Strong Sell, Sell, Neutral.
• Summary Row: Compares changes between the current and previous candles and gives overall market sentiment.
________________________________________
Stock Market Disclaimer
This tool is for educational and informational purposes only. It does not constitute financial advice, investment advice, or trading recommendations. The stock market and cryptocurrency markets involve high risk. Traders and investors should do their own research and consult licensed financial advisors before making investment decisions. Past performance is not indicative of future results.
________________________________________
Misuse Disclaimer
This script has been developed as per TradingView’s rules and is intended for responsible trading analysis only. Any misuse, redistribution, or modification outside of TradingView’s policies is discouraged. The author and platform are not responsible for financial losses, misinterpretation of signals, or misuse of the code.
________________________________________
Disclaimer
Training & Educational Only — This material and the indicator are provided for educational purposes only. Nothing here is investment advice or a solicitation to buy or sell financial instruments. Past simulated or historical performance does not predict future results. Always perform full back testing and risk management, and consider seeking advice from a qualified financial professional before trading with real capital.
________________________________________

Big Orders Detector - Whale Activity SpotterDetect Institutional & Whale Trading Activity with Volume Analysis
This indicator helps traders identify significant buy/sell orders (whale activity) by analyzing volume spikes and price movements. Perfect for spotting institutional entries and exits.
📊 Key Features:
Volume Spike Detection - Identifies when volume exceeds average by customizable multiplier
Price Movement Analysis - Tracks significant price changes with adjustable threshold
Smart Direction Detection - Distinguishes between big buy and sell orders
Visual Markers - Clear arrows, background highlights, and detailed labels
Flexible Settings - Fully customizable parameters for different trading styles
Statistics Table - Optional real-time order count tracking
Alert System - Built-in alerts for automated notifications
⚙️ How It Works:
The indicator combines volume analysis with price movement detection to identify unusual market activity. When volume significantly exceeds the moving average AND price shows meaningful movement, it marks these as potential whale orders.
🎯 Best Used For:
Crypto markets with high volume activity
Forex pairs during major news events
Stock trading around earnings/announcements
Identifying institutional accumulation/distribution
📈 Settings Guide:
Volume Multiplier (3.0) - How many times above average volume (recommended minimum: 3.0)
Volume Period (20) - Moving average period for volume
Price Threshold (1.5%) - Minimum price change requirement
Visual Options - Toggle arrows, labels, and background highlights
💡 Trading Tips:
Use on liquid markets with consistent volume
Combine with support/resistance levels
Higher timeframes show more significant orders
Adjust sensitivity based on market volatility
⚠️ Important Notes:
Not financial advice - for educational purposes only
Past performance doesn't guarantee future results
Always use proper risk management
Test parameters on your specific markets
Perfect for swing traders, day traders, and anyone looking to spot whale activity in their favorite markets!

Yelober - Market Internal direction+ Key levelsYelober – Market Internals + Key Levels is a focused intraday trading tool that helps you spot high-probability price direction by anchoring decisions to structure that matters: yesterday’s RTH High/Low, today’s pre-market High/Low, and a fast Value Area/POC from the prior session. Paired with a compact market internals dashboard (NYSE/NASDAQ UVOL vs. DVOL ratios, VOLD slopes, TICK/TICKQ momentum, and optional VIX trend), it gives you a real-time read on breadth so you can choose which direction to trade, when to enter (breaks, retests, or fades at PMH/PML/VAH/VAL/POC), and how to plan exits as internals confirm or deteriorate. On top of these intraday decision benefits, it also allows traders—in a very subtle but powerful way—to keep an eye on the VIX and immediately recognize significant spikes or sharp decreases that should be factored in before entering a trade, or used as a quick signal to modify an existing position. In short: clear levels for the chart, live internals for the context, and a smarter, rules-based path to execution.
# Yelober – Market Internals + Key Levels
*A TradingView indicator for session key levels + real‑time market internals (NYSE/NASDAQ TICK, UVOL/DVOL/VOLD, and VIX).*
**Script name in Pine:** `Yelober - Market Internal direction+ Key levels` (Pine v6)
---
## 1) What this indicator does
**Purpose:** Help intraday traders quickly find high‑probability reaction zones and read market internals momentum without switching charts. It overlays yesterday/today’s **automatic price levels** on your active chart and shows a **market breadth table** that summarizes NYSE/NASDAQ buying pressure and TICK direction, with an optional VIX trend read.
### Key features at a glance
* **Automatic Price Levels (overlay on chart)**
* Yesterday’s High/Low of Day (**yHoD**, **yLoD**)
* Extended Hours High/Low (**yEHH**, **yEHL**) across yesterday AH + today pre‑market
* Today’s Pre‑Market High/Low (**PMH**, **PML**)
* Yesterday’s **Value Area High/Low** (**VAH/VAL**) and **Point of Control (POC)** computed from a volume profile of yesterday’s **regular session**
* Smart de‑duplication:
* Shows **only the higher** of (yEHH vs PMH) and **only the lower** of (yEHL vs PML) to avoid redundant bands
* **Market Breadth Table (on‑chart table)**
* **NYSE ratio** = UVOL/DVOL (signed) with **VOLD slope** from session open
* **NASDAQ ratio** = UVOLQ/DVOLQ (signed) with **VOLDQ slope** from session open
* **TICK** and **TICKQ**: live cumulative ratio and short‑term slope
* **VIX** (optional): current value + slope over a configurable lookback/timeframe
* Color‑coded trends with sensible thresholds and optional normalization
---
## 2) How to use it (trader workflow)
1. **Mark your reaction zones**
* Watch **yHoD/yLoD**, **PMH/PML**, and **VAH/VAL/POC** for first touches, break/retest, and failure tests.
* Expect increased responsiveness when multiple levels cluster (e.g., PMH ≈ VAH ≈ daily pivot).
2. **Read the breadth panel for context**
* **NYSE/NASDAQ ratio** (>1 = more up‑volume than down‑volume; <−1 = down‑dominant). Strong green across both favors long setups; red favors short setups.
* **VOLD slopes** (NYSE & NASDAQ): positive and accelerating → broadening participation; negative → persistent pressure.
* **TICK/TICKQ**: cumulative ratio and **slope arrows** (↗ / ↘ / →). Use the slope to gauge **near‑term thrust or fade**.
* **VIX slope**: rising VIX (red) often coincides with risk‑off; falling VIX (green) with risk‑on.
3. **Confluence = higher confidence**
* Example: Price reclaims **PMH** while **NYSE/NASDAQ ratios** print green and **TICK slopes** point ↗ — consider break‑and‑go; if VIX slope is ↘, that adds risk‑on confidence.
* Example: Price rejects **VAH** while **VOLD slopes** roll negative and VIX ↗ — consider fade/reversal.
4. **Risk management**
* Place stops just beyond key levels tested; if breadth flips, tighten or exit.
> **Timeframes:** Works best on 1–15m charts for intraday. Value Area is computed from **yesterday’s RTH**; choose a smaller calculation timeframe (e.g., 5–15m) for stable profiles.
---
## 3) Inputs & settings (what each option controls)
### Global Style
* **Enable all automatic price levels**: master toggle for yHoD/yLoD, yEHH/yEHL, PMH/PML, VAH/VAL/POC.
* **Line style/width**: applies to all drawn levels.
* **Label size/style** and **label color linking**: use the same color as the line or override with a global label color.
* **Maximum bars lookback**: how far the script scans to build yesterday metrics (performance‑sensitive).
### Value Area / Volume Profile
* **Enable Value Area calculations** *(on by default)*: computes yesterday’s **POC**, **VAH**, **VAL** from a simplified intraday volume profile built from yesterday’s **regular session bars**.
* **Max Volume Profile Points** *(default 50)*: lower values = faster; higher = more precise.
* **Value Area Calculation Timeframe** *(default 15)*: the security timeframe used when collecting yesterday’s highs/lows/volumes.
### Individual Level Toggles & Colors
* **yHoD / yLoD** (yesterday high/low)
* **yEHH / yEHL** (yesterday AH + today pre‑market extremes)
* **PMH / PML** (today pre‑market extremes)
* **VAH / VAL / POC** (yesterday RTH value area + point of control)
### Market Breadth Panel
* **Show NYSE / NASDAQ / VIX**: choose which series to display in the table.
* **Table Position / Size / Background Color**: UI placement and legibility.
* **Slope Averaging Periods** *(default 5)*: number of recent TICK/TICKQ ratio points used in slope calculation.
* **Candles for Rate** *(default 10)* & **Normalize Rate**: VIX slope calculation as % change between `now` and `n` candles ago; normalize divides by `n`.
* **VIX Timeframe**: optionally compute VIX on a higher TF (e.g., 15, 30, 60) for a smoother regime read.
* **Volume Normalization** (NYSE & NASDAQ): display VOLD slopes scaled to `tens/thousands/millions/10th millions` for readable magnitudes; color thresholds adapt to your choice.
---
## 4) Data sources & definitions
* **UVOL/VOLD (NYSE)** and **UVOLQ/DVOLQ/VOLDQ (NASDAQ)** via `request.security()`
* **Ratio** = `UVOL/DVOL` (signed; negative when down‑volume dominates)
* **VOLD slope** ≈ `(VOLD_now − VOLD_open) / bars_since_open`, then normalized per your setting
* **TICK/TICKQ**: cumulative sum of prints this session with **positives vs negatives ratio**, plus a simple linear regression **slope** of the last `N` ratio values
* **VIX**: value and slope across a user‑selected timeframe and lookback
* **Sessions (EST/EDT)**
* **Regular:** 09:30–16:00
* **Pre‑Market:** 04:00–09:30
* **After Hours:** 16:00–20:00
* **Extended‑hours extremes** combine **yesterday AH** + **today PM**
> **Note:** All session checks are done with TradingView’s `time(…,"America/New_York")` context. If your broker’s RTH differs (e.g., futures), adjust expectations accordingly.
---
## 5) How the algorithms work (plain English)
### A) Key Levels
* **Yesterday’s RTH High/Low**: scans yesterday’s bars within 09:30–16:00 and records the extremes + bar indices.
* **Extended Hours**: scans yesterday AH and today PM to get **yEHH/yEHL**. Script shows **either yEHH or PMH** (whichever is **higher**) and **either yEHL or PML** (whichever is **lower**) to avoid duplicate bands stacked together.
* **Value Area & POC (RTH only)**
* Build a coarse volume profile with `Max Volume Profile Points` buckets across the price range formed by yesterday’s RTH bars.
* Distribute each bar’s volume uniformly across the buckets it spans (fast approximation to keep Pine within execution limits).
* **POC** = bucket with max volume. **VA** expands from POC outward until **70%** of cumulative volume is enclosed → yields **VAH/VAL**.
### B) Market Breadth Table
* **NYSE/NASDAQ Ratio**: signed UVOL/DVOL with basic coloring.
* **VOLD Slopes**: from session open to current, normalized to human‑readable units; colors flip green/red based on thresholds that map to your normalization setting (e.g., ±2M for NYSE, ±3.5×10M for NASDAQ).
* **TICK/TICKQ Slope**: linear regression over the last `N` ratio points → **↗ / → / ↘** with the rounded slope value.
* **VIX Slope**: % change between now and `n` candles ago (optionally divided by `n`). Red when rising beyond threshold; green when falling.
---
## 6) Recommended presets
* **Stocks (liquid, intraday)**
* Value Area **ON**, `Max Volume Points` = **40–60**, **Timeframe** = **5–15**
* Breadth: show **NYSE & NASDAQ & VIX**, `Slope periods` = **5–8**, `Candles for rate` = **10–20**, **Normalize VIX** = **ON**
* **Index futures / very high‑volume symbols**
* If you see Pine timeouts, set `Max Volume Points` = **20–40** or temporarily **disable Value Area**.
* Keep breadth panel **ON** (it’s light). Consider **VIX timeframe = 15/30** for regime clarity.
---
## 7) Tips, edge cases & performance
* **Performance:** The volume profile is capped (`maxBarsToProcess ≤ 500` and bucketed) to keep it responsive. If you experience slowdowns, reduce `Max Volume Points`, `Maximum bars lookback`, or disable Value Area.
* **Redundant lines:** The script **intentionally suppresses** PMH/PML when yEHH/yEHL are more extreme, and vice‑versa.
* **Label visibility:** Use `Label style = none` if you only want clean lines and read values from the right‑end labels.
* **Futures/RTH differences:** Value Area is from **yesterday’s RTH** only; for 24h instruments the RTH period may not reflect overnight structure.
* **Session transitions:** PMH/PML tracking stops as soon as RTH starts; values persist as static levels for the session.
---
## 8) Known limitations
* Uses public TradingView symbols: `UVOL`, `VOLD`, `UVOLQ`, `DVOLQ`, `VOLDQ`, `TICK`, `TICKQ`, `VIX`. If your data plan or region limits any symbol, the corresponding table rows may show `na`.
* The VA/POC approximation assumes uniform distribution of each bar’s volume across its high–low. That’s fast but not a tick‑level profile.
* Works best on US equities with standard NY session; alternative sessions may need code changes.
---
## 9) Troubleshooting
* **“Script is too slow / timed out”** → Lower `Max Volume Points`, lower `Maximum bars lookback`, or toggle **OFF** `Enable Value Area calculations` for that instrument.
* **Missing breadth values** → Ensure the symbols above load on your account; try reloading chart or switching timeframes once.
* **Overlapping labels** → Set `Label style = none` or reduce label size.
---
## 10) Version / license / contribution
* **Version:** Initial public release (Pine v6).
* **Author:** © yelober
* **License:** Free for community use and enhancement. Please keep author credit.
* **Contributing:** Open PRs/ideas: presets, alert conditions, multi‑day VA composites, optional mid‑value (`(VAH+VAL)/2`), session filter for futures, and alertable state machine for breadth regime transitions.
---
## 11) Quick start (TL;DR)
1. Add the indicator and **keep default settings**.
2. Trade **reactions** at yHoD/yLoD/PMH/PML/VAH/VAL/POC.
3. Use the **breadth table**: look for **green ratios + ↗ slopes** (risk‑on) or **red ratios + ↘ slopes** (risk‑off). Check **VIX** slope for confirmation.
4. Manage risk around levels; when breadth flips against you, tighten or exit.
---
### Changelog (public)
* **v1.0:** First community release with automatic RTH levels, VA/POC approximation, breadth dashboard (NYSE/NASDAQ/TICK/TICKQ/VIX) with normalization and adaptive color thresholds.

NYSE Advancing Issues & Volume RatiosOverview
This comprehensive market breadth indicator tracks two essential NYSE ratios that provide deep insights into market sentiment and internal strength:
NYSE Advancing Issues Ratio
NYSE Advancing Volume Ratio
Dual Ratio Analysis
Issues Ratio: Measures the percentage of NYSE stocks advancing vs. total issues
Volume Ratio: Measures the percentage of NYSE volume flowing into advancing stocks
Both ratios displayed as easy-to-read percentages (0-100%)
Customizable Display Options
Toggle each ratio on/off independently
Choose from multiple moving average types (SMA, EMA, WMA)
Adjustable moving average periods
Custom color schemes for better visualization
Reference Levels
50% Line: Market neutral point (gray dashed)
10% Line: Extremely bearish breadth (red dotted)
90% Line: Extremely bullish breadth (green dotted)
Optional background highlighting for extreme readings
Smart Alerts
Cross above/below 50% (neutral) for both ratios
Extreme readings: Above 90% (strong bullish) and below 10% (strong bearish)
Real-time notifications for key market breadth shifts
📈 How to Interpret
Bullish Signals
Above 50%: More stocks/volume advancing than declining
Above 90%: Extremely strong market breadth (rare occurrence)
Divergence: Price making new highs while breadth weakens (potential warning)
Market Timing
Extreme readings (10%/90%) often coincide with market turning points
Breadth thrusts from extreme levels can signal powerful moves
Use with other technical indicators for enhanced timing

Instant Breakout Strategy with RSI & VWAPInstant Breakout Strategy with RSI & VWAP
This TradingView strategy (Pine Script v6) trades breakouts using pivot points, with optional filters for volume, momentum, RSI, and VWAP. It’s optimized for the 1-second timeframe.
Overview
The strategy identifies breakouts when price crosses above resistance (pivot highs) or below support (pivot lows). It can use basic pivot breakouts or add filters for stronger signals. Take-profit and stop-loss levels are set using ATR, and signals are shown on the chart.
Inputs
Left/Right Pivot Bars: Bars to detect pivots (default: 3). Lower values increase sensitivity.
Volume Surge Multiplier: Volume threshold vs. 20-period average (default: 1.5).
Momentum Threshold: Minimum % price change from bar open (default: 1%).
Take-Profit ATR Multiplier: ATR multiplier for take-profit (default: 9.0).
Stop-Loss ATR Multiplier: ATR multiplier for stop-loss (default: 1.0).
Use Filters: Enable/disable volume, momentum, RSI, and VWAP filters (default: off).
How It Works
1. Pivot Detection
Finds pivot highs (resistance) and lows (support) using ta.pivothigh and ta.pivotlow.
Tracks the latest pivot levels.
2. Volume Surge
Compares current volume to a 20-period volume average.
A surge occurs if volume exceeds the average times the multiplier.
3. Momentum
Measures price change from the bar’s open.
Bullish: Price rises >1% from open.
Bearish: Price falls >1% from open.
4. RSI and VWAP
RSI: 3-period RSI. Above 50 is bullish; below 50 is bearish.
VWAP: Price above VWAP is bullish; below is bearish.
5. ATR
14-period ATR sets take-profit (close ± atr * 9.0) and stop-loss (close ± atr * 1.0).
Trading Rules
Breakout Conditions
Bullish Breakout:
Price crosses above the latest pivot high.
With filters: Volume surge, bullish momentum, RSI > 50, price > VWAP.
Without filters: Only the crossover is needed.
Bearish Breakout:
Price crosses below the latest pivot low.
With filters: Volume surge, bearish momentum, RSI < 50, price < VWAP.
Without filters: Only the crossunder is needed.
Entries and Exits
Long: Enter on bullish breakout. Set take-profit and stop-loss. Close any short position.
Short: Enter on bearish breakout. Set take-profit and stop-loss. Close any long position.
Visuals
Signals: Green triangles (bullish) below bars, red triangles (bearish) above bars.
Pivot Levels: Green line (resistance), red line (support).
Indicators: RSI (blue, separate pane), VWAP (purple, on chart).
How to Use
Apply to a 1-second chart in TradingView for best results.
Adjust inputs (e.g., pivot bars, multipliers). Enable filters for stricter signals.
Watch for buy/sell triangles and monitor RSI/VWAP.
Use ATR-based take-profit/stop-loss for risk management.
Notes
Best on 1-second timeframe due to fast RSI and responsiveness.
Disable filters for more signals (less confirmation).
Backtest before live trading to check performance.
This strategy uses pivots, volume, momentum, RSI, and VWAP for clear breakout trades on the 1-second timeframe.

Accumulation Phase DetectorClean Accumulation Phase Indicator — Description
This TradingView indicator visually identifies the Accumulation Phase in price action, based on the Wyckoff methodology and volume-price analysis. The Accumulation Phase is where insiders or "smart money" gradually build positions before a significant price breakout.
Key Features:
Range Detection: The indicator calculates a price range over a configurable period (Range Length). It marks this range on the chart with red horizontal lines representing support and resistance.
Volume Spike Identification: It detects unusually high volume relative to the average volume over the same period (Volume Spike Multiplier). These spikes highlight potential insider buying activity.
Accumulation Phase Highlighting: When price action remains within the detected range and volume spikes occur, the indicator considers the market to be in an accumulation phase. Volume bars during this phase are colored blue for easy visualization.
Campaign Start & End Labels: The indicator places a "Campaign starts" label at the beginning of the accumulation phase and a "Campaign ends - warehouse full" label when the accumulation ends. This mimics the idea that insiders fill their “warehouses” before a breakout.
Breakout Detection: Once accumulation ends, the indicator monitors for a price breakout above the resistance level and places a "Breakout" label at the breakout bar.
How to Use:
Adjust the Range Length and Volume Spike Multiplier inputs to suit the timeframe and instrument you’re analyzing.
Watch for the blue volume bars within the red range lines to identify the accumulation phase.
Use the campaign labels to identify when the phase starts and ends.
Watch for the breakout label as a potential entry signal.

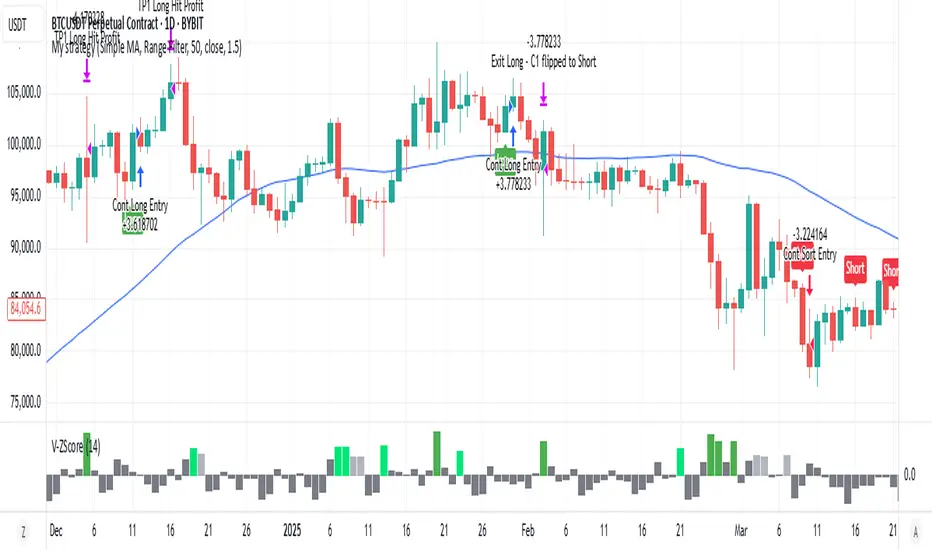
Volume Z-Score [T2][T69]🧠 Overview
This indicator calculates the Z-Score of volume to identify unusual trading activity, particularly those associated with whale-like behavior. It helps traders detect aggressive accumulation, distribution, or breakout setups based on volume anomalies relative to historical norms.
🔍 Features
Z-Score plot of volume using a configurable lookback.
Dynamic bar coloring based on Z-Score magnitude.
🐋 Small Whale marker appears when Z-Score exceeds +3.
Supports manual adjustment of sensitivity through lookback bars input.
🧪 Risk Level & Behavior Reference
🔥 Aggressive (10–14) - Fast signal, high sensitivity to volume spikes. Suitable for scalping or altcoin breakouts.
⚖️ Moderate (20–30) - Balanced filtering of noise vs real movement. Recommended for most swing traders.
🛡️ Conservative (40–60+) - Filters out noise. Reacts only to sustained large volume anomalies. Ideal for longer timeframes or large-cap coins.
⚙️ How to Use (NON DIRECTIONAL INDICATOR)
Use the Z-Score to gauge the strength of volume relative to recent history.
When Z-Score > 1.5 → Considered above-average activity.
When Z-Score > 3 → Marks a 🐋 Small Whale Move, potential for high-volatility follow-through.
Combine with price action, support/resistance, or OBV for confirmation.
⚠️ Limitations
This is a statistical signal, not directional.
Works best when paired with context: supply zones, trend bias, or large candle patterns.
🧠 Advanced Tips
Use multiple risk settings (e.g., 14 vs 50) on stacked indicators to track retail vs whale behavior separately.
Works well with low-float tokens and high-leverage exchange pairs like BTC/USDT (Bybit).
📝 Disclaimer
This script is provided for educational and analytical purposes only. Do your own research and manage your risk responsibly.
Intraday Bullish Scanner - Profit Ping📊 Intraday Bullish Scanner – Profit Ping Only
This custom-built TradingView script identifies high-probability intraday BUY signals on the 15-minute chart, confirmed by volume, momentum, and price action. It uses:
✅ EMA 7/14 crossovers
✅ Bullish candlestick patterns (Engulfing, Piercing, etc.)
✅ Volume spikes above 20-MA
✅ RSI between 55–65
✅ MACD histogram flip from red to green
✅ Cross-confirmation with the 30-minute trend
Once in a trade, it activates a dynamic trailing stop (starting at 2%, tightening to 1% as profit and volume increase). SELL signals are confirmed only with:
❌ MACD turning red
❌ Bearish RSI movement or drop below 50
❌ EMA 7 crossing below EMA 14
❌ A bearish candlestick (Engulfing or Piercing)
❌ Volume spike on a red candle
💰 When all SELL conditions align, a yellow triangle appears. BUYs are marked with a white triangle. Alerts can be connected directly to Python/webhook systems for full automation with IBKR.
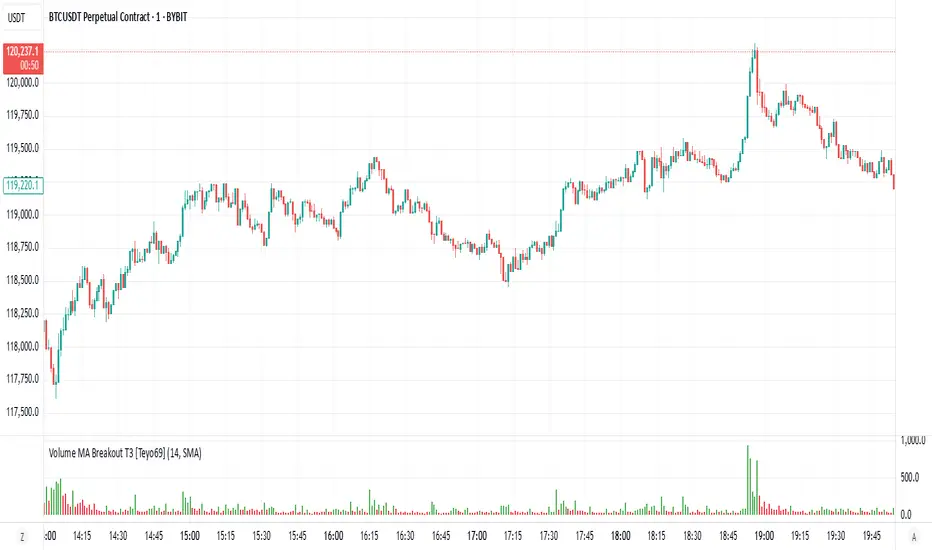
Volume MA Breakout T3 [Teyo69]🧭 Overview
Volume MA Breakout T3 highlights volume bars that exceed a dynamic moving average threshold. It helps traders visually identify volume breakouts—periods of significant buying or selling pressure—based on user-selected MA methods (SMA, EMA, DEMA).
🔍 Features
Volume Highlighting: Green bars indicate volume breakout above the MA; red bars otherwise.
Custom MA Options: Choose between SMA, EMA, or Double EMA for volume smoothing.
Dynamic Threshold: The moving average line adjusts based on user-defined length and method.
⚙️ Configuration
Length: Number of bars used for the moving average calculation (default: 14).
Method: Type of moving average to use:
"SMA" - Simple Moving Average
"EMA" - Exponential Moving Average
"Double EMA" - Double Exponential Moving Average
📈 How to Use
Apply to any chart to visualize volume behavior relative to its MA.
Look for green bars: These suggest volume is breaking out above its recent average—potential signal of momentum.
Red bars indicate normal/subdued volume.
⚠️ Limitations
Does not provide directional bias—use with price action or trend confirmation tools.
Works best with additional context (e.g., support/resistance, candle formations).
🧠 Advanced Tips
Use shorter MAs (e.g., 5–10) in volatile markets for more responsive signals.
Combine with OBV, MFI, or accumulation indicators for confluence.
📌 Notes
This is a volume-based filter, not a signal generator.
Useful for breakout traders and volume profile enthusiasts.
📜 Disclaimer
This script is for educational purposes only. Always test in a simulated environment before live trading. Not financial advice.
High Volume Buyers/Sellers+High Volume Buyers/Sellers+
This indicator helps traders spot bars where unusually high or extreme volume occurs, indicating strong buying or selling pressure.
How it works:
Calculates a volume moving average (SMA) over a user-defined period.
Marks bars where the current volume exceeds:
High Volume Multiplier → small green circle (bullish) or red circle (bearish).
Extreme Volume Multiplier → small green up-triangle (bullish) or red down-triangle (bearish).
Settings:
Volume MA Period → Number of bars used to calculate the average volume.
High Volume Multiplier → Threshold to define high volume.
Extreme Volume Multiplier → Threshold to define extreme volume.
Show Extreme Volume Signals → Option to enable or disable extreme volume markers.
Usage tips:
Apply this indicator on a clean chart to visually highlight momentum bursts or exhaustion points.
It works well for both intraday and swing trading strategies where volume confirmation matters.
⚠ Note: This script only displays on-chart markers and does not plot any lines or indicators.

Volume-Time Imbalance (VTI)Volume-Time Imbalance (VTI) – Indicator Description
This indicator measures the imbalance between traded volume and the time elapsed between bars to identify unusual spikes in volume per second (volume per unit of time). Its purpose is to highlight volume movements that may indicate moments of strong interest, acceleration, or reversal in the market.
How it works:
It calculates the traded volume divided by the time (in seconds) elapsed since the previous bar — thus obtaining the volume per second.
An EMA (exponential moving average) of this volume per second is calculated to smooth the data.
The VTI value is the ratio between the current volume per second and this moving average, showing if the current volume is above what is expected for that pace.
The higher the VTI, the greater the imbalance between volume and time, indicating possible bursts of activity.
Settings:
VTI Moving Average Length: The period of the moving average used to smooth the volume per second (default is 20).
Alert Thresholds: Alert levels to identify moderate and high imbalances (defaults are 1.5 and 2.0).
Show VTI Histogram: Displays the VTI histogram in the indicator window.
Color Background: Colors the indicator background based on the strength of the imbalance (orange for moderate, red for high).
Show Alert Arrows: Shows arrows below the chart when a strong volume spike occurs (high alert).
Interpretation:
VTI values above the moderate level (1.5) indicate an unusual increase in volume relative to time.
Values above the high level (2.0) signal strong spikes that may anticipate significant moves or trend changes.
Use the colors and arrows as visual confirmations to quickly identify these moments.

Volume Pressure Histogram (Normalized)Overview
The Volume Pressure Histogram is designed to help traders analyze buying and selling pressure using real volume data.
Unlike traditional momentum indicators that rely solely on price movements, VPH measures the strength of bullish and bearish volume, providing insights into market participation.
How It Works
The histogram represents the difference between buying and selling volume over a selected period.
Green bars indicate strong buying pressure, while red bars signal strong selling pressure.
Lime and orange bars (if enabled) represent moderate buying and selling activity.
A white signal line smooths volume data to track momentum shifts over time.
How to Use It
Trend Confirmation: When price is rising and green bars increase, the trend is supported by real buying pressure.
Reversal Detection: If price makes a new high but green bars shrink, buyers may be losing strength.
Breakout Strength: A breakout with rising volume pressure confirms strong participation, while weak volume pressure suggests a potential fake move.
Divergence Signals: If price moves higher, but volume pressure declines, the move may lack conviction and could reverse.
Customization Options
Threshold Multiplier (default = 20) controls when green and red bars appear, filtering out weaker signals.
Log Scale Option helps normalize extreme volume spikes.
Adjustable Smoothing Length for both the histogram and signal line.
Why Use This Indicator
Provides a volume-based approach to analyzing market trends.
Can confirm or contradict price movements, helping identify strong or weak trends.
Works across multiple markets, including stocks, forex, crypto, and indices.
This indicator is designed for educational and informational purposes only and does not provide financial advice.

Delta SMA 1-Year High/Low Strategy### Summary:
This Pine Script code implements a trading strategy based on the **Delta SMA (Simple Moving Average)** of buy and sell volumes over a 1-year lookback period. The strategy identifies potential buy and sell signals by analyzing the relationship between the Delta SMA and its historical high/low thresholds. Key features include:
1. **Delta Calculation**:
- The Delta is calculated as the difference between buy volume (when close > open) and sell volume (when close < open).
- A 14-period SMA is applied to the Delta to smooth the data.
2. **1-Year High/Low Thresholds**:
- The strategy calculates the 1-year high and low of the Delta SMA.
- Buy and sell conditions are derived from thresholds set at 70% of the 1-year low and 90% and 50% of the 1-year high, respectively.
3. **Buy Condition**:
- A buy signal is triggered when the Delta SMA crosses above 0 after being below 70% of the 1-year low.
4. **Sell Condition**:
- A sell signal is triggered when the Delta SMA drops below 60% of the 1-year high after crossing above 90% of the 1-year high.
5. **Visualization**:
- The Delta SMA and its thresholds are plotted on the chart for easy monitoring.
- Optional buy/sell signals can be plotted as labels on the chart.
This strategy is designed to capture trends in volume-based momentum over a long-term horizon, making it suitable for swing or position trading.

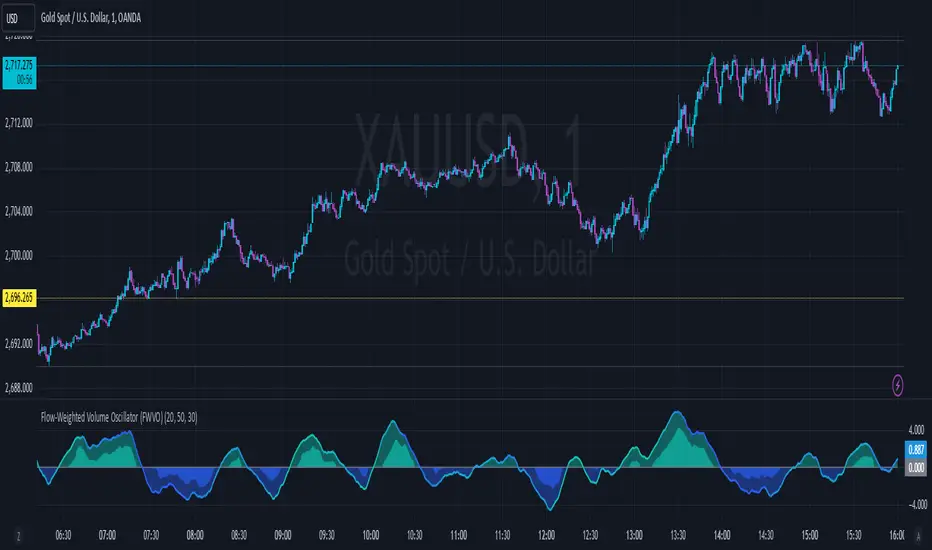
Flow-Weighted Volume Oscillator (FWVO)Volume Dynamics Oscillator (VDO)
Description
The Volume Dynamics Oscillator (VDO) is a powerful and innovative tool designed to analyze volume trends and provide traders with actionable insights into market dynamics. This indicator goes beyond simple volume analysis by incorporating a smoothed oscillator that visualizes the flow and momentum of trading activity, giving traders a clearer understanding of volume behavior over time.
What It Does
The VDO calculates the flow of volume by scaling raw volume data relative to its highest and lowest values over a user-defined period. This scaled volume is then smoothed using an exponential moving average (EMA) to eliminate noise and highlight significant trends. The oscillator dynamically shifts above or below a zero line, providing clear visual cues for bullish or bearish volume pressure.
Key features include:
Smoothed Oscillator: Displays the direction and momentum of volume using gradient colors.
Threshold Markers: Highlights overbought or oversold zones based on upper and lower bounds of the oscillator.
Visual Fill Zones: Uses color-filled areas to emphasize positive and negative volume flow, making it easy to interpret market sentiment.
How It Works
The calculation consists of several steps:
Smoothing with EMA: An EMA of the scaled volume is applied to reduce noise and enhance trends. A separate EMA period can be adjusted by the user (Volume EMA Period).
Dynamic Thresholds: The script determines upper and lower bounds around the smoothed oscillator, derived from its recent highest and lowest values. These thresholds indicate critical zones of volume momentum.
How to Use It
Bullish Signals: When the oscillator is above zero and green, it suggests strong buying pressure. A crossover from negative to positive can signal the start of an uptrend.
Bearish Signals: When the oscillator is below zero and blue, it indicates selling pressure. A crossover from positive to negative signals potential bearish momentum.
Overbought/Oversold Zones: Use the upper and lower threshold levels as indicators of extreme volume momentum. These can act as early warnings for trend reversals.
Traders can adjust the following inputs to customize the indicator:
High/Low Period: Defines the period for volume scaling.
Volume EMA Period: Adjusts the smoothing factor for the oscillator.
Smooth Factor: Controls the responsiveness of the smoothed oscillator.
Originality and Usefulness
The VDO stands out by combining dynamic volume scaling, EMA smoothing, and gradient-based visualization into a single, cohesive tool. Unlike traditional volume indicators, which often display raw or cumulative data, the VDO emphasizes relative volume strength and flow, making it particularly useful for spotting reversals, confirming trends, and identifying breakout opportunities.
The integration of color-coded fills and thresholds enhances usability, allowing traders to quickly interpret market conditions without requiring deep technical expertise.
Chart Recommendations
To maximize the effectiveness of the VDO, use it on a clean chart without additional indicators. The gradient coloring and filled zones make it self-explanatory, but traders can overlay basic trendlines or support/resistance levels for additional context.
For advanced users, the VDO can be paired with price action strategies, candlestick patterns, or other trend-following indicators to improve accuracy and timing.
MERCURY-PRO by DrAbhiramSivprasd“MERCURYPRO”
The MERCURYPRO indicator is a custom technical analysis tool designed to provide dynamic trend signals based on a combination of the Chande Momentum Oscillator (CMO) and Standard Deviation (StDev). This indicator helps traders identify trend reversals or continuation based on the behavior of the price and momentum.
Key Features:
• Source Input: The indicator works with any price data, with the default set to close, which represents the closing price of each bar.
• Length Input: A period (default value 9) is used to determine the calculation window for the Chande Momentum Oscillator and Standard Deviation.
• Fixed CMO Length Option: Users can choose whether to use a fixed CMO length of 9 or adjust the length to the user-defined pds value.
• Calculation Method: The indicator allows switching between using the Chande Momentum Oscillator (CMO) or Standard Deviation (StDev) for the momentum calculation.
• Alpha: The smoothing factor used in the calculation of the MERCURYPRO value, which is based on the length of the period input (pds).
Core Calculation:
1. Momentum Calculation: The script calculates the momentum by determining the change in the source price (e.g., close) from one period to the next.
2. Chande Momentum Oscillator (CMO): The positive and negative momentum components are calculated and then summed over the specified period. This value is normalized to a percentage to determine the momentum strength.
3. K Value Calculation: The script selects either the CMO or Standard Deviation (depending on the user setting) to calculate the k value, which represents the dynamic price momentum.
4. MERCURYPRO Line: The final output of the indicator, MERCURYPRO, is computed using a weighted average of the k value and the previous MERCURYPRO value. The line is smoothed using the Alpha parameter.
Plot and Signal Generation:
• Color Coding: The line is color-coded based on the direction of MERCURYPRO:
• Blue: The trend is bullish (MERCURYPRO is rising).
• Maroon: The trend is bearish (MERCURYPRO is falling).
• Default Blue: Neutral or sideways market conditions.
• Plotting: The MERCURYPRO line is plotted with varying colors depending on the trend direction.
Alerts:
• Color Change Alert: The indicator has an alert condition based on when the MERCURYPRO line crosses its previous value. This helps traders stay informed about potential trend reversals or continuation signals.
Use Case:
• Trend Confirmation: Traders can use the MERCURYPRO indicator to identify whether the market is in a strong trend or not.
• Signal for Entries/Exits: The color change and crossovers of the MERCURYPRO line can be used as entry or exit signals, depending on the trader’s strategy.
Overall Purpose:
The MERCURYPRO indicator combines momentum analysis with smoothing techniques to offer a dynamic, responsive tool for identifying market trends and potential reversals. It is particularly useful in conjunction with other technical indicators to provide confirmation for trade setups.
How to Use the MERCURYPRO Indicator:
The MERCURYPRO indicator is designed to help traders identify trend reversals and market conditions. Here are a few ways you can use it:
1. Trend Confirmation (Bullish or Bearish)
• Bullish Trend: When the MERCURYPRO line is colored Blue, it indicates a rising trend, suggesting that the market is bullish.
• Action: You can consider entering long positions when the line turns blue, or holding your existing positions if you’re already long.
• Bearish Trend: When the MERCURYPRO line is colored Maroon, it signals a downward trend, indicating a bearish market.
• Action: You may consider entering short positions or closing any long positions when the line turns maroon.
2. Trend Reversal Alerts
• Color Change: The MERCURYPRO indicator changes color when there’s a trend reversal. The alert condition triggers when the MERCURYPRO crosses above or below its previous value, signaling a potential shift in the trend.
• Action: You can use this alert as a signal to monitor potential entry or exit points for trades. For example, a crossover from maroon to blue could indicate a potential buying opportunity, while a crossover from blue to maroon could suggest a selling opportunity.
3. Use with Other Indicators for Confirmation
• While the MERCURYPRO provides valuable trend insights, it’s often more effective when used in combination with other indicators like RSI (Relative Strength Index), MACD, or moving averages to confirm signals.
• Example: If MERCURYPRO turns blue and RSI is above 50, it may signal a strong bullish trend, enhancing the confidence to enter a long trade.
4. Divergence
• Watch for divergence between the MERCURYPRO line and the price chart:
• Bullish Divergence: If the price makes new lows while MERCURYPRO is showing higher lows, it suggests a potential bullish reversal.
• Bearish Divergence: If the price makes new highs while MERCURYPRO is showing lower highs, it suggests a potential bearish reversal.
Example of Use:
• Example 1: If the MERCURYPRO line changes from maroon to blue, you might enter a long position. After the MERCURYPRO line turns blue, use an alert to monitor the price action. If other indicators (like RSI) also suggest strength, your confidence in the trade will increase.
• Example 2: If the MERCURYPRO line shifts from blue to maroon, it could be a signal to close long positions and consider shorting the market if other conditions align (e.g., moving averages also turn bearish).
Warning for Using the MERCURYPRO Indicator:
1. Lagging Indicator:
• The MERCURYPRO is a lagging indicator, meaning it responds to price changes after they have occurred. This may delay entry and exit signals, and it’s crucial to combine it with other leading indicators to get timely information.
2. False Signals in Range-bound Markets:
• In choppy or sideways markets, the MERCURYPRO line can produce false signals, flipping between blue and maroon frequently without showing a clear trend. It’s important to avoid trading based on these false signals when the market is not trending.
3. Overreliance on One Indicator:
• Relying solely on MERCURYPRO can be risky. Always confirm signals with additional tools like volume analysis, price action, or other indicators to increase the accuracy of your trades.
4. Market Conditions Matter:
• The indicator may work well in trending markets, but in highly volatile or news-driven environments, it may provide misleading signals. Ensure that you take market fundamentals and external news events into consideration before acting on the indicator’s signals.
5. Risk Management:
• As with any technical indicator, MERCURYPRO is not infallible. Always use appropriate risk management techniques such as stop-loss orders to protect your capital. Never risk more than you can afford to lose on a trade.
6. Backtest First:
• Before implementing MERCURYPRO in live trading, make sure to backtest it on historical data. Test the strategy with various market conditions to assess its effectiveness and identify any potential weaknesses.
By considering these guidelines and warnings, you can use the MERCURYPRO indicator more effectively and mitigate potential risks in your trading strategy.

Volume Delta Candles HTF [TradingFinder] LTF Volume Candles 🔵 Introduction
In financial markets, understanding the concepts of supply and demand and their impact on price movements is of paramount importance. Supply and demand, as fundamental pillars of economics, reflect the interaction between buyers and sellers.
When buyers' strength surpasses that of sellers, demand increases, and prices tend to rise. Conversely, when sellers dominate buyers, supply overtakes demand, causing prices to drop. These interactions play a crucial role in determining market trends, price reversal points, and trading decisions.
Volume Delta Candles offer traders a practical way to visualize trading activity within each candlestick. By integrating data from lower timeframes or live market feeds, these candles eliminate the need for standalone volume indicators.
They present the proportions of buying and selling volume as intuitive colored bars, making it easier to interpret market dynamics at a glance. Additionally, they encapsulate critical metrics like peak delta, lowest delta, and net delta, allowing traders to grasp the market's internal order flow with greater precision.
In financial markets, grasping the interplay between supply and demand and its influence on price movements is crucial for successful trading. These fundamental economic forces reflect the ongoing balance between buyers and sellers in the market.
When buyers exert greater strength than sellers, demand dominates, driving prices upward. Conversely, when sellers take control, supply surpasses demand, and prices decline. Understanding these dynamics is essential for identifying market trends, pinpointing reversal points, and making informed trading decisions.
Volume Delta Candles provide an innovative method for evaluating trading activity within individual candlesticks, offering a simplified view without relying on separate volume indicators. By leveraging lower timeframe or real-time data, this tool visualizes the distribution of buying and selling volumes within a candle through color-coded bars.
This visual representation enables traders to quickly assess market sentiment and understand the forces driving price action. Buyer and seller strength is a critical concept that focuses on the ratio of buying to selling volumes. This ratio not only provides insights into the market's current state but also serves as a leading indicator for detecting potential shifts in trends.
Traders often rely on volume analysis to identify significant supply and demand zones, guiding their entry and exit strategies. Delta Candles translate these complex metrics, such as Maximum Delta, Minimum Delta, and Final Delta, into an easy-to-read visual format using Japanese candlestick structures, making them an invaluable resource for analyzing order flows and market momentum.
By merging the principles of supply and demand with comprehensive volume analysis, tools like the indicator introduced here offer unparalleled clarity into market behavior. This indicator calculates the relative strength of supply and demand for each candlestick by analyzing the ratio of buyers to sellers.
🔵 How to Use
The presented indicator is a powerful tool for analyzing supply and demand strength in financial markets. It helps traders identify the strengths and weaknesses of buyers and sellers and utilize this information for better decision-making.
🟣 Analyzing the Highest Volume Trades on Candles
A unique feature of this indicator is the visualization of price levels with the highest trade volume for each candlestick. These levels are marked as black lines on the candles, indicating prices where most trades occurred. This information is invaluable for identifying key supply and demand zones, which often act as support or resistance levels.
🟣 Trend Confirmation
The indicator enables traders to confirm bullish or bearish trends by observing changes in buyer and seller strength. When buyer strength increases and demand surpasses supply, the likelihood of a bullish trend continuation grows. Conversely, decreasing buyer strength and increasing seller strength may signal a potential bearish trend reversal.
🟣 Adjusting Timeframes and Calculation Methods
Users can customize the indicator's candlestick timeframe to align with their trading strategy. Additionally, they can switch between moving average and current candle modes to achieve more precise market analysis.
This indicator, with its accurate and visual data display, is a practical and reliable tool for market analysts and traders. Using it can help traders make better decisions and identify optimal entry and exit points.
🔵 Settings
Lower Time Frame Volume : This setting determines which timeframe the indicator should use to identify the price levels with the highest trade volume. These levels, displayed as black lines on the candlesticks, indicate prices where the most trades occurred.
It is recommended that users align this timeframe with their primary chart’s timeframe.
As a general rule :
If the main chart’s timeframe is low (e.g., 1-minute or 5-minute), it is better to keep this setting at a similarly low timeframe.
As the main chart’s timeframe increases (e.g., daily or weekly), it is advisable to set this parameter to a higher timeframe for more aligned data analysis.
Cumulative Mode :
Current Candle : Strength is calculated only for the current candlestick.
EMA (Exponential Moving Average) : The strength is calculated using an exponential moving average, suitable for identifying longer-term trends.
Calculation Period : The default period for the exponential moving average (EMA) is set to 21. Users can modify this value for more precise analysis based on their specific requirements.
Ultra Data : This option enables users to view more detailed data from various market sources, such as Forex, Crypto, or Stocks. When activated, the indicator aggregates and displays volume data from multiple sources.
🟣 Table Settings
Show Info Table : This option determines whether the information table is displayed on the chart. When enabled, the table appears in a corner of the chart and provides details about the strength of buyers and sellers.
Table Size : Users can adjust the size of the text within the table to improve readability.
Table Position : This setting defines the table’s placement on the chart.
🔵 Conclusion
The indicator introduced in this article is designed as an advanced tool for analyzing supply and demand dynamics in financial markets. By leveraging buyer and seller strength ratios and visually highlighting price levels with the highest trade volume, it aids traders in identifying key market zones.
Key features, such as adjustable analysis timeframes, customizable calculation methods, and precise volume data display, allow users to tailor their analyses to market conditions.
This indicator is invaluable for analyzing support and resistance levels derived from trade volumes, enabling traders to make more accurate decisions about entering or exiting trades.
By utilizing real market data and displaying the highest trade volume lines directly on the chart, it provides a precise perspective on market behavior. These features make it suitable for both novice and professional traders aiming to enhance their analysis and trading strategies.
With this indicator, traders can gain a better understanding of supply and demand dynamics and operate more intelligently in financial markets. By combining volume data with visual analysis, this tool provides a solid foundation for effective decision-making and improved trading performance. Choosing this indicator is a significant step toward refining analysis and achieving success in complex financial markets.

Cryptocurrency SentimentOverview
This script focuses on calculating and visualizing the sentiment difference between LONG positions and SHORT positions for a selected cryptocurrency pair on the Bitfinex exchange. It provides a clean and clear visual representation of the sentiment, helping traders analyze market behavior.
Key Features
Dynamic Symbol Selection:
The script automatically detects the cryptocurrency symbol from the chart (syminfo.basecurrency) and dynamically constructs the LONGS and SHORTS ticker symbols.
Works seamlessly for pairs like BTCUSD, ETHUSD, and others available on Bitfinex.
Sentiment Calculation:
The sentiment difference is calculated as:
Sentiment Difference=−1×(100− SHORTS/LONGS ×100)
LONGS : The total number of long positions.
SHORTS : The total number of short positions.
If SHORTS is 0, the value is safely skipped to avoid division errors.
Color Coding:
The script visually highlights the sentiment difference:
Green Line: Indicates that LONG positions are dominant (bullish sentiment).
Red Line: Indicates that SHORT positions are dominant (bearish sentiment).
Zero Reference Line:
A gray horizontal line at 0 helps users quickly identify the transition between bullish (above zero) and bearish (below zero) sentiment.
How It Works
Fetching Data:
The script uses request.security to fetch LONGS and SHORTS data at the current chart timeframe (timeframe.period) for the dynamically generated Bitfinex tickers.
Handling Data:
Missing or invalid data (NaN) is filtered out to prevent errors.
Extreme spikes or irregular values are safely avoided.
Visualization:
The sentiment difference is plotted with dynamic color coding:
Green when LONGS > SHORTS (bullish sentiment).
Red when SHORTS > LONGS (bearish sentiment).
Benefits
Market Sentiment Insight: Helps traders quickly identify if the market is leaning towards bullish or bearish sentiment based on actual LONG and SHORT position data.
Dynamic and Adaptive: Automatically adjusts to the selected cryptocurrency symbol on the chart.
Clean Visualization: Focuses solely on sentiment difference with color-coded signals, making it easy to interpret.
Best Use Cases
Trend Confirmation: Use the sentiment difference to confirm trends during bullish or bearish moves.
Market Reversals: Identify potential reversals when sentiment shifts from positive (green) to negative (red) or vice versa.
Sentiment Monitoring: Monitor the overall market bias for cryptocurrencies like BTC, ETH, XRP, etc., in real-time.
Sample Chart Output
Above Zero → Green Line: Bullish sentiment dominates.
Below Zero → Red Line: Bearish sentiment dominates.
Zero Line → Transition point for shifts in sentiment.

Trend & Volume Dynamics Indicator (Color identifying the Trend)Benefits
1. Trend Identification:
o The script calculates a 20-period Weighted Moving Average (WMA) of the closing prices. This helps in smoothing out price data to identify the underlying trend.
o The color of the WMA line changes based on the price position relative to the WMA:
Green: When the current price is above the WMA, indicating a potential uptrend.
Red: When the current price is below the WMA, indicating a potential downtrend.
Blue: When the price is exactly at the WMA, indicating no clear trend.
2. Volume Dynamics:
o The script also plots the volume with a color-coding mechanism:
Green: When the current volume is higher than the previous period's volume, indicating increasing trading activity.
Red: When the current volume is lower than the previous period's volume, indicating decreasing trading activity.
o The volume bars are plotted with 90% transparency, making them less visually dominant but still informative.
Usage
• Overlay: The indicator is set to overlay=true, meaning it will be plotted directly on the price chart, allowing users to see the WMA and volume dynamics in the context of the price movements.
• WMA Length: The length of the WMA is set to 20 periods, which is a common setting for short to medium-term trend analysis.
• Visual Cues: The color changes in both the WMA and volume bars provide immediate visual cues about the trend and volume dynamics, helping traders make quicker decisions.
Detailed Explanation of the Script
1. Indicator Declaration:
o Declares the indicator with a descriptive name and specifies that it should be overlaid on the price chart.
2. WMA Calculation:
o Defines the length of the WMA and calculates it using the closing prices.
3. Plotting the WMA:
o Plots the WMA with full brightness (0 transparency).
4. Color-Coding the WMA:
o Changes the color of the WMA line based on the price's position relative to the WMA.
5. Volume Indicator:
o Plots the volume bars with color-coding based on the volume change from the previous period and with 90% transparency.
Conclusion
One of the most best combinations of Volume and Moving average and works on any given timeframe and charts
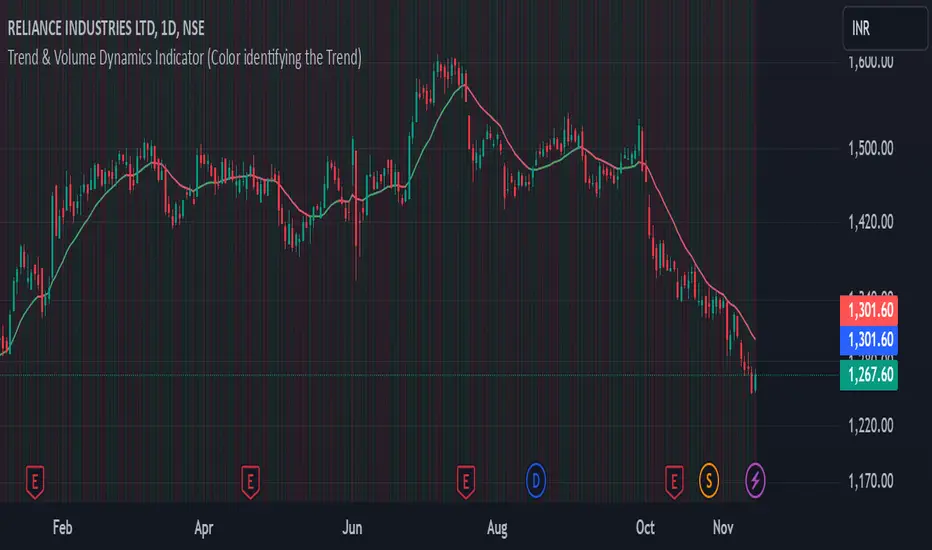
Jackson Volume breaker Indication# Jackson Volume Breaker Beta
### Advanced Volume Analysis Indicator
## Description
The Jackson Volume Breaker Beta is a sophisticated volume analysis tool that helps traders identify buying and selling pressure by analyzing price action and volume distribution. This indicator separates and visualizes buying and selling volume based on where the price closes within each candle's range, providing clear insights into market participation and potential trend strength.
## Key Features
1. **Smart Volume Distribution**
- Automatically separates buying and selling volume
- Color-coded volume bars (Green for buying, Red for selling)
- Winning volume always displayed on top for quick visual reference
2. **Real-time Volume Analysis**
- Shows current candle's buy/sell ratio
- Displays total volume with smart number formatting (K, M, B)
- Percentage-based volume distribution
3. **Technical Overlays**
- 20-period Volume Moving Average
- Dynamic scaling relative to price action
- Clean, uncluttered visual design
## How to Use
### Installation
1. Add the indicator to your chart
2. Adjust the Volume Scale input based on your preference (default: 0.08)
3. Toggle the Moving Average display if desired
### Reading the Indicator
#### Volume Bars
- **Green Bars**: Represent buying volume
- **Red Bars**: Represent selling volume
- **Stacking**: The larger volume (winning side) is always displayed on top
- **Height**: Relative to the actual volume, scaled for chart visibility
#### Information Table
The top-right table shows three key pieces of information:
1. **Left Percentage**: Winning side's volume percentage
2. **Middle Percentage**: Losing side's volume percentage
3. **Right Number**: Total volume (abbreviated)
### Trading Applications
1. **Trend Confirmation**
- Strong buying volume in uptrends confirms bullish pressure
- High selling volume in downtrends confirms bearish pressure
- Volume divergence from price can signal potential reversals
2. **Support/Resistance Breaks**
- High volume on breakouts suggests stronger moves
- Low volume on breaks might indicate false breakouts
- Monitor volume distribution for break direction confirmation
3. **Reversal Identification**
- Volume shift from selling to buying can signal potential bottoms
- Shift from buying to selling can indicate potential tops
- Use with price action for better entry/exit points
## Input Parameters
1. **Volume Scale (0.01 to 1.0)**
- Controls the height of volume bars
- Default: 0.08
- Adjust based on your chart size and preference
2. **Show MA (True/False)**
- Toggles 20-period volume moving average
- Useful for identifying volume trends
- Default: True
3. **MA Length (1+)**
- Changes the moving average period
- Default: 20
- Higher values for longer-term volume trends
## Best Practices
1. **Multiple Timeframe Analysis**
- Compare volume patterns across different timeframes
- Look for volume convergence/divergence
- Use higher timeframes for major trend confirmation
2. **Combine with Other Indicators**
- Price action patterns
- Support/resistance levels
- Momentum indicators
- Trend indicators
3. **Volume Pattern Recognition**
- Monitor for unusual volume spikes
- Watch for volume climax patterns
- Identify volume dry-ups
## Tips for Optimization
1. Adjust the Volume Scale based on your chart size
2. Use smaller timeframes for detailed volume analysis
3. Compare current volume bars to historical patterns
4. Watch for volume/price divergences
5. Monitor volume distribution changes near key price levels
## Note
This indicator works best when combined with proper price action analysis and risk management strategies. It should not be used as a standalone trading system but rather as part of a comprehensive trading approach.
## Version History
- Beta Release: Initial public version
- Features buy/sell volume separation, moving average, and real-time analysis
- Optimized for both intraday and swing trading timeframes
## Credits
Developed by Jackson based on other script creators
Special thanks to the trading community for feedback and suggestions

Dynamic Volume-Based Buy/Sell IndicatorThis script provides a powerful volume-based indicator that visualizes buy and sell volumes, issues alerts for volume spikes, and adjusts color intensity dynamically based on volume size. It includes customizable settings for volume averaging and thresholds, making it adaptable to various trading strategies.