RSI-ATR Divine Strategy (Backtesting)Live, non-repainting strategy using ATR and RSI mixed together to multiple types of long and short positions.
- Features -
Live entry direction with trade warnings and alerts
Live trade building buy and sell stops (for buy/sell stop limits)
Entry location icons as well as pyramid entries (to add to existing position)
2 separate targets based on the ATR setting and entry location
1 scalp target based on the ATR setting and entry location
2 separate trailing stops, 1 for "absolute stop" and 1 for "scalp trades"
Alert conditions for every update and condition change of the strategy (Provided by indicator study )
4 pre-built color themes, including candlestick coloring
This strategy is best used with my RSI Shaded Indicator using the identical RSI settings.
The linked script is identical and used solely for alerts, because Trading View still after 3 years of requesting does not provide the ability to use alert conditions inside a strategy script, only an indicator script. This strategy should be used to backtest your settings.
The approach to this strategy uses several parallel trades of different types. In order to generate multiple trade types the "pyramid trades" setting of the strategy (second tab of the settings that lets you adjust the number of pyramid contracts) should be used.
- Trade Types -
Swing: This trade is entered on the solid arrows after the RSI has become oversold or overbought. It is key that all trades wait for some degree of pullback before entering, even after the trend flips between positive and negative. This trade is held until stopped out or an opposite trade is triggered that reverses the position.
Target: These trades are entered at both the initial swing trade, or any subsequent pyramid/greedy trades that present themselves along the way while the trend remains in the same direction. The difference between these trades and the swing trade is that they have targets calculated as: Target = +/- * ATR. Until the target price is reached it does not change. When exceeded the next target trade will have a new target price.
Scalp: These trades have a limit buy/sell entry and a target. The target is very similar to the ATR Multiplier calculation for Target trades, but uses the instead.
Turning on/off the different trade types (strategy only) is simple done by decreasing the number of contracts used for that trade type to zero. When the quantity is set to zero, that trade is not considered.
- Session -
The session filter is used to narrow trade executions by only allowing trades that are inside the session boundaries. This can be used to isolate the London or New York session for example. The default is 24 x 7 which filters no trades (Trading View has a bug when resetting this, so simply reset the indicator to get it back to 24x7).
All feature requests or bug reports are welcome either by direct messaging or comments on this page or the linked indicator page.
Please PM for access. Cheers.
真实波动幅度均值(ATR)

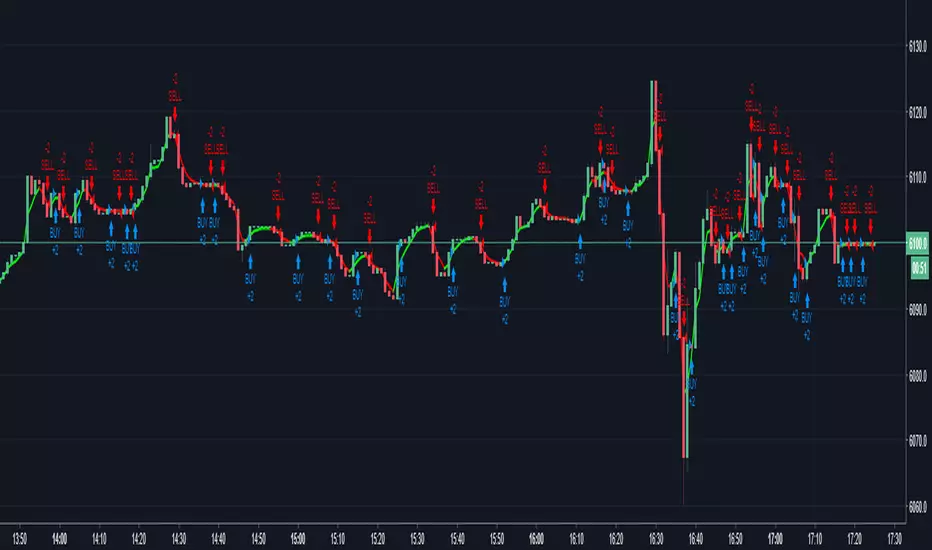
Simple Buy and Sell SignalsUpdated from version 10.4 to version 12
Feel free to use this. I made this for my own strategy and to make my life easier spotting entries. I'm still currently learning pine script so it's not perfect. Currently the exits are based on trend reversal (not recommended) so I suggest you pick your own exits and bank those pips.
Criteria; (Tested on these Settings)
NZDJPY
5 Min Timeframe

SHEAVY S StrategyThe new version is completely revamped where you no longer need to follow a said system the system is now scripted into SHEAVY XV
the strategy using all the previous variables in order to go long or short .
i removed the RSI Candles as well as a few other things to clear up the screen and settings section so its not overwhelming
Make sure you adjust your trailing stop accordingly using my Hidden ATR script i will have open access too, just follow the math displayed in the left hand corner to get appropriate stop placement
If you cannot link your broker then this is how you will use SHEAVY XV
after you get a BEAR TREND or BULL TREND signal you only want to SHORT or LONG
the signals are displayed at the top for your entries going SHORT and LONG
and the conditional closes will be displayed at the bottom in the respected colors
alerts are set so you are able to appropriate send to your mobile device or email
to find out how to attain access to this script please visit the website below
www.cryptocurrentlyvip.com
MAKE SURE TO PRACTICE APPROPRIATE RISK AND MONEY MANAGEMENT
DISCLAIMER
***THIS SCRIPT WAS INTENDED FOR EXPERIMENTAL PURPOSES ONLY***
AND THE CREATOR OF THIS STRATEGY HELD WITHIN THE SCRIPT WILL NOT BE RESPONSIBLE FOR ANY LOSSES OR WINS ACCRUED.

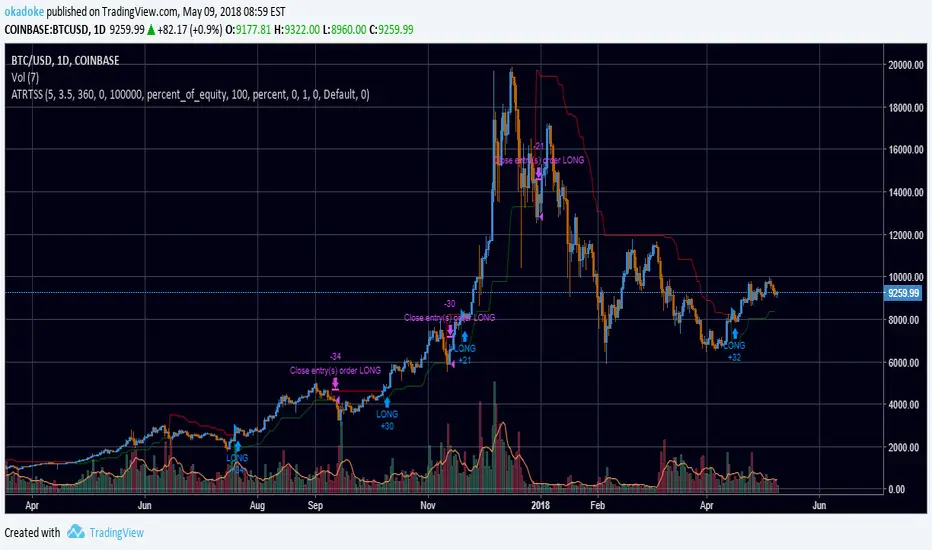
ATR (Back Testing Script) by CanadianCryptoChrisHey Everyone,
Many people been watching my youtube and saw my ATR script and the one I was using before. I have created and broke off a chunk of my script, the ATR and backtesting abilities in this one for all those that want to be able to backtest their ATR strategies. Remember to fine tune your ATR to your timeframe and trading pair. For more information on this script, please check out my youtube:
How the ATR works:
youtu.be
How to tune the ATR:
youtu.be
And how to properly use this script:
Coming Shortly after I release this :)
Please check my youtube channel for this video on how to use this with backtesting capabilities. I will post a link after I make the video!
www.youtube.com
I will be releasing the Alerting Script shortly! As well as my backtesting and alerting scripts for my Guppy as well, each individually!
Thanks,
Chris

RENKO strategyStandard simple strategy RENKO. Entry on the first reversing bar. No repaints. Caution arrows when price crossing RENKO levels

RSI + BB Scalping StrategyThis strategy uses the RSI indicator and the Bollinger Bands to identify trade entries while using the ATR to determine stop-losses. The strategy only triggers when both the RSI and Bollinger Band indicators are both either overbought or oversold.
This indicator is free to use. Trade at your own risk.

Daily Volatility Arbitrage between BTC and ETHDaily Volatility Arbitrage between BTC and ETH
Tips are appreciated!
BTC: 3FzN8HipN4iXHUWgc5hkithbTQKfjjYHRW
ETH: 0x4B345f58D07Ae9608BBA3184B7FF16Ac07120e35

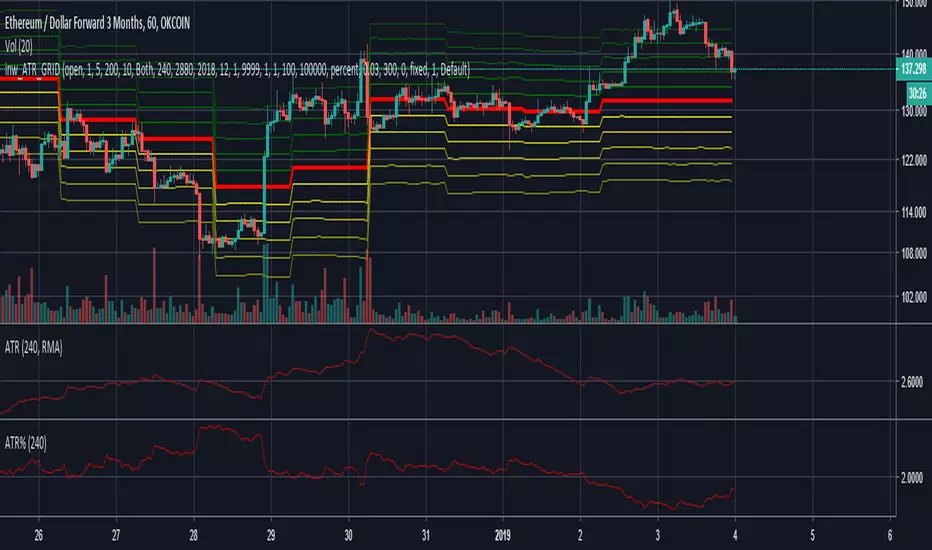
inwCoin ATR Grid Strategy ( incomplete )Due to Pine Script limitation that we cannot open both short and long order at the same time. So this GRID idea cannot backtest yet.
This strategy is for using with CTC Okex Bot grid system only.
The idea is to check how wide the grid with ATR so you can setup each grid size in CTC Bot every day ( or cut loss some grid accordingly )
BTC Swinger v1Daily interval swing trading algorithm based on momentum techniques using ATR Stops. Made by Kory Hoang from Stably.
Shout out to the Advanced Crypto Asset Trading crew! ;)

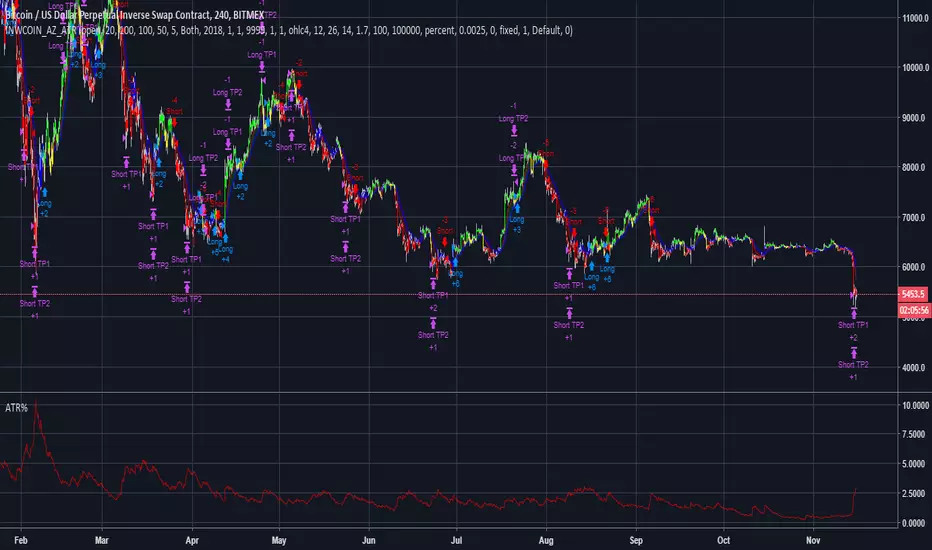
inwCoin's CDC ActionZone V.2 Strategy + FixedTP% + ATR%This indicator is upgrade version of my first CDC Action Zone v2 strategy.
- I added Take profit target #1 and #2 in setting instead of trailing start/stop ( because that one need bot to track trailing for max performance )
- I also added ATR% so we'll do nothing if market don't have any volatility ( like BTCUSD in 9-10/2018 ), we'll start entry short/long again if the volatility come
The result is incredibly good!
This backtest result is optimized for Bitmex ( XBTUSD ) only. If you need to backtest with another coin, please try it yourself :)
Exchange : Bitmex
Coin : XBTUSD ( perpetual )
Timeframe : 4H
Date range : 2018/1 - 2018/11
For : Trade by hand, just enter when signal show up and then set TP and stop then leave it be.
Config
Trade % = 20 ( You can increase trade size of your total port but it will get you into more risky trade. ( but yes, more profit ) ... u can increase trade size if you have enough profit
TP1&2 = 100 both ( I tried many value and found out both 100 give best result )
Stop % = 50 ( so this trade is RR = 2 nice! )
Leverage = 5 ( so we can withstand the price fluctuation and not get liquidated, if you trade spot, please choose 1 also, please adjust TP and stop accordingly eg. leverage 1 / TP = 20 / SL = 10 )
Trade Direction = Both ( for margin market, if you want to trade spot like Binance you can choose long only )
ATR period = 14 ( how many candle you want to calulate ATR )
ATR Percent = 1.7 ( You can adjust this value for any coin of your choice, this strategy will enter trade if current ATR% > ATR in config to avoid total sideway market )
Above is the critical parameter for trading by hand. You can have fun and working around with it :D
I hope you can make some money from this strategy. Yes, it take time and patience to wait for the right moment before enter any position, and it worth the wait !
HMA + ATR CLOUD SYSTEMPlaying around with some ideas. Hull MA's have good entries and exits on their own, but together with ATR I find them to be even more solid. Only tested with crypto. Best results on daily timeframe and long only.
Stop loss, trailing and pyramiding code is functional. There is also a long only / short only option in the bottom of the settings.
Let me know what you think

Strategy - Bobo's Pivot ATR SwingHi there, welcome to my pivot ATR swing bot. I put this out there with source code hidden to see what ideas others have to use it. Also if there are any coders of trading systems out there who wanted to work with me to put this into a form that could trade automatically we could both use... I'd welcome that kind of collaboration and will happily share the underlying rules of this and the more highly developed version that isn't public.
But as it is, the signals are free for all, use them as you wish and at your own risk. If you want to discuss the code, strategy or ideas, I'm around fairly regularly just message.
The bot is fairly simple design that will give you signals for long and short intraday/week on equity futures / CFDs / ETFs. You'll see it backtests fairly well on an hourly SPX500 chart as configured. You will need to set up certain parameters to account for any different timeframes and markets you wish to trade. For me it's most effective pick out a few good swing trades per week in equity futures. However part of the idea of putting this in the public domain is to see if other people will have good but different ideas how to use it. Please share with me if so :).
The basic concept is a series of 3 lines that define the area and movement we wish to trade. The daily pivot is the central line (blue). We are looking to capture reversions to this middle line from extremes (red and green). Therefore the bot will signal exit at the close of every candle that has passed through the pivot.
Entry is decided by the outer bands around the blue line. Red is the top band, green the bottom. As configured, these are simply placed a daily ATR value apart, centred around the pivot. You can change this quite a lot though, so let's go through the settings:
Pivot Timeframe - simple, a daily pivot is calculated from the previous day's values (high + low + close)/3 . BUt the same calculation can be applied to any length candle, day, minute, month or whatever. This makes the middle target line more or less responsive to recent price action.
ATR Band Timeframe - When we calculate the average range, we need to know what candle length makes up our series. Daily candles is the default, but you can change that here.
ATR Lookback - When we calculate the average range, we need to know how many instances of the timeframe (day, minute, hour etc) we look back to create an average. The lower the lookback value, the more the width of the bands (the distance from pivot) will change quickly based on the volatility of previous candles. The higher the lookback value, the more stable the band width will be to recent volatility.
ATR divisor - The ATR value above is divided by this value, before being added or subtracted to the pivot to create the red and green lines. Default value is 2, and this means the distance from the red band to the green band will be equal to 1 ATR, as calculated according to the parameters above. Setting this to 1 would mean that each band is one ATR away from pivot (ie the bands got wider apart). Set this to 4, and it means that it is only 1/2 an ATR from green to red.
Take Profit / Stop Loss. - We know what a stop and profit target are, but worth nothing that a 0 value disables stop loss or profit targets. The bot will still close positions when crossing pivot.
Also, note the mintick value of the instrument you apply this to. For example for the CFD chart SPX500 the mintick value is 0.1. So a 100 value for stop loss = 10 points on SPX500. but if you were to trade the same thing basically, but the emini future ES, the mintick value is 0.25. So for a 10 point stop on the ES chart, you would need a value of 40 in this bot. US30 and YM have convenient mintick values of 1. Currencies can be a bit of a nightmare :).


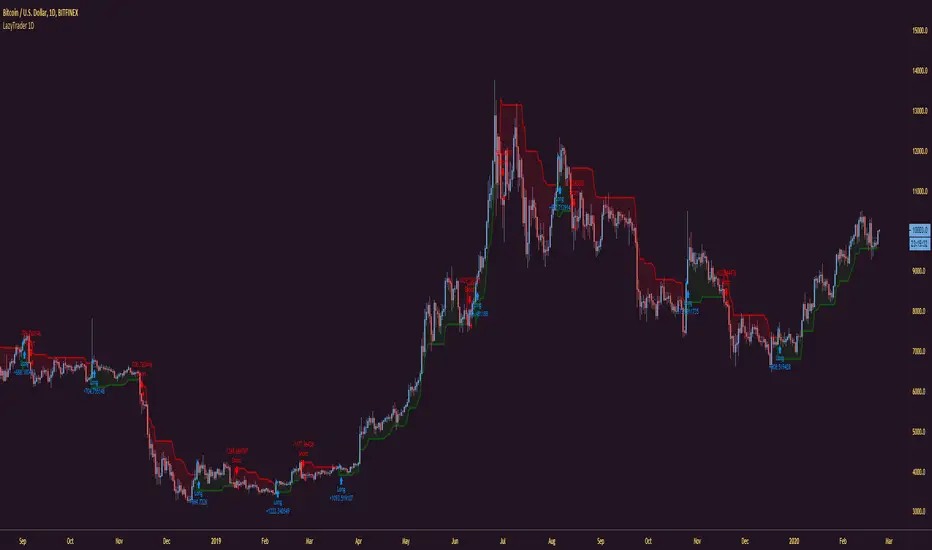
LazyTrader - BacktestingAs requested, here is a quick and basic strategy version of Lazy Trader for those who wish to play around with backtesting.
I normally only use Lazy Trader with BTC on the daily chart but because I'm getting lots of people message me asking if it can be used on lower time frames and with other pairs, I've got the demo chart / screenshot showing an example of just that. Not as good in my opinion, but yes it does work with any time frame and pair.
You can find the original as well as all of our other scripts on our profile page here : www.tradingview.com
TrapTradingBuy on dips and sell into rallies. Simple as that.
- Short line (green)
- Base line (white)
- Long line (red)
When the market price touches the white or the red(green) lines, buy(sell) orders are generated.
The exit points are 2 lines above(below) the entries.
Parameters
- Period: It affects the value of Base line and the spacing of each line.
- Multiple: Specify the spacing between each line.


andrei_SHAB strategySupertrend strategy with Atr modified to the Bollinger Bands and base on the Heikin Ashi candles ... It is not repaint
ATR Trailing Stops StrategyUpdate of Average True Range Trailing Stops Strategy by HPotter to include backtesting support
Opens longs when price crosses over trailing stop line, closes when price crosses below
Option to open/close shorts when longs are closed/opened
Option to specify a time range to test over. For example, set Max Days Back to 360 and Min Days Back to 180 to test from 1 year ago to 6 months ago. To test the entire range of data, set both to 0.
Keltner Channel StrategyBuy = Squeeze Momenum Strategy (using Bollinger Bands and Keltner Channel) OR Keltner Channel buy indicators
Sell = Keltner Channel sell indicator

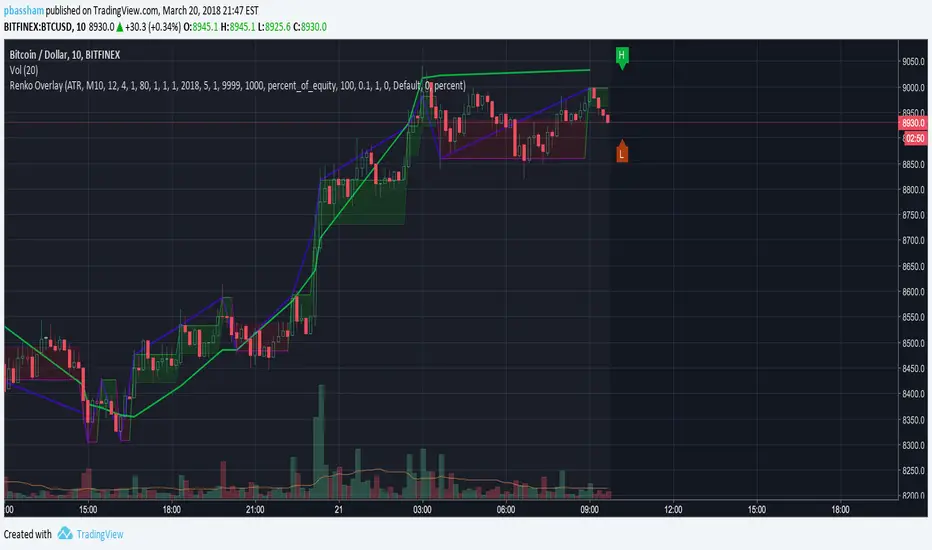
Renko Strategy Overlay for moving averages back testingThis puts a Renko overlay on the main chart, and then plots moving average lines on the overlaid Renko Candles instead of the regular candles. This allows for accurate backtesting of Renko strategies.