Triple Average True Range Channel Definition: By ADAM HAYES from Investopedia -- Updated Jul 8, 2019
The average true range (ATR) is a technical analysis indicator that measures market volatility by decomposing the entire range of an asset price for that period. Specifically, ATR is a measure of volatility introduced by market technician J. Welles Wilder Jr. in his book, "New Concepts in Technical Trading Systems."
The true range indicator is taken as the greatest of the following: current high less the current low; the absolute value of the current high less the previous close; and the absolute value of the current low less the previous close. The average true range is then a moving average, generally using 14 days, of the true ranges.
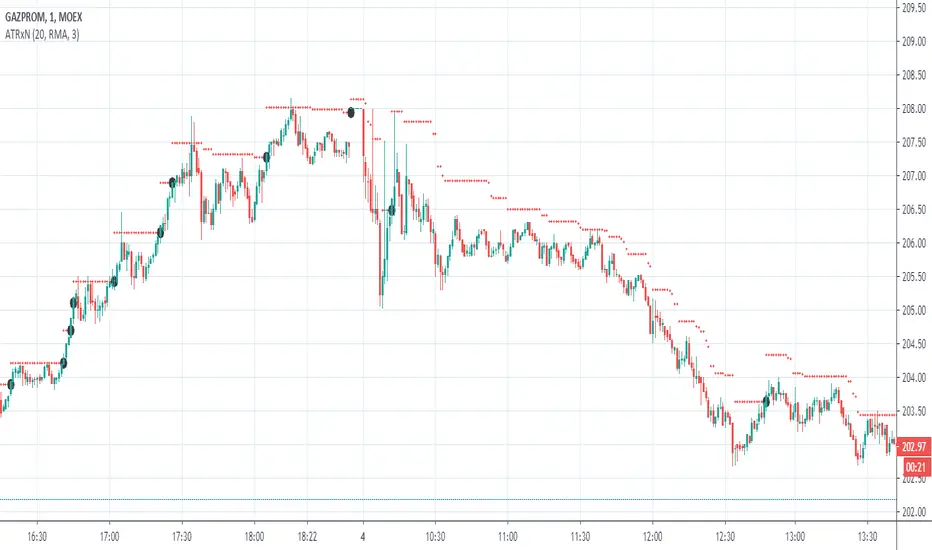
I've added a channel perspective from a certain % from the Slow Average Length that user will have to configure depending of resolution and the markets instruments they chose...
Also a fill is used to easily point out when a high distance between a fast and a slow volatility analysis is occurring.
Which is also denotated with a shaped label...
Share and comment my work :)
Pine Script®指标