Ultimate MTF//@version=5
indicator("Ultimate MTF", shorttitle="Ultimate MTF", overlay=true)
// ============== EMA 13 (Court Terme - Accélérateur) ==============
ema13_enabled = input(true, title="Enable EMA 13", group="EMA 13")
ema13_period = input.int(13, title="EMA 13 Period", minval=1, group="EMA 13")
ema13_color = input(color.new(#FF6B35, 0), title="EMA 13 Color", group="EMA 13")
// ============== EMA 21 (Court Terme - Signal) ==============
ema21_enabled = input(true, title="Enable EMA 21", group="EMA 21")
ema21_period = input.int(21, title="EMA 21 Period", minval=1, group="EMA 21")
ema21_color = input(color.new(#004E89, 0), title="EMA 21 Color", group="EMA 21")
// ============== SMA 50 (Moyen Terme - Zone de Vérité) ==============
sma50_enabled = input(true, title="Enable SMA 50", group="SMA 50")
sma50_period = input.int(50, title="SMA 50 Period", minval=1, group="SMA 50")
sma50_color = input(color.new(#F7931E, 0), title="SMA 50 Color", group="SMA 50")
// ============== SMA 200 (Long Terme - Juge de Paix) ==============
sma200_enabled = input(true, title="Enable SMA 200", group="SMA 200")
sma200_period = input.int(200, title="SMA 200 Period", minval=1, group="SMA 200")
sma200_color = input(color.new(#43A047, 0), title="SMA 200 Color", group="SMA 200")
// ============== FUNCTION TO CALCULATE MA ==============
calcMA(period, maType, source) =>
switch maType
"SMA" => ta.sma(source, period)
"EMA" => ta.ema(source, period)
=> ta.ema(source, period)
// ============== CALCULATE MOVING AVERAGES ==============
ema13_value = ta.ema(close, ema13_period)
ema21_value = ta.ema(close, ema21_period)
sma50_value = ta.sma(close, sma50_period)
sma200_value = ta.sma(close, sma200_period)
// ============== PLOT MOVING AVERAGES ==============
plot(ema13_enabled ? ema13_value : na, title="EMA 13", color=ema13_color, linewidth=2)
plot(ema21_enabled ? ema21_value : na, title="EMA 21", color=ema21_color, linewidth=2)
plot(sma50_enabled ? sma50_value : na, title="SMA 50", color=sma50_color, linewidth=2)
plot(sma200_enabled ? sma200_value : na, title="SMA 200", color=sma200_color, linewidth=2)
带和通道

MTF 5 Moving Averages//@version=5
indicator("Multi-Timeframe 5 Moving Averages", shorttitle="MTF MA x5", overlay=true)
// ============== MOVING AVERAGE 1 ==============
ma1_enabled = input(true, title="Enable MA1", group="Moving Average 1")
ma1_period = input.int(9, title="MA1 Period", minval=1, group="Moving Average 1")
ma1_type = input.string("EMA", title="MA1 Type", options= , group="Moving Average 1")
ma1_color = input(color.new(#FF6B35, 0), title="MA1 Color", group="Moving Average 1")
// ============== MOVING AVERAGE 2 ==============
ma2_enabled = input(true, title="Enable MA2", group="Moving Average 2")
ma2_period = input.int(20, title="MA2 Period", minval=1, group="Moving Average 2")
ma2_type = input.string("EMA", title="MA2 Type", options= , group="Moving Average 2")
ma2_color = input(color.new(#004E89, 0), title="MA2 Color", group="Moving Average 2")
// ============== MOVING AVERAGE 3 ==============
ma3_enabled = input(true, title="Enable MA3", group="Moving Average 3")
ma3_period = input.int(50, title="MA3 Period", minval=1, group="Moving Average 3")
ma3_type = input.string("SMA", title="MA3 Type", options= , group="Moving Average 3")
ma3_color = input(color.new(#F7931E, 0), title="MA3 Color", group="Moving Average 3")
// ============== MOVING AVERAGE 4 ==============
ma4_enabled = input(true, title="Enable MA4", group="Moving Average 4")
ma4_period = input.int(100, title="MA4 Period", minval=1, group="Moving Average 4")
ma4_type = input.string("SMA", title="MA4 Type", options= , group="Moving Average 4")
ma4_color = input(color.new(#1E88E5, 0), title="MA4 Color", group="Moving Average 4")
// ============== MOVING AVERAGE 5 ==============
ma5_enabled = input(true, title="Enable MA5", group="Moving Average 5")
ma5_period = input.int(200, title="MA5 Period", minval=1, group="Moving Average 5")
ma5_type = input.string("EMA", title="MA5 Type", options= , group="Moving Average 5")
ma5_color = input(color.new(#43A047, 0), title="MA5 Color", group="Moving Average 5")
// ============== FUNCTION TO CALCULATE MA ==============
calcMA(period, maType, source) =>
switch maType
"SMA" => ta.sma(source, period)
"EMA" => ta.ema(source, period)
"WMA" => ta.wma(source, period)
=> ta.sma(source, period)
// ============== CALCULATE MOVING AVERAGES (CHART TIMEFRAME ONLY) ==============
ma1_value = calcMA(ma1_period, ma1_type, close)
ma2_value = calcMA(ma2_period, ma2_type, close)
ma3_value = calcMA(ma3_period, ma3_type, close)
ma4_value = calcMA(ma4_period, ma4_type, close)
ma5_value = calcMA(ma5_period, ma5_type, close)
// ============== PLOT MOVING AVERAGES ==============
plot(ma1_enabled ? ma1_value : na, title="MA1", color=ma1_color, linewidth=2)
plot(ma2_enabled ? ma2_value : na, title="MA2", color=ma2_color, linewidth=2)
plot(ma3_enabled ? ma3_value : na, title="MA3", color=ma3_color, linewidth=2)
plot(ma4_enabled ? ma4_value : na, title="MA4", color=ma4_color, linewidth=2)
plot(ma5_enabled ? ma5_value : na, title="MA5", color=ma5_color, linewidth=2)

Selected Days Indicator V3-TrDoes the stock drop every Wednesday? Do March months always move similarly? Does the 1st week of the month behave differently?
Do you ever say "it always makes this move in these months"? Don't you want to see more clearly whether it actually makes this move or not? Don't you want to see and test periodically repeating price patterns?
Hisse her Çarşamba düşüyor mu? Mart ayları hep benzer mi hareket ediyor? Ayın 1. haftası farklı mı davranıyor?
Bazen "bu aylarda hep bu hareketi yapıyor" dediğiniz oluyor mu? Gerçekten de bu hareketi yapıp yapmadığını daha net görmek istemez misiniz? Periyodik tekrarlayan fiyat kalıplarını görmek ve test etmek istemiyor musunuz?
1. Problem
Some stocks or crypto assets exhibit systematic behaviors on certain days, weeks, or months. But it's hard to see - everything is mixed together on the chart. This indicator isolates the days/weeks/months you want and shows only them. Hides everything else.
2. How It Works
Three-layer filter: Day (Monday, Tuesday...), Week (1st, 2nd, 3rd week of the month), Month (January, February...). Select what you want, let the rest disappear. Example: Show only Thursdays of March-June-September. Or compare every 1st week of the month. View as candlestick, line, or column chart.
3. What's It Good For?
Test "end-of-month effect". Find "day-of-the-week anomaly". Analyze crypto volatility by days. See seasonality in commodities. Discover patterns specific to your own strategy. Past data doesn't guarantee the future but provides statistical advantage.

Fixed 5 Point Levels 21 Lines Stable by Pie789The 500-point lines (upper and lower) don't need to be drawn manually. Simply define the center point and adjust it afterwards to create a 500-point frame.

"Clean Market Structure & Trend Confirmation" Clean Market Structure & Trend Confirmation is a high-probability Market Structure and Trend Confirmation indicator trading system designed specifically for SPY and QQQ.
It combines trend structure, multi-timeframe confirmation, momentum gating, and market-state filtering to deliver clean, disciplined BUY and SELL signals — without noise, chop, or over-trading.
This script is built for traders who want clarity first, execution second.

[iQ]PRO Grand Unified Theory Bands+PRO Grand Unified Theory Bands+ (GUT+)
Welcome to the pinnacle of market state analysis. The PRO Grand Unified Theory Bands+ is not just an indicator; it is a multi-dimensional analytical engine designed to synthesize complex mathematical disciplines into a singular, actionable visual interface.
By merging Quantum Signal Processing, Chaos Theory, and Adaptive Cycles, this tool provides a high-fidelity view of market structure that remains invisible to standard retail indicators.
### The Science of Precision
The GUT+ framework operates on a proprietary sequence of six specialized computational layers, ensuring that every signal is filtered for noise and synchronized with the current market rhythm.
Non-Linear Time Warping: Utilizing advanced Laguerre geometry to smooth price action without the catastrophic lag associated with traditional moving averages.
Haar Wavelet Decomposition: We strip away the "market noise" using multi-level wavelet transforms, isolating the core trend from chaotic price fluctuations.
Discrete Fourier Analysis (DFT): The system continuously scans for the dominant market cycle, ensuring the bands expand and contract based on real-time frequency rather than static lookback periods.
State Estimation (Kalman Physics): An adaptive tracking algorithm that predicts the most likely "true" price position by minimizing the recursive variance between signal and noise.
Feigenbaum Bifurcation Logic: Derived from Chaos Theory, our volatility bands use universal constants to identify "bifurcation points"—critical levels where price is mathematically forced to make a directional decision.
MESA Adaptive Engine: Incorporating Hilbert Transforms and MAMA/FAMA logic to track phase transitions, allowing the tool to distinguish between trending and cyclical market environments.
### Key Features & Visual Intelligence
PRO GUT+ translates complex data into a simplified color-coded system, allowing you to read the market state at a glance:
Visual Element Market Interpretation
Golden Yellow Zone Strong Bullish Expansion: Momentum and Trend are perfectly aligned.
Electric Fuchsia Zone Strong Bearish Contraction: Aggressive selling pressure is dominant.
Deep Sea Blue Reversal/Retracement Warning: Systems are diverging; a trend shift is imminent.
Neon Green Flash Breakout Pending: Volatility is compressed to a critical threshold (The "Squeeze").
Circles (Bifurcation) Mathematical Extremes: High-probability exhaustion points.
⚡ Unified Signal Logic
The "Unified Buy/Sell" labels represent the rare alignment of the Laguerre Smoothing, MESA Phase Analysis, and Fourier Cycle Alignment. When these systems reach confluence, the indicator identifies high-conviction entry and exit zones.
### The PRO Data Suite
The real-time dashboard (top right) provides a deep-dive into the current "DNA" of the asset, including:
Dominant Fourier Cycle: The current rhythmic heartbeat of the market.
MESA/Hilbert Periods: Real-time cycle length for adaptive precision.
Market State Engine: A proprietary classification (Neutral, Strong Bull, Breakout Ready, etc.) powered by our internal logic.
### Usage & Access
This tool is part of the MarketMakerIQ Professional Suite. It is designed for traders who require institutional-grade data processing to stay ahead of retail lag.
Optimized For: All timeframes (Scalping to Position Trading).
Asset Classes: Forex, Crypto, Indices, and Equities.
Access: This is a Closed-Source, Invite-Only script.
Note: To maintain the integrity of our proprietary models and prevent market saturation, access is restricted to authorized members of MarketMakerIQ.

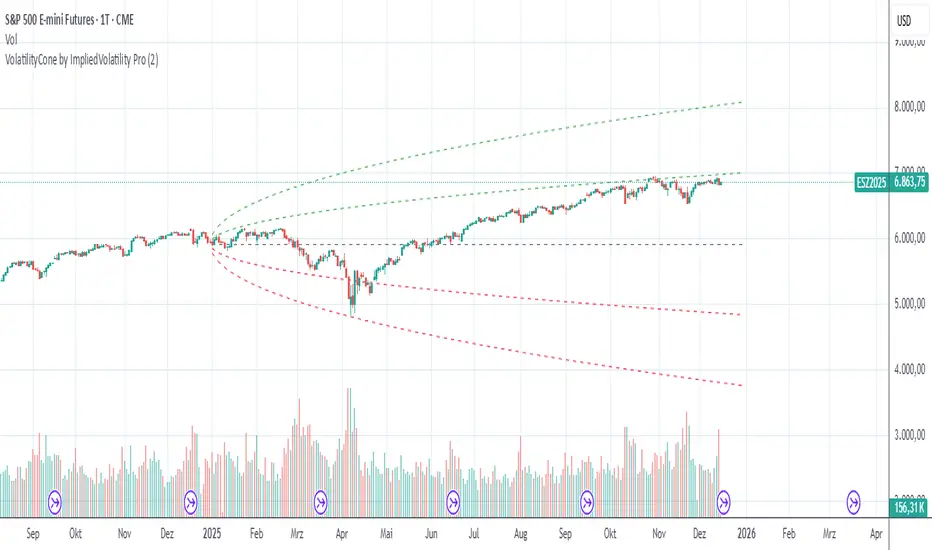
VolatilityCone by ImpliedVolatility ProVolatilityCone by ImpliedVolatility Pro
VolatilityCone by ImpliedVolatility Pro is a forward-looking volatility projection tool that visualizes expected price ranges based on implied volatility.
It draws a volatility cone starting from a user-defined date and projects statistically expected price boundaries into the future using standard deviation theory.
🔍 What does this indicator do?
This indicator calculates and plots price ranges that represent ±1, ±2, and ±3 standard deviations from a starting price, based on implied volatility.
The result is a cone-shaped projection that shows where price is statistically likely to move over time.
In addition, the indicator calculates a Z-Score, showing how far the current price deviates from the expected mean in volatility terms.
📐 Key Features
→ Forward projection based on implied volatility
→ Supports up to 3 standard deviation levels
→ Optional display of half standard deviation levels
→ Manually enter implied volatility or automatically fetch IV from another symbol (e.g. VIX)
→ Custom Start Date
→ The cone starts exactly at the selected date
→ Ideal for earnings, events, or cycle-based analysis
→ Displays the statistical mean price
→ Z-Score indicates how extreme the current price is relative to the cone
📊 How to Use
Price inside the cone
→ Normal volatility behavior
Price near ±1σ
→ Typical volatility range
Price near ±2σ or ±3σ
→ Statistically stretched or extreme conditions
Positive Z-Score
→ Price trading above the mean
Negative Z-Score
→ Price trading below the mean
This makes the indicator useful for:
→ Volatility analysis
→ Mean reversion strategies
→ Risk assessment
→ Event-based forecasting
→ Options-related analysis
⚙️ Notes & Disclaimer
This indicator is not a prediction tool, but a statistical projection
It assumes volatility follows a square-root-of-time model
Best used as a context tool, not as a standalone trading signal
EMA 8 / 20 / 200Created to easily use the 8/20/200 strategy.
This indicator is designed to give a clear, multi-timeframe view of trend, momentum, and structure using three exponential moving averages.
1. Trend direction (EMA 200 – pink)
The 200 EMA acts as the long-term trend filter.
Price above the 200 EMA suggests a bullish market bias.
Price below the 200 EMA suggests a bearish market bias.
Many traders avoid taking trades against this higher-timeframe direction.
2. Momentum and trade bias (EMA 20 – blue)
The 20 EMA reflects short-term momentum.
When price respects the 20 EMA in an uptrend, pullbacks often provide continuation entries.
In downtrends, the 20 EMA frequently acts as dynamic resistance.
3. Entry timing (EMA 8 – yellow)
The 8 EMA is a fast reaction line used for precise timing.
Crosses of the 8 EMA over the 20 EMA can signal momentum shifts.
Strong trends often show price holding above (or below) the 8 EMA during impulse moves.
4. Confluence and trade filtering
The indicator works best when the EMAs are aligned:
Bullish alignment: EMA 8 > EMA 20 > EMA 200
Bearish alignment: EMA 8 < EMA 20 < EMA 200
Misaligned EMAs usually indicate consolidation or low-probability conditions.
5. Risk management context
EMAs can act as dynamic support and resistance:
Stops are often placed beyond the 20 EMA or 200 EMA depending on trade horizon.
Loss of EMA structure is a warning sign that the trend may be weakening.
In short, the indicator is a trend-first, momentum-second framework that helps you decide when to trade, in which direction, and when to stay out.

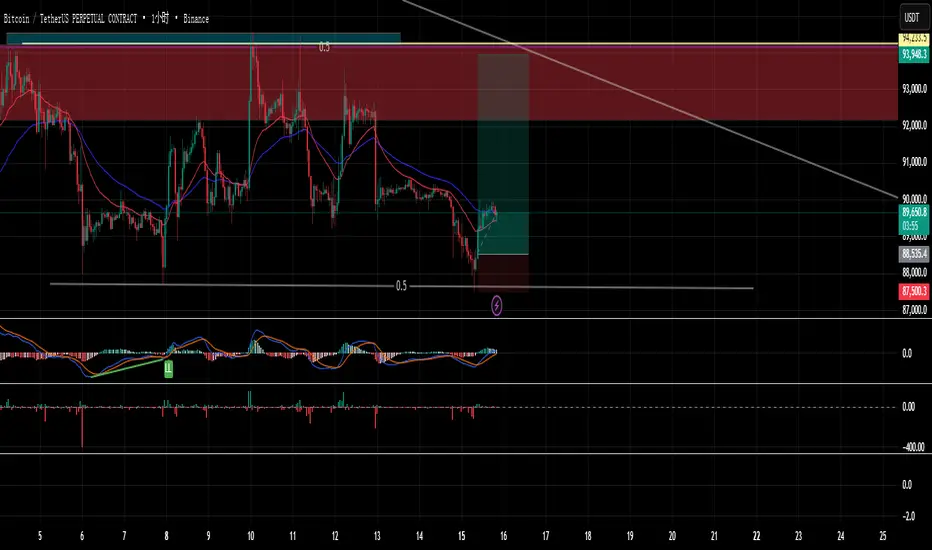
premium//@version=5
indicator("Custom Binance Premium Index + Alerts", overlay=false)
// === 1. 数据源(可修改) ===
// 永续合约价格(默认 BTCUSDT 永续)
futures = request.security("BINANCE:BTCUSDT_PERP", timeframe.period, close)
// 现货价格(默认 BTCUSDT 现货)
spot = request.security("BINANCE:BTCUSDT", timeframe.period, close)
// === 2. 计算自定义溢价指数 ===
premium = ((futures / spot) - 1) * 100
// === 3. 用户设定阈值(你给的值) ===
upper = 1.5 // 溢价 ≥ 1.5 触发告警
lower = -2.0 // 溢价 ≤ -2.0 触发告警
// === 4. 绘图 ===
plot(premium, title="Premium Index (%)", color=color.new(color.blue, 0))
hline(upper, "Upper Threshold (1.5%)", color=color.new(color.red, 0))
hline(lower, "Lower Threshold (-2.0%)", color=color.new(color.green, 0))
// === 5. 告警条件 ===
alertcondition(premium >= upper,
title="溢价 ≥ 1.5%",
message="Premium Index ≥ 1.5%(永续合约偏高,多头较强)"
)
alertcondition(premium <= lower,
title="溢价 ≤ -2.0%",
message="Premium Index ≤ -2.0%(永续合约偏低,空头压力大)"
)
// === 6. 信息显示 ===
label.new(bar_index, premium, "Premium: " + str.tostring(premium, "#.##") + "%",
style=label.style_label_left, color=color.new(color.blue, 85))
AlgosPoint G&MPoint Breaking 2025 (MB&GB Breaking Point Pro)
What It Does:
A comprehensive TradingView indicator that combines multiple technical analysis tools to identify key market breakout points, support/resistance levels, and trading opportunities. It integrates Volume Profile analysis, AlphaTrend signals, and custom risk assessment metrics.
Key Features:
Volume Profile Analysis: Displays Point of Control (POC), Value Area High/Low (VAH/VAL), and volume distribution
Support & Resistance Detection: Automatically identifies key price levels based on volume or price action
AlphaTrend Signals: Generates BUY/SELL signals with visual labels on chart
Volume Spike Detection: Highlights unusual volume activity indicating potential exhaustion or breakout
High Volatility Alerts: Marks periods of increased market volatility using ATR
Risk Assessment Dashboard: Real-time panel showing:
Long/Short percentages (RSI-based)
Stop levels for both directions
Bot activity percentage
Csocy Signal status (Safe/Undecided/Risky)
How to Use:
Add to Chart: Apply indicator to any timeframe (works best on 15m-4H)
Configure Settings: Adjust parameters in grouped sections:
📊 General Settings (lookback periods)
🎯 Support & Resistance (line styles/colors)
💥 Volume Spike (threshold sensitivity)
⚡ High Volatility (ATR multiplier)
📈 Volume Profile (display options)
🔥 AlphaTrend (signal sensitivity)
Read Signals:
BUY label = Potential long entry when AlphaTrend crosses up
SELL label = Potential short entry when AlphaTrend crosses down
Dashboard colors: Green = bullish, Red = bearish, Yellow = neutral
Set Alerts: Built-in alerts for price crosses, volume spikes, and signal confirmations
Risk Management: Use displayed stop levels and Csocy Signal status to manage position sizing
Best For:
Day traders and swing traders
Crypto, Forex, and Stock markets
Identifying high-probability breakout zones
Volume-based trading strategies

MA20 ATR Trend Failure FilterA volatility-adaptive filter designed to identify early trend invalidation.
This indicator combines a 20-period Moving Average (MA20) with Average True Range (ATR) to dynamically define a lower volatility boundary.
When price closes below this boundary, it signals that the current trend is no longer valid and risk is increasing.
Core Concept(核心思想)
MA defines the trend baseline
ATR measures current market volatility
MA − k × ATR forms a dynamic risk threshold
A close below this threshold = trend failure
👉 中文补充:
这不是反转指标,而是趋势失效过滤器,用于避免在趋势已经被破坏后继续持仓或加仓。
How It Works
Calculate MA20 as the trend reference
Calculate ATR(14) as volatility proxy
Build adaptive bands:
Upper Band = MA20 + k × ATR
Lower Band = MA20 − k × ATR
If close < Lower Band, trend is considered failed
The ATR multiplier k automatically adjusts the tolerance based on volatility, avoiding rigid fixed-percentage rules.
Visual Elements
Yellow line: MA20
Green band: MA20 + k × ATR
Red band: MA20 − k × ATR (key risk boundary)
Red triangle + “FAIL” label: Trend failure signal
Optional background shading to highlight risk zones
Typical Use Cases
Trend-following strategies (exit / reduce exposure)
Breakout strategies (filter false continuation)
Risk management overlay (non-intrusive, no repaint)
Combine with HMA, SuperTrend, structure-based entries
👉 中文补充:
非常适合作为**“不该再拿”的客观判断条件**,而不是频繁交易信号。
Why This Indicator
Volatility-adaptive (ATR-based)
No future data, no repaint
Simple logic, strong risk control
Works across stocks, crypto, futures, indices
This tool is designed to answer one question only:
Is the current trend still valid?
Parameters
MA Length (default: 20)
ATR Length (default: 14)
ATR Multiplier k (default: 0.8)
Lower k → stricter risk control
Higher k → more tolerance, fewer false signals SSE:600595

Market + Direction + Entry + Hold + Exit v1.5 FINALOverview
This script is a complete trend-based trading framework designed to filter market conditions, determine directional bias, detect high-quality pullback entries, manage active trades, and identify trend-weakening exit points.
It is optimized for NQ futures, Gold (XAUUSD), and Bitcoin, with adaptive parameters for each asset.
The logic focuses on trading only when conditions are favorable, aligning entries with the primary trend, and avoiding low-probability setups.
1. Market Condition Filter
Before any signal appears, the script checks whether the market is active using three conditions:
ATR compared to ATR moving average (volatility condition)
Volume compared to average volume (liquidity condition)
Price distance from VWAP (suppression of mean-reversion environments)
A trade environment is considered active when at least two of these three conditions are positive.
2. Trend Direction Filter
Directional bias is defined by:
EMA21 relative to EMA55
Price relative to VWAP
Heikin-Ashi structure
When these conditions align, the script switches into long-only or short-only mode.
No counter-trend signals are displayed.
3. Entry Logic (L, L2, L3 and S, S2, S3)
The system identifies pullback entries within a confirmed trend.
Long entries require:
Uptrend confirmation
Price dipping toward EMA21 or EMA55
A constructive Heikin-Ashi candle
Market environment active
Short entries mirror the same structure in bearish conditions.
Re-entries (L2, L3, S2, S3) are given only if the trend remains intact after the first entry.
4. Hold Logic
A hold signal appears if momentum remains aligned with the trend.
Momentum is evaluated using the Stochastic indicator (K and D lines).
5. Exit Logic
An exit signal appears when:
The recent structural low (for longs) or high (for shorts) is broken, and
The EMA slope indicates weakening trend strength
This combination identifies high-probability trend exhaustion.
How to Use
Add the script to your chart.
Select an asset preset (NQ, GOLD, BTC).
Wait for the market to be active.
Follow the entry signals (L, L2, L3 or S, S2, S3).
Hold signals help confirm continuation.
Exit signals indicate potential trend reversal or weakness.
Feature Summary
Market environment filter
Trend direction filter
Pullback-based entry system
Multi-stage re-entry framework
Momentum-based hold signal
Structure-based exit
Asset-adaptive parameters
Clean chart visualization
Disclaimer
This script is for research and educational use.
It does not constitute financial advice.
Always backtest before using in live markets.
개요
이 스크립트는 시장 상태 필터링, 추세 방향 판단, 고품질 눌림목 진입, 보유 판단, 추세 약화 기반 청산까지 모두 포함하는 완전한 트레이딩 프레임워크입니다.
NQ, 골드(XAUUSD), 비트코인에 맞게 최적화되어 있습니다.
1. 시장 필터
다음 세 가지 중 두 가지 이상이 충족될 때만 매매 환경을 ‘활성’으로 판단합니다.
ATR 기준 변동성 체크
거래량 활성도 체크
가격의 VWAP 거리 체크
2. 방향(추세) 필터
다음 조건을 기반으로 상승·하락 추세를 결정합니다.
EMA21 vs EMA55
가격 vs VWAP
Heikin-Ashi 구조
이 조건이 일치할 때만 롱 전용 또는 숏 전용 모드로 진입합니다.
3. 진입 로직
추세가 유지되는 상태에서 EMA21 또는 EMA55까지 눌림이 나올 때
L 또는 S 신호를 제공합니다.
추세가 유지되면 L2/L3, S2/S3 재진입 신호가 추가로 발생합니다.
4. 보유(Hold)
모멘텀이 추세 방향과 일치할 때 보유 신호를 제공합니다.
5. 청산(Exit)
다음 두 조건이 동시에 나타날 때 청산 신호가 표시됩니다.
직전 구조(스윙)가 붕괴될 때
EMA 기울기가 약화될 때
사용 방법
차트에 스크립트를 추가합니다.
자산 프리셋(NQ, GOLD, BTC)을 선택합니다.
시장이 활성일 때만 신호를 참고합니다.
L/S 진입 신호와 보유/청산 신호를 활용해 매매 흐름을 관리합니다.

Supply and Demand Zones [BigBeluga]🔵 OVERVIEW
The Supply and Demand Zones indicator automatically identifies institutional order zones formed by high-volume price movements. It detects aggressive buying or selling events and marks the origin of these moves as demand or supply zones. Untested zones are plotted with thick solid borders, while tested zones become dashed, signaling reduced strength.
🔵 CONCEPTS
Supply Zones: Identified when 3 or more bearish candles form consecutively with above-average volume. The script then searches up to 5 bars back to find the last bullish candle and plots a supply zone from that candle’s low to its low plus ATR.
Demand Zones: Detected when 3 or more bullish candles appear with above-average volume. The script looks up to 5 bars back for a bearish candle and plots a demand zone from its high to its high minus ATR.
Volume Weighting: Each zone displays the cumulative bullish or bearish volume within the move leading to the zone.
Tested Zones: If price re-enters a zone and touches its boundary after being extended for 15 bars, the zone becomes dashed , indicating a potential weakening of that level.
Overlap Logic: Older overlapping zones are removed automatically to keep the chart clean and only show the most relevant supply/demand levels.
Zone Expiry: Zones are also deleted after they’re fully broken by price (i.e., price closes above supply or below demand).
🔵 FEATURES
Auto-detects supply and demand using volume and candle structure.
Extends valid zones to the right side of the chart.
Solid borders for fresh untested zones.
Dashed borders for tested zones (after 15 bars and contact).
Prevents overlapping zones of the same type.
Labels each zone with volume delta collected during zone formation.
Limits to 5 zones of each type for clarity.
Fully customizable supply and demand zone colors.
🔵 HOW TO USE
Use supply zones as potential resistance levels where sell-side pressure could emerge.
Use demand zones as potential support areas where buyers might step in again.
Pay attention to whether a zone is solid (untested) or dashed (tested).
Combine with other confluences like volume spikes, trend direction, or candlestick patterns.
Ideal for swing traders and scalpers identifying key reaction levels.
🔵 CONCLUSION
Supply and Demand Zones is a clean and logic-driven tool that visualizes critical liquidity zones formed by institutional moves. It tracks untested and tested levels, giving traders a visual edge to recognize where price might bounce or reverse due to historical order flow.

Momentum Burst Pullback System v66 * Detects **momentum “bursts”** using:
* **Keltner breakout** (high above upper band for long, low below lower band for short), and/or
* **MACD histogram extreme** (highest/lowest in a lookback window, with correct sign).
* Optional **burst-zone extension** keeps the burst “active” for N extra bars after the burst.
* Marks bursts with **K** (Keltner) and **M** (MACD) labels:
* Core burst labels use one color, extension labels use a different color.
* Tracks the most recent burst as the **dominant side** (long or short), and stores burst “leg” anchors (high/low context).
* Adds **structure-based invalidation**:
* On a new **core burst**, it locks the most recent **confirmed swing** level (pivot):
* Long: locks the last confirmed **swing low**.
* Short: locks the last confirmed **swing high**.
* After the burst, if price **breaks that locked level**, the burst regime is **cancelled** (and any pending setup on that side is dropped).
* Finds **pullback setups** after a dominant burst (and not inside the active burst zone), within min/max bars:
* Long pullback requires a sequence of **lower highs** and price still below the burst high.
* Short pullback requires **higher lows** and price still above the burst low.
* Optional background shading highlights pullback bars.
* On pullback bars, plots **static TP/SL crosses** using ATR:
* Anchor is the pullback bar’s high (long) or low (short).
* TP/SL are ± ATR * multiple.
* TP plots are visually classified (bright vs faded) based on whether TP would exceed the prior burst extreme.
* Maintains a **state-machine entry + trailing stop**:
* Sets a “waiting” trigger on pullback.
* Enters when price breaks the trigger (high break for long, low break for short).
* Trails a stop using **R-multiples**, with different behavior pre-break-even, post-break-even, and near-TP.
* Optionally draws the trailing stop as horizontal line segments.
* Optionally shows a **last-bar label** with the most recent pullback’s TP and SL values.

Bollinger Bands Forecast with Signals (Zeiierman)█ Overview
Bollinger Bands Forecast with Signals (Zeiierman) extends classic Bollinger Bands into a forward-looking framework. Instead of only showing where volatility has been, it projects where the basis (midline) and band width are likely to drift next, based on recent trend and volatility behavior.
The projection is built from the measured slopes of the Bollinger basis, the standard deviation (or ATR, depending on the mode), and a volatility “breathing” component. On top of that, the script includes an optional projected price path that can be blended with a deterministic random walk, plus rejection signals to highlight failed band breaks.
█ How It Works
⚪ Bollinger Core
The script first computes standard Bollinger Bands using the selected Source, Length, and Multiplier:
Basis = SMA(Source, Length)
Band width = Multiplier × StDev(Source, Length)
Upper/Lower = Basis ± Width
This remains the “live” (non-forecast) structure on the chart.
⚪ Trend & Volatility Slope Estimation
To project forward, the indicator measures directional drift and volatility drift using linear regression differences:
Basis slope from the Bollinger basis
StDev slope from the Bollinger deviation
ATR slope for ATR-based projection mode
These slopes drive the forecast bands forward, reflecting the market’s recent directional and volatility regime.
⚪ Projection Engine (Forecast Bands)
At the last bar, the indicator draws projected basis, upper, and lower lines out to Forecast Bars. The projected basis can be:
Trend (straight linear projection)
Curved (ease-in/out transition toward projected endpoints)
Smoothed (extra smoothing on projected basis/width)
⚪ Price Path Projection + Optional Random Walk
In addition to projecting the bands, the script can draw a price forecast path made of a small number of zigzag swings.
Each swing targets a point offset from the projected basis by a multiple of the projected half-width (“width units”).
Decay gradually reduces swing size as the forecast deepens.
The Optional Random Walk Blend adds a deterministic drift component to the zigzag path. It’s not true randomness; it’s a stable pseudo-random sequence, so the drawing doesn’t jump around on refresh, while still adding “natural” variation.
⚪ Rejection Signals
Signals are based on failed attempts to break a band:
Bear Signal (Down): price tries to push above the upper band, then falls back inside, while still closing above the basis.
Bull Signal (Up): price tries to push below the lower band, then returns back inside, while still closing below the basis.
█ How to Use
⚪ Forward Support/Resistance Corridors
Treat the projected upper/lower bands as a future volatility envelope, not a guarantee:
The upper projection ≈ is likely a resistance level if the regime persists
The lower projection ≈ is likely a support level if the regime persists
Best used for trade planning, targets, and “where price could travel” under similar conditions.
⚪ Regime Read: Trend + Volatility
The projection shape is informative:
Rising basis + expanding width → trend with increasing volatility (needs wider stops / more caution)
Flat basis + compressing width → contraction regime (often precedes expansion)
⚪ Signals for Mean-Reversion / Failed Breakouts
The rejection markers are useful for fade-style setups:
A Down signal near/after upper-band failure can imply rotation back toward the basis.
An Up signal near/after lower-band failure can imply snap-back toward the basis.
With MA filtering enabled, signals are constrained to align with the broader bias, helping reduce chop-driven noise.
█ Related Publications
Donchian Predictive Channel (Zeiierman)
█ Settings
⚪ Bollinger Band
Controls the live Bollinger Bands on the chart.
Source – Price used for calculations.
Length – Lookback period; higher = smoother, lower = more reactive.
Multiplier – Bandwidth; higher = wider bands, lower = tighter bands.
⚪ Forecast
Controls the forward projection of the Bollinger Bands.
Forecast Bars – How far into the future the bands are projected.
Trend Length – Lookback used to estimate trend and volatility slopes.
Forecast Band Mode – Defines projection behavior (linear, curved, breathing, ATR-based, or smoothed).
⚪ Price Forecast
Controls the projected price path inside the bands.
ZigZag Swings – Number of projected oscillations.
Amplitude – Distance from basis, measured in bandwidth units.
Decay – Shrinks swings further into the forecast.
⚪ Random-Walk
Adds controlled randomness to the price path.
Enable – Toggle random-walk influence.
Blend – Strength of randomness vs. zigzag.
Step Size – Size of random steps (band-width units).
Decay – Reduces randomness as the forecast deepens.
Seed – Changes the (stable) random sequence.
⚪ Signals
Controls rejection/mean-reversion signals.
Show Signals – Enable/disable signal markers.
MA Filter (Type/Length) – Filters signals by trend direction.
-----------------
Disclaimer
The content provided in my scripts, indicators, ideas, algorithms, and systems is for educational and informational purposes only. It does not constitute financial advice, investment recommendations, or a solicitation to buy or sell any financial instruments. I will not accept liability for any loss or damage, including without limitation any loss of profit, which may arise directly or indirectly from the use of or reliance on such information.
All investments involve risk, and the past performance of a security, industry, sector, market, financial product, trading strategy, backtest, or individual's trading does not guarantee future results or returns. Investors are fully responsible for any investment decisions they make. Such decisions should be based solely on an evaluation of their financial circumstances, investment objectives, risk tolerance, and liquidity needs.

Rainbow MA Width█ OVERVIEW
Rainbow MA Width is a companion indicator for Rainbow MA Cloud. It displays ribbon width as a normalized Z-Score, allowing traders to visualize trend momentum expansion and contraction relative to recent history.
█ CONCEPTS
Z-Score Normalization:
Rather than displaying raw width values (which vary by asset and timeframe),
this indicator normalizes the ribbon width using Z-Score calculation:
Z-Score = (Current Width - Average Width) / Standard Deviation
Z-Score Interpretation:
• 0 = Average width (mean)
• +1 to +2 = Expanding (above average, strong trend)
• -1 to -2 = Contracting (below average, weakening trend)
• Beyond ±2 = Extreme (statistical outlier, potential reversal)
Width Calculation Modes:
• Outer — Distance between fastest and slowest MA: |MA1 - MA8|
• Average Gap — Mean of all adjacent MA gaps
• Total Gap — Sum of all adjacent MA gaps
█ FEATURES
1 — Width Mode Selection
Three methods to calculate ribbon width.
"Outer" recommended for aligned trends.
2 — Z-Score Period
Configurable lookback for mean and standard deviation.
Default 20 bars; increase for smoother, less reactive readings.
3 — Zone Fill Coloring
Cyan fill when expanding (Z > 0).
Orange fill when contracting (Z < 0).
Yellow fill for extreme values (|Z| > 2) as warning.
4 — Alignment Background
Green background during bullish alignment.
Red background during bearish alignment.
Synced with Rainbow MA Cloud for consistency.
5 — Reference Lines
Horizontal lines at 0 (mean), ±1σ, and ±2σ levels.
Provides clear visual boundaries for interpretation.
6 — Raw Width Display
Optional secondary line showing original width percentage.
Useful for comparing normalized vs absolute values.
█ HOW TO USE
Trend Confirmation:
• Z-Score rising above 0 confirms trend acceleration
• Z-Score staying above +1 indicates sustained strong momentum
• Use alongside alignment background for confluence
Reversal Warning:
• Z-Score exceeding +2 suggests overextension (yellow warning zone)
• Z-Score dropping below -2 indicates extreme contraction
• Extreme readings often precede trend reversals or consolidation
Entry Timing:
• Enter trends when Z-Score crosses above 0 (expansion beginning)
• Avoid entries when Z-Score is at extreme highs (potential exhaustion)
• Consider exits when Z-Score peaks and begins declining
█ LIMITATIONS
• Z-Score is relative to lookback period; different periods give different readings
• Extreme zones (±2) are statistical guides, not guarantees
• Best used in conjunction with Rainbow MA Cloud for full context
█ ALERTS
Four built-in alert conditions:
• Z-Score crosses above/below zero
• Z-Score enters extreme high/low zones (±2)

Rainbow MA Cloud█ OVERVIEW
Rainbow MA Cloud displays 8 Moving Averages as a gradient-colored cloud to visualize trend direction and strength. The "rainbow" effect shows momentum through ribbon width, while perfect MA alignment signals strong trending conditions.
█ CONCEPTS
The indicator uses 8 MAs with Fibonacci-based default lengths (8, 13, 21, 34, 55, 89, 144, 233) to create a layered view of price momentum across multiple timeframes.
Perfect Alignment Detection:
• Bullish Alignment — All 8 MAs in ascending order (MA1 > MA2 > ... > MA8)
Indicates strong uptrend with momentum across all timeframes
• Bearish Alignment — All 8 MAs in descending order (MA1 < MA2 < ... < MA8)
Indicates strong downtrend with aligned selling pressure
• Mixed — MAs are not in sequential order, suggesting consolidation or transition
Ribbon Width:
• Widening ribbon = Trend acceleration, increasing momentum
• Narrowing ribbon = Trend weakening, potential reversal or consolidation
█ FEATURES
1 — MA Configuration
Choose from EMA, SMA, WMA, VWMA, or HMA calculation methods.
All 8 MA lengths are fully customizable.
2 — Color Themes
Five built-in themes: Rainbow, Warm, Cool, Neon, Mono.
Creates visually distinct gradient from fast to slow MAs.
3 — Alignment Background
Green background during bullish alignment.
Red background during bearish alignment.
Helps quickly identify strong trending periods.
4 — Trend Signals
Labels appear when perfect alignment forms.
"BULL ALIGN" for bullish, "BEAR ALIGN" for bearish.
5 — Information Panel
Real-time display of alignment status, trend strength percentage,
ribbon width, price position relative to cloud, and MA values.
█ HOW TO USE
Entry Signals:
• Look for alignment signals (BULL/BEAR ALIGN) as trend confirmation
• Enter long when bullish alignment forms with price above cloud
• Enter short when bearish alignment forms with price below cloud
Trend Following:
• Stay in position while alignment background color persists
• Widening ribbon confirms trend continuation
• Exit or reduce when alignment breaks (background disappears)
Support/Resistance:
• Cloud edges act as dynamic support (bullish) or resistance (bearish)
• Price entering cloud suggests consolidation or potential reversal
█ LIMITATIONS
• Alignment signals are lagging by nature (based on MA crossovers)
• Works best on trending markets; generates mixed signals during ranging periods
• Ribbon width measurement uses outer MAs only (MA1 vs MA8)
█ COMPANION INDICATOR
Use "Rainbow MA Width" indicator for detailed Z-Score analysis of ribbon expansion/contraction patterns.

Chartology Strategy+🔍 Chartology Strategy+
This tool provides a comprehensive way for users to analyze trend levels and access other Matrix features across selected tickers and timeframes. Results can be tailored by strategy, with the option to filter displayed tickers based on custom user‑defined rules.
Bullish & Bearish Entry Signal (Safe & Scalping).
Entry Level, SL, T-SL & Two TP Levels (Based on Possible Movement).
Dashboard Table for Easy Presentation of All Levels.
Timeframe Scanner for Current Signal (Trend) on Different Timeframes.
Gap Up & Gap Down for Untraded Price Marking.
Institutional Candles for High Volume and Big Price Movement.
Neutral Candle for Low Volume and Small Price Movement.
Supply Demand (Based on Swing High & Low).
Mega Trend Band (Based on HMA) for Overall Trend.
🟢 Bullish & Bearish Entry Signals
Shows the expected direction of the symbol. It shows Bullish and Bearish direction mark on Chart. Entry Level is Closing of the Candle.
Input Settings
Signal Type: Safe
Appears after a proper trend confirmation.
Low frequency, fewer signals, but more reliable.
Best for swing traders who want strong confirmation before entering.
Signal Type: Scalping
Appears frequently during small downward moves.
High frequency, quick signals for short-term trades.
Best for intraday
Traders who want multiple opportunities in small movements.
🎯 Entry Level, SL, T-SL & TP Levels
Generated based on price movement and trend range.
Levels on Chart
Entry Level: Closing price of the candle where the signal appears.
SL (Stop Loss): Maximum risk allowed for the trade.
TSL (Trailing SL): Dynamic SL to reduce risk and lock profits.
Level 01: First TP level with 1:1 risk-reward ratio. Used for partial booking.
Level 02: Final TP level for full exit.
Input Settings
Levels: You can Increase or Decrease Level Amount for the Level 2.
Risk: You can Increase or Decrease Stop Loss (SL).
📊 Dashboard Table for Easy Presentation of All Levels.
Displays all key levels and metrics in one place:
Metrics
Symbol Name Shows the name of the current chart (e.g., NIFTY, BANKNIFTY).
Bar Age Displays the How many candles (Bars) before Latest signal appears.
Entry Shows the entry level where the latest bullish or bearish signal was generated.
Level 1 (TP1) First target level, based on 1:1 risk-reward ratio. Used for partial booking to secure profits.
Level 2 (TP2) Final target level where you can exit the remaining position.
SL (Stop Loss) Shows the maximum risk limit for the trade. Helps you control losses.
MTM (Mark to Market) Shows the difference between CMP and Entry Level. Helps track how far price has moved since entry.
P&L (Profit & Loss) Shows the difference between Entry and Target Level achieved. Helps measure actual gain or loss.
Date & Time Displays when the latest bullish or bearish signal was generated. Helps check how old or fresh the signal is.
Timeframe Scanner or Current Signal (Trend) on Different Timeframes. Shows the current signal across multiple timeframes.
Row 1 Fixed signals for 1M and 3M.
Row 2 Any 2 Custom Timeframes chosen in input settings.
Traders use this to confirm signals across different timeframes before entering trades. Example If the Day trend is bullish but the 15M chart shows bearish, many traders avoid that trade.
🚦 Gap Up & Gap Down for Untraded Price Marking.
Marks untraded price zones where price may react.
Gap Up & Down Flag Mark
Gap Up: Bullish Bias, Marked Green flag, plotted when candle opens above previous high.
Gap Down: Bearish Bias, Marked as Red flag, plotted when candle opens below previous low.
Input Settings
Enable / Disable from Chart
Threshold: Minimum gap size Threshold to detect
🟡 Institutional Candles for High Volume and Big Price Movement
Indicate strong price movement with high volume.
Marking
Displayed as Yellow Body Candles
Helps identify zones where big players are active.
Input Settings
Enable / Disable from Chart
Body %: Compare of Open & Close with High & Low
Size %: Compare Total Candle Size from Past Range
Volume %: Compare Total Candle Volume from Past Range
⚪ Neutral Candle for Low Volume and Small Price Movement
Shows low volume and minimal price movement.
Marking
Displayed as Hollow Body Candles
Traders usually avoid trading during these candles.
Input Settings
Enable / Disable from Chart.
Candle %: Compare Size of candles.
Volume %: Compare Volume of Candles from Previous Range.
🟥🟩 Supply Demand Zones (Based on Swing High & Low).
Based on swing highs and lows to identify possible reversals.
Zones
🟥Supply Zone: Near swing high, marked with Light Red Zone.
🟩Demand Zone: Near swing low, marked with Light Green Zone.
Input Settings:
Bars Left: How many past Bars Swing will Calculate.
Bars Right: After How many Bars, Zone will plot.
Max Zones: Number of Supply or Demand Zone want to plot on Chart
Delete Breaked Zones: Want to see Disappeared Zone, Uncheck it.
Extend Right: Want to see till End of the Chart, Uncheck it.
📈 Mega Trend Band (Based on HMA) for Overall Trend
Based on HMA (Hull Moving Average) to show overall trend and Help in Filters out trades against the main trend.
Working
Price above band → Bullish trend
Price below band → Bearish trend
Input Setting
Enable / Disable from Chart
HMA Period Setting: 45
👓 How to Use All together for Better Confidence.
🔍Watch for the New Entry icon on the chart.
Find New Signals with help of Automated Alerts.
Check Entry Level, SL, Level 1 and Level 2 (TP2).
Verify Date & Time → how fresh the signal is. Signal not too old.
🧭 Signal is not Self Sufficient for Good Accuracy. So, we suggest a few rules.
Cross‑Check Current Signal with Timeframe Scanner. Trade only when smaller timeframe aligns with bigger trend. (e.g., If Day = Bullish ▲ but 15M = Bearish ▼, avoid entry. Trend may not be stronger.)
Validate with Market Context of Gap. (e.g., If new signal came on Gap Up / Gap Down, avoid entry. Price may reverse.)
Zone Awareness Use Supply Demand zones to refine entries/exits and avoid false signals. (e.g., Entry: If any zone is available between Entry and Level 01, Avoid trade until Zone breaked, Exit: If Zone create between the trade, modify SL according to T-SL and wait.
Trend Filter of overall direction. (e.g., If Mega Trend Band Bullish and Trend is Bearish, Avoid the Trade.)
🕵🏻 Quick Checklist Before Trade
Bullish or Bearish signal?
Dashboard Table shows fresh entry?
SL defined and acceptable risk?
Timeframe Scanner aligned?
No Neutral candle interference?
Institutional candle or Gap supports move?
Supply/Demand zone not against trade?
✅ All Okay - Go for the ENTRY
Set a Proper Entry Point
Always respect SL, Good Trader Never avoid it.
Book partial profits at Level 1, It secure your Trade.
Keep Modifying your SL, According to T-SL Level.
On Level 2, Exit remaining All position for full profit.
📊 Healthy Trading Tips
Risk Small: Never risk more than 1–2% per trade.
Size Smart: Adjust position size to volatility and account size.
Diversify: Don’t put all money in one asset/sector.
Plan Ahead: Set entry, exit, and stop‑loss before trading.
Trade Less: Focus on quality setups, avoid overtrading.
Use Both Analyses: Combine technical charts with fundamental news/events.
Control Emotions: Stick to strategy, avoid fear/greed.
Journal Trades: Record reasons, outcomes, and lessons.
Stay Informed: Track economic calendars and global events.
Take Breaks: Step away after wins/losses to reset.
🎯 Advanced Discipline
Partial Exit: Book profits in stages (e.g., 50% at 1:1, 50% at Final Level).
Check News: Avoid trading during major announcements.
No Tweaks: Don’t change plan mid‑trade; wait for SL/TP.
Fixed Rules: Trade with fixed risk, fixed gains.
No Averaging Losses: Close bad trades, don’t add more.
Keep Learning: Evolve strategy with market changes.
Believe: Trust your plan and process.
Backtest: Practice setups until they’re second nature.
Daily Routine: Pre‑market Preparation, post‑market review.
Optimize Setup: Clean workspace, fast platform, no distractions.
Track Metrics: Win rate, average reward, expectancy, time of day, setup performance.
Trader Identity: Follow rules; money is a byproduct.
Liquidity Check: Avoid low‑volume instruments.
Respect Trend: Trade with momentum, not against it.
Avoid Over‑Leverage: Keep leverage low, avoid margin unless planned.
Risk Disclaimer
This content, including any tools, software, datafeeds, indicators, or scanners, is provided strictly for charting, educational, informational, and paper‑trading purposes only. It does not constitute investment advice, buy/sell recommendations, or real‑money trading strategies.
Not Advisors: We are not registered as investment advisors or research analysts.
Charting Only: Use is limited to testing strategies and evaluation; any application to real trading is at the user’s sole risk.
No Liability: No liability is accepted for financial loss, trading loss, or damages arising from use of the tools or data.
Data Limitations: Market data may be delayed, inaccurate, or incomplete. Past or hypothetical performance is not indicative of future results.
Signals Disclaimer: Automated signals are for evaluation only and should not be treated as accurate or real trading instructions.
High Risk: Trading and investing involve substantial risk and can result in losses beyond the initial capital.
Independent Judgment: Users must exercise independent judgment and consult licensed professionals before making financial decisions
⚠️ Final Note: Trading is speculative and may not be suitable for all investors. Use only risk capital and never invest money you cannot afford to lose.
✅ Always remember🧠 my 3R Rule💡: If the money💰 is yours then, RISK⚖️, REWARD🏆 and REGRET😔 are solely yours. 🔥

Market Compression & Entropy VectorOverview
This indicator measures market energy states and directional bias using concepts from information theory. It detects when markets are "coiling" (compression) versus "expanding" (decompression), and predicts early pivot points before they fully form.
Core Concepts
Compression-Decompression (0-1 scale)
Compression (blue): Low volatility, narrow ranges. Energy building for breakout.
Decompression (orange): High volatility, trending. Energy releasing.
Entropy Vector (-1 to +1)
Derived from buy/sell pressure using Shannon entropy:
Positive: Bullish bias (buyers dominating)
Negative: Bearish bias (sellers dominating)
Near zero: Indecision
Early Pivot Detection
Predicts reversals using 5 confluence factors:
Entropy vector crossing zero
Momentum exhaustion (rate of change reversal)
Compression exit (breakout from consolidation)
Price-entropy divergence
Extreme entropy readings
Signals
Signal Meaning
BUY Exiting compression with bullish entropy
SELL Exiting compression with bearish entropy
TOP (diamond) High probability of downward reversal
BTM (diamond) High probability of upward reversal
Key Settings
Pivot Sensitivity (1-10): Higher = more pivot signals
Pivot Score Threshold (30-90): Minimum score to trigger pivot marker
Compression/Decompression Thresholds: Define phase boundaries
Info Table
Displays real-time metrics including compression score, entropy vector, directional bias, and pivot prediction scores for tops/bottoms.
Best Use
Wait for compression phase (blue background)
Watch entropy vector for directional bias
Enter when pivot signal aligns with entropy direction
Use decompression phase for trend-following
Tags: entropy, compression, pivot detection, reversal, momentum, volatility

Delta Price Range BandsThis indicator uses the historical price delta range analysis method, perhaps known to some as HPDR thanks to YouTuber Krown.
To test the method and it's usability, I programmed my own version and put some more features into it, like a preview median price feature.

Trading Value RSI (NQ Tuned)The Trading Value RSI (NQ Tuned) is an indicator that applies the RSI calculation to trading value, defined as volume × close, rather than just price. It is specifically tuned for Nasdaq 100 futures (NQ), with a default RSI length of 24, overbought level at 75, and oversold level at 25 to filter out false signals from high volatility. The indicator visually colors the RSI line based on overbought (red), oversold (green), or neutral (blue) conditions. A horizontal midline at 50 helps identify potential trend direction changes or confirm ongoing momentum. This tool allows traders to monitor capital flow intensity, giving insight into when strong buying or selling pressure may drive short-term market moves.


Triple VWAP: Anchored# Triple VWAP: Anchored + Last 2 Sessions
## 📊 Overview
**Triple VWAP** is a professional-grade Volume Weighted Average Price (VWAP) indicator designed for serious traders who need multi-timeframe volume analysis on a single chart. This indicator combines three powerful VWAP calculations: a custom **Anchored VWAP** from any historical date, a real-time **Current Session VWAP**, and **Previous Session VWAP** reference levels—all with configurable standard deviation bands.
Perfect for intraday traders, swing traders, and institutional-level analysis on Indian markets (Nifty, BankNifty) and global instruments.
***
## ✨ Key Features
### 🎯 Three Independent VWAP Calculations
**📍 Anchored VWAP (Long-term Reference)**
- Anchor VWAP from any specific date and time (year, month, day, hour, minute)
- Ideal for tracking price action from significant market events, earnings, or trend reversals
- Maintains accumulation from your chosen anchor point throughout the entire timeframe
**📅 Current Session VWAP (Real-Time)**
- Automatically resets at the start of each trading day
- Calculates dynamically as new bars form during the session
- Shows institutional trading levels and intraday fair value
**📆 Previous Session VWAP (Reference Levels)**
- Displays yesterday's final VWAP as horizontal reference lines
- Helps identify support/resistance zones from prior session
- Useful for gap analysis and opening range strategies
### 📐 Standard Deviation Bands
Each VWAP calculation includes optional standard deviation bands:
- **±1 SD** - Identifies normal price deviation zones
- **±2 SD** - Marks extreme price movements (high probability reversal zones)
- **±3 SD** - Ultra-extreme levels (rare price extensions)
Configure which SD levels to display for each VWAP type independently.
### 🎨 Customizable Visual Settings
- **Independent Color Schemes**: Assign unique colors to each VWAP type and its SD bands
- **Adjustable Line Widths**: Configure VWAP and SD line thickness (1-5 for VWAP, 1-3 for SD)
- **Plot Styles**: Previous session plots use cross-style for clear differentiation from real-time plots
- **Background Zones**: Optional colored zones when price extends beyond ±2 SD levels
- **Session Labels**: Automatic date labels marking each VWAP anchor point
### 📊 Information Dashboard
Real-time statistics table displaying:
- Current VWAP values for all three calculations
- Live standard deviation values
- ±1 SD levels for quick reference
- Distance from price to each VWAP (percentage format)
- Session tracking counter
- Color-coded proximity indicators
***
## 🔧 How to Use
### For Intraday Trading
1. **Current Session VWAP** acts as dynamic support/resistance—price above VWAP indicates bullish bias, below indicates bearish bias
2. Use **±1 SD bands** for profit targets and stop-loss placement
3. **±2 SD touches** often signal mean reversion opportunities
4. **Previous Session VWAP** provides overnight gap reference levels
### For Swing Trading
1. **Anchored VWAP** from significant events (breakouts, earnings, trend changes) shows institutional cost basis
2. Price trading consistently above/below anchored VWAP confirms trend strength
3. SD band rejections provide high-probability entry zones
### For Multi-Timeframe Analysis
1. Combine all three VWAPs to identify confluence zones
2. When current session VWAP aligns with previous session and anchored VWAP, expect strong support/resistance
3. Monitor distance percentage to gauge overextension
***
## ⚙️ Input Parameters
**📍 Anchored VWAP Configuration**
- `Enable Anchored VWAP` - Toggle on/off
- `Year, Month, Day, Hour, Minute` - Set your custom anchor point (requires confirmation)
**📅 Session VWAP Toggles**
- `Enable Current Session VWAP` - Toggle real-time daily VWAP
- `Enable Previous Session VWAP` - Toggle yesterday's reference VWAP
**General Settings**
- `VWAP Source` - Choose calculation source (default: HLC3)
- `Show ±1/2/3 SD` - Enable/disable each standard deviation level
**Visual Customization**
- Individual color pickers for each VWAP type and SD bands
- Line width adjustments
- `Show VWAP Labels` - Date labels at anchor points
- `Show Info Table` - Statistics dashboard toggle
- `Show SD Zones` - Background coloring beyond ±2 SD
***
## 💡 Trading Applications
✅ **Mean Reversion Trades**: Enter when price touches ±2 SD with reversal confirmation
✅ **Trend Following**: Trade in direction when price holds above/below VWAP
✅ **Institutional Levels**: Anchored VWAP reveals where large players accumulated positions
✅ **Gap Trading**: Use previous session VWAP to gauge gap fill probability
✅ **Volume Profile Analysis**: VWAP represents fair value based on actual volume traded
✅ **Support/Resistance Confluence**: Multiple VWAP alignment creates high-probability zones
***
## 🎓 Understanding VWAP
VWAP is the average price weighted by volume—representing the true average price paid by all market participants during a specific period. Unlike simple moving averages, VWAP gives more weight to price levels with higher trading volume, making it particularly valuable for:
- Institutional traders executing large orders
- Algorithmic trading systems
- Identifying fair value and overextended prices
- Minimizing market impact on large trades
***
## 📈 Chart Setup Recommendations
**Best Timeframes**: 1-minute to 15-minute charts for intraday; 1-hour to 4-hour for swing trading
**Compatible Markets**: Stocks, Indices (Nifty 50, Bank Nifty), Futures, Forex, Crypto
**Session Settings**: Works with standard daily sessions; automatically detects trading days (not calendar days)
***
## 🚀 What Makes This Indicator Unique
Unlike standard VWAP indicators that only show current session data, **Triple VWAP** provides:
- **Multi-session analysis** on a single chart without clutter
- **Historical anchoring** capability for event-driven analysis
- **Professional-grade statistics** dashboard
- **Independent customization** for each VWAP type
- **Optimized calculations** for real-time performance
***
## ⚠️ Important Notes
- **Anchored VWAP** requires manual date input (use significant market events like breakouts, earnings, trend reversals)
- **Session detection** based on daily timeframe changes—works on all chart timeframes
- **Previous Session VWAP** displays as static horizontal lines (reference only, not recalculated)
- **Standard Deviations** calculated using volume-weighted variance formula
- Works best on instruments with **consistent volume data**
***
## 📝 Credits & License
This indicator is published under **TradingView House Rules**. Code is original and follows Pine Script v6 best practices for performance and maintainability.
***
## 🤝 Support & Feedback
If you find this indicator valuable, please:
- ⭐ **Like** this publication
- 💬 **Comment** with your feedback or questions
- 🔔 **Follow** for updates and new releases
***
**Disclaimer**: This indicator is for educational and informational purposes only. Past performance does not guarantee future results. Always use proper risk management and combine with your own analysis before making trading decisions.
***
