PA Trend BUYSELLThis is PA Trend BUYSELL Indicator
Ability to Turn on/off Labels
Ability to Change Color
比特币(加密货币)

Bitcoin Price User Correlation [aamonkey]You can only use this for BTC.
Bitcoin over time tends to be priced at 7000 times the number of users (in terms of market cap).
Calculation:
Number of Wallets*7000/(Circulating Supply or 21,000,000)
Settings:
You can decide whether you want to use the Circulating Supply or 21,000,000 as a reference.
The default settings are using 21,000,000 because it seems to be more accurate.
You can easily switch between both versions by checking the box in the settings.
Interesting Findings:
Using circulating supply:
- Most of the time we are under the estimated ("PUC") line
- Once we break above the PUC line we are in the parabolic phase of the Bullrun
- In history, we broke only 4 times above the PUC
- Once we are above the PUC we see crazy growth (parabolic phase)
- We don't spend much time above the PUC
- From breaking the PUC to the new All-Time High of the cycle we took in order: 3 Days, 7 Days, 22 Days, 30 Days
- So the trend is increasing (We are taking more and more time until we see the ATH)
- Currently, we are about to break the PUC
- Then I expect the parabolic phase to begin
- I expect the run to last about 30 days

NVT (original) - Network Value to TransactionsI'm reposting the NVT indicator that was originally available for public use in TradingView.
NVT Signal is a Bitcoin-specific study to get a view on data flowing through the blockchain.
It has been used to predict tops in Bitcoin price.
I've set up this indicator for it to be possible to base the calculations on custom:
Transaction Periods
Overbought levels
Oversold levels
The indicator plots in any BTCUSD spot, futures, BLX index and BTCEUR.
It paints in intraday time frames, but Daily time frame is the correct one to interpret the 'official' read of it.
For that reason, I've enabled by default an option that forces the NVT to display the Daily value even though the time frame could be higher or lower.
Please consider unchecking this setting if you'd like to experiment with another type of reads (i.e. in weekly time frame).
Additionally, it allows the following settings:
Signal Line Plot . Added the possibility to plot a Signal Line based on EMA.
Signal Line Cross . Show/Hide Crosses with the Signal Line.
Alerts based on Signal Line . Predefined Tradingview Alerts on the Cross of the Signal Line.
OverBought Background . Highlight the background based on OB Condition.
OverBought Alert . Predefined Tradingview Alerts based on OB Condition.
OverSold Background . Highlight the background based on OS Condition.
OverSold Alert . Predefined Tradingview Alerts based on OS Condition.
Please check our blog article showing multiple practical ideas about trading the NVT indicator: medium.com
Credit for this idea goes to Willy Woo woobull.com
and Dmitry Kalichkin twitter.com

Oasis Trend StrategyThis is a simple script developed to give a quick visual of trend on any given time frame.
This is a script that gives signals of trend switches. Can be used to for buying and selling signals.
On larger time Frames we use the Aqua and Fuchsia Clouds to express the larger time frame trends.
This can be used for long term swing trades especially useful with the 4hr, 6 hr, and daily chart to cancel out all the noise within the larger trends. The smaller Blue/Red Clouds can be used within trend if you are a skillful trader.
On smaller time frames (Intraday), we used the Blue and Red intraday price action. Is meant to be used
alongside with the Aqua/Fuchsia to create short term trades decisions within the short term trends indicated by the Aqua and Fuchsia.
The 9 ema is used to keep a close eye on short term directional changes.
You would want to see if price stays above or below this level along with its price action.
This should give you initial signs of strength or weakness.
The 55 ema (Black) is used to determine larger trend directional changes and for confirmation of trend shifts.
If interested, you can learn a lot just by watching the price react to these levels and can really visualize the price action that encompasses these averages.
We recommend that all traders study Technical patterns, Price action, Financial risk management, and other pre-trade planning strategies to minimize drawdown risk.
Please give us a like and a follow if you like this indicator. Its simple and very easy to use.
We are not financial advisors. We do not give financial advise. Please use this indicator at your free will.
We are not responsible for any financial losses or claims.
If you find this indicator very useful as I have, we do appreciate any amount of tips.
This will fund us to create more indicators to be made for your use.
BTC - 3PmVmmsnuLedg7umzVkLnarKRo43g6P5Tp
ETH - 0x9a1Ba8809687D8d9A1D32Ed1602abEef48060aF1
LTC - MAgqbC6Kev1x3L2GvNwzhZacyBRxCKJ8Mi
ZCash - t1UYRLzQxeaHCNYfA9cLChfBX5mbcNqworA
0x - 0x2B07D8BFB20b6eDb9A498113764082211cdFA2cE
Many free Tradingview users can benefit from our indicators as we employ many many useful indicators that can be toggled in each script to surpass the indicator limits.

Brandon BollSecond day at Pinescript and I am attempting to tweak the Bollinger Bands directed strategy to send alerts to Zignaly in order to automate long buy/sells.
I've left in the short script though for completeness.
The buy and sell instructions work perfectly but I don't know how to do a cancel order alert (as included in the original strategy)

AntiRekt RibbonThis script is a fork of the Madrid Ribbon, the only difference is that you can color your bars depending on the trend.

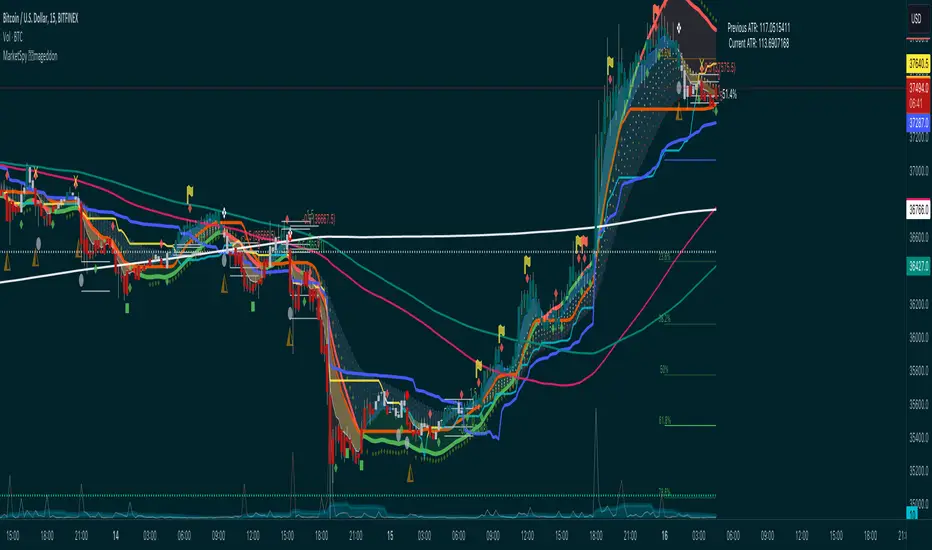
MarketSpy ARmageddonMarketSpy trading suite was designed to sniff out momentum swings and allow you to profit riding the wave. No matter what market, no matter the timeframe - this is all you need, from here on out this is your trading desk.
It's made up of three main components (with future add-ons in development):
1. MarketSpy X - the ultimate entry and exit tool that is built using custom momentum algorithm to find exact moments of reversals - without a fail. It's the one on the bottom with "green pulse dot" buy signals and "blood diamond" sell indicators.
2. MarketSpy ARmageddon (Augmented Reality) - price action overlay that analyses trends and is a confirmation tool for MarketSpy X. Can show confluence from top 5 market indicators, gives signals of reversals or chop zones, predicts prices(!) and is fully dynamic that reacts to market conditions LIVE.
3. MarketSpy S/R - This thing sniffs out and draws support and resistance based on math, not human eye. This means that MarketSpy effectively can go head to head with bots and algorithms and see right through the market to give you incredibly accurate points of interest where machines and humans sell and buy - ride the way together with the whales. Sounds cliche until you try it.
For more - visit our discord.
MarketSpy XMarketSpy trading suite was designed to sniff out momentum swings and allow you to profit riding the wave. No matter what market, no matter the timeframe - this is all you need, from here on out this is your trading desk.
It's made up of three main components (with future add-ons in development):
1. MarketSpy X - the ultimate entry and exit tool that is built using custom momentum algorithm to find exact moments of reversals - without a fail. It's the one on the bottom with "green pulse dot" buy signals and "blood diamond" sell indicators.
2. MarketSpy ARmageddon (Augmented Reality) - price action overlay that analyses trends and is a confirmation tool for MarketSpy X. Can show confluence from top 5 market indicators, gives signals of reversals or chop zones, predicts prices(!) and is fully dynamic that reacts to market conditions LIVE.
3. MarketSpy S/R - This thing sniffs out and draws support and resistance based on math, not human eye. This means that MarketSpy effectively can go head to head with bots and algorithms and see right through the market to give you incredibly accurate points of interest where machines and humans sell and buy - ride the way together with the whales. Sounds cliche until you try it.
For more - visit our discord.

BB - Study - CryptoFoudid.comHi everyone,
A new script transformed on a study from QuantNomad.
Based on the Bollinger Bands to catch the range market.
I filtered the consecutive signals to avoid a "funding" issue.
You can configure it as you want based on inputs.
The best way for crypto is to have about 45 to 55 length and 2 to 3.5 in multiplier but it's your choice :)
ENJOY !

Bitcoin Prices InfoPanelHello traders
This script is based on the great Ricardo Santos InfoPanel script
It will display all the Bitcoin prices
The script is public so you can adjust according to your own needs
PS
You might have to scroll right on your chart to see the panel
Enjoy :)
Dave

indicator StrategyBITMEX5 FOR LONG BUY2This indicator was developed for trading using RCI .
It performs well in day trading and swing trading.
* Signal conditions for long entry *
It is displayed when the short-term RCI crossovers the lowerband.
* Take profit condition *
It is displayed when the short-term RCI crossunders the lowerband.
* Optimized the entry conditions using CM_Williams_Vix_Fix created by ChrisMoody.
************************
Hello everyone!
I am very pleased with your evaluation.
This script is a masterpiece of the current stage of successful development of a technical analysis of cryptocurrencies over two years.
This has been published for cryptocurrency fans like you, but it may be closed in the near future.
If you like this indicator, please support money for my activities.
We would like to use that money as an activity cost for further indicator updates and better strategy development.
This development work is very hard and requires careful attention, but I am passionate about making them successful.
The amount of money does not matter.
The value you felt was that amount.
BTC
39LbiVReUjxX7k2gqWxQeDAVJtYfTCREzB
LTC
MVAJG4ubzugi2jxZ6P6wqXJXA3RqzmNqYK
ETH
0x7c5715b87a268993c4d78086016015b39985c835
USDC
0x7c5715b87a268993c4d78086016015b39985c835
Thank you.

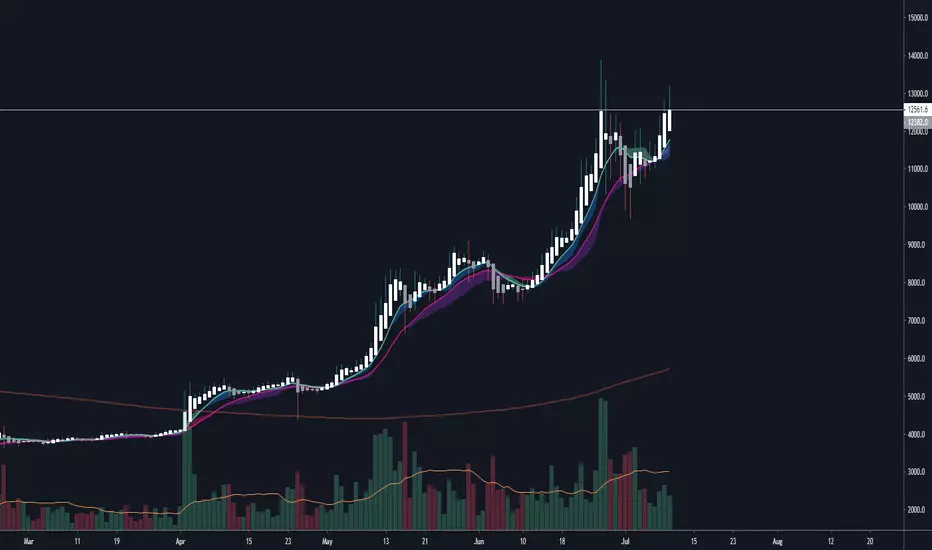
kiska cloudskiska clouds: crypto twitter's next cloud meme
Crypto is a fast-paced, highly-volatile asset, therefore, many traditional strategies are thrown out of the window when applied to cryptocurrency markets. In trading, there are only two things known for sure: price and volume. Price and volume data is then manipulated using various math equations in an effort to discover patterns and/or make predictions. kiska clouds are no different.
The kiska clouds are a simple crossover strategy. The clouds are different because of the unique averages being used and the embedded momentum indicator.
To use the clouds is simple:
When the green line crosses above the pink line, you buy/long.
When the green line crosses below the pink line, you sell/short.
The clouds are indicative of the trend's momentum. Using the power of math, the larger the cloud indicates a higher amount of buying/selling pressure. As the cloud thins, momentum is slowing, and the trend may be reversing.
At the time of testing, the strategy had a profitability of 54.55% accuracy with 1133.41% net profit. While I think this could be automated into a bot, adding a human element with stop losses and further analysis will significantly improve the accuracy/profitability.
This indicator is a "Pay What You Want" model. For a trial or to purchase this indicator, send me a message on Twitter @moonkiska or here on TradingView. You will be granted a 2-3 day trial period to the backtesting strategy.
Tips:
The higher the time frame, the more accurate the strategy.
Personally, I do not short above the 200MA. I do not long below the 200MA.
Coming Soon:
Support/Resistance
Trend Lines
Cyatophilum Scalping Bot V2 [ADVANCED SETTINGS] [ALERTSETUP]Advanced Settings version of Cyatophilum Scalping Bot V2
For people who like tweaking settings =)
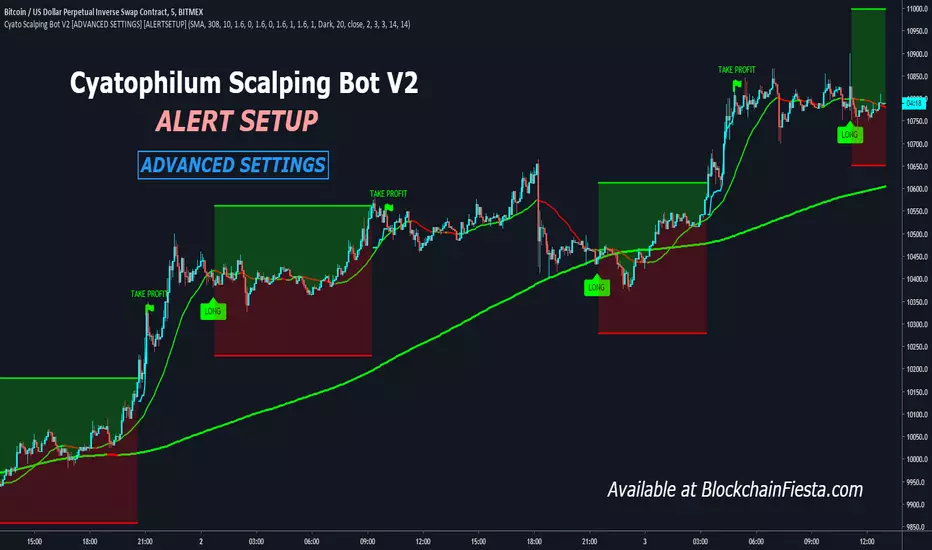
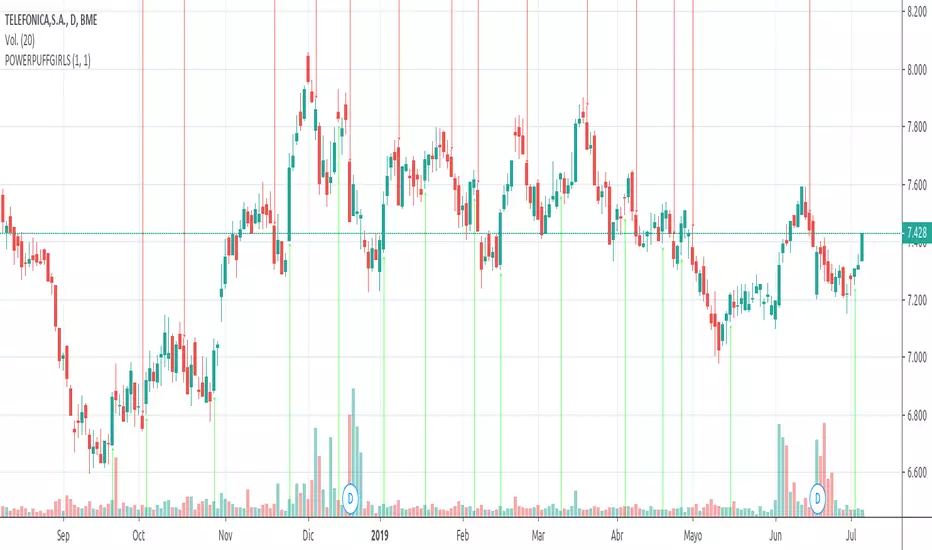
POWERPUFFGIRLS WE ARE GIRLS PROGRAMMING GREAT CODES, WE CREATE THIS INDICATOR THAT GIVE YOU THE CONTROL OVER THE ALERTS, JUST BUY IT WHEN GREEN ARROW APPEARS, AND SELL HEN THE RED ONE COMES OUT, GOOD LUCK
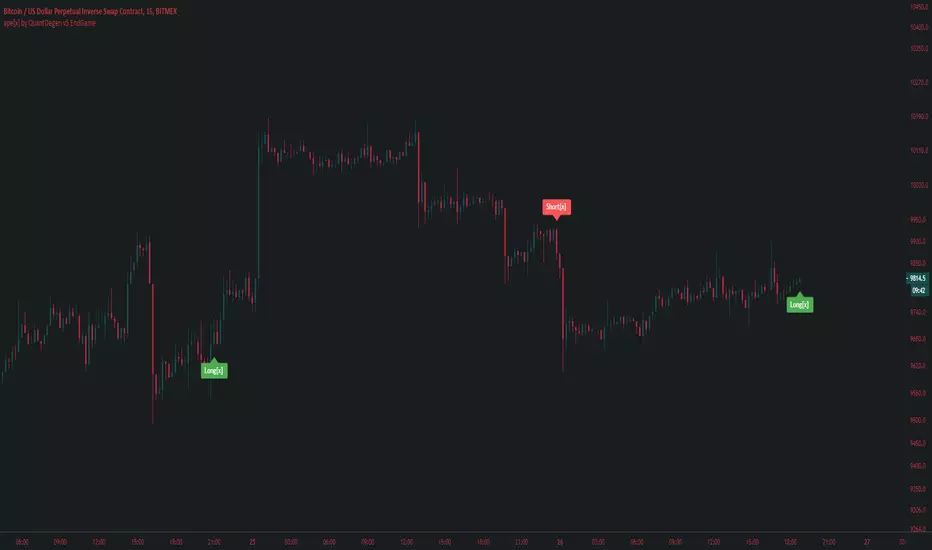
ape[x] v1.0 15minFor more info or access
Contact
Twitter : @quantdegen
Discord : Find it in twitter info.
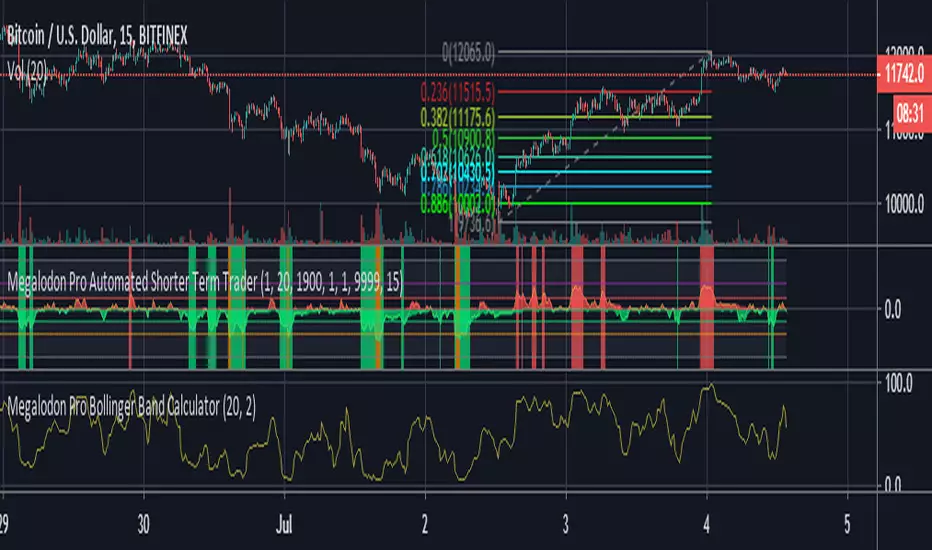
Megalodon Pro Bollinger Band CalculatorHow to use?
It ranges between 0-100. 0 is oversold, 100 is overbought.
It could be a really beneficial tool for timing your day trades in lower time frames.
It is designed for 1 minutes - 15 minutes - 30 minutes - 60 minutes - 240 minutes - 1 Day time frames.