BTC ETF Average Inflow Cost BasisConcept
Since the historic launch of Bitcoin Spot ETFs on January 11, 2024, institutional flows have become a major driver of price action. This indicator aims to visualize the aggregate Cost Basis (average entry price) of the major Bitcoin ETFs relative to the underlying asset.
It serves as an on-chain proxy for institutional positioning, helping traders identify critical support levels where ETF inflows have historically concentrated.
How it Works
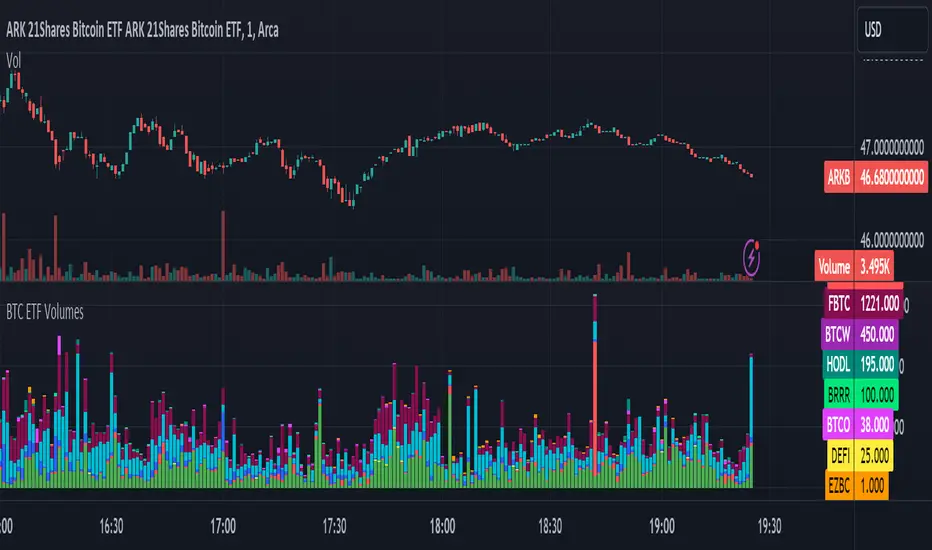
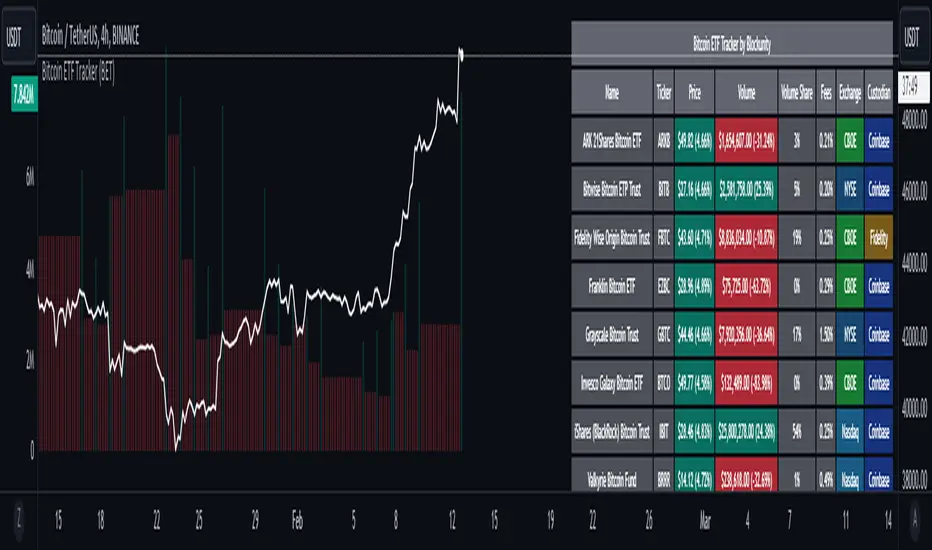
The script aggregates daily volume data from the top Bitcoin ETFs (IBIT, FBTC, ARKB, GBTC, BITB) and compares it against the Bitcoin price (BTCUSDT).
ETF Cost Basis (Pink Line):
This is calculated as a Cumulative Volume-Weighted Average Price (VWAP), anchored specifically to the ETF launch date (Jan 11, 2024).
Formula: It accumulates (BTC Price * Total ETF Volume) and divides it by the Cumulative Total ETF Volume.
This creates a dynamic level representing the "breakeven" price for the aggregate volume traded through these funds.
True Market Mean (Gray Line):
This represents the simple cumulative average of the Bitcoin price since the ETF launch date. It acts as a neutral baseline for the post-ETF market era.
How to Use
Institutional Support: The Cost Basis line often acts as a strong dynamic support level during corrections. When price revisits this level, it suggests the market is returning to the average institutional entry price.
Trend Filter:
Price > Cost Basis: The market is in a net profit state relative to ETF flows (Bullish/Trend continuation).
Price < Cost Basis: The market is in a net loss state (Bearish/Capitulation risk).
Confluence: The intersection of the Cost Basis and the True Market Mean can signal pivotal moments of trend reset.
Features
Data Aggregation: Pulls data from 5 major ETFs via request.security without repainting (using closed bars).
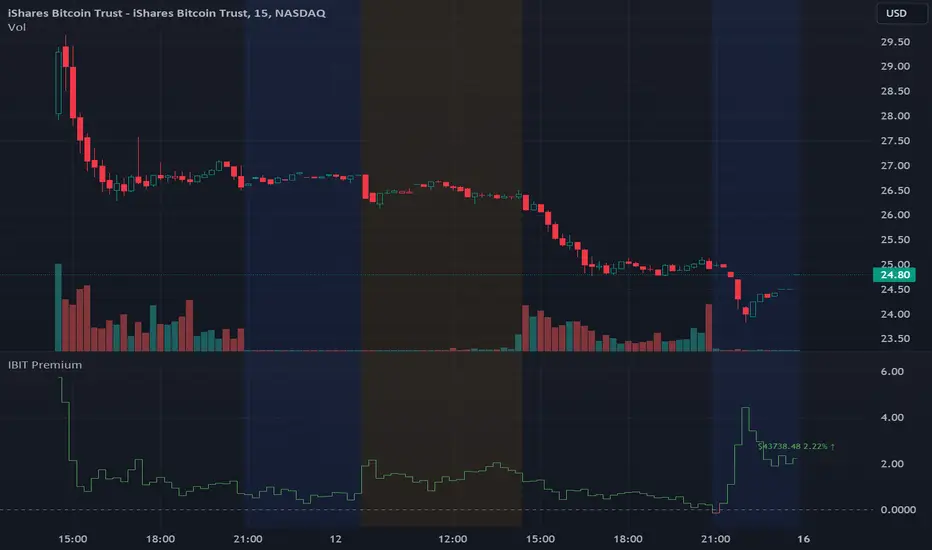
Dashboard: Includes a table in the top-right corner displaying real-time values for Price, Cost Basis, and Market Mean.
Customization: You can toggle individual ETF Moving Averages in the settings (disabled by default due to price scale differences between BTC and ETF shares).
Disclaimer
This tool is for educational purposes only and attempts to estimate institutional cost basis using volume proxies. It does not represent financial advice.
Btcetf
IBIT Premium to CoinbaseThe BTC ETF premium indicator for TradingView is a specialized tool designed to measure and visualize the premium or discount of the iShares Bitcoin Trust (IBIT), an investment vehicle that holds Bitcoin, relative to the actual price of Bitcoin on the Coinbase exchange. This indicator can be particularly insightful for traders interested in the BTC securities market and those analyzing the demand for Bitcoin as reflected by institutional investment products.
#### Description:
The BTC ETF premium indicator in TradingView leverages an advanced Pine Script algorithm to calculate the premium (or discount) percentage of IBIT compared to the spot price of Bitcoin (BTC/USD) on Coinbase. The premium is a critical insight that reflects market sentiment and potentially arbitrage opportunities between the trust's share price and the underlying cryptocurrency asset.
Here's how the indicator works:
1. **Calculation Methodology:**
- **Implied Bitcoin Price of IBIT:** We determine the implied price of Bitcoin within IBIT by dividing the IBIT closing price by the known ratio of Bitcoin per share.
- **IBIT Premium to Coinbase:** The percentage premium is then calculated as:
$$\text{IBIT Premium} = \frac{(\text{Implied Bitcoin Price of IBIT } - \text{Actual Bitcoin Price on Coinbase})}{\text{Actual Bitcoin Price on Coinbase}} \times 100$$
- This calculation is performed using the closing prices on a per-minute basis to ensure timely and accurate analysis.
2. **Visualization:** The indicator plots the premium as a step line chart, making it easy to visualize changes over time. A dynamic label accompanies the plot, displaying the implied Bitcoin price, the actual percentage premium or discount, and whether the premium is trending up or down compared to the previous day's value.
3. **Usage Scenario:** Traders can use this indicator to monitor the live premium 24/7 and analyze how it behaves during different market conditions, including when the equity market, where IBIT is traded, is closed.
#### Additional Features:
- **Color-Coding:** The premium is color-coded in green when positive (premium) and in red when negative (discount), aiding quick visual assessment.
- **Zero-Line Reference:** A horizontal line is drawn at zero to easily identify when IBIT is trading at par with the spot price of Bitcoin.
- **Real-Time Label Updates:** The label updates in real time with the latest premium/discount information and includes an arrow to signify the trend direction.
#### Access and Usage:
The indicator can be favorited or added to your TradingView charts. You are also welcome to use the source code as a foundation for further customization to suit your trading strategies.
#### Notes:
Please consider that the IBIT has specific trading hours, and the indicator can show live changes even when its market is closed, which might lead to discrepancies from official static data. For best performance, use this indicator alongside the IBIT candlestick chart on TradingView.
GBTC Premium to CoinbaseThe BTC ETF premium indicator for TradingView is a specialized tool designed to measure and visualize the premium or discount of the Grayscale Bitcoin Trust (GBTC), an investment vehicle that holds Bitcoin, relative to the actual price of Bitcoin on the Coinbase exchange. This indicator can be particularly insightful for traders interested in the BTC securities market and those analyzing the demand for Bitcoin as reflected by institutional investment products.
#### Description:
The BTC ETF premium indicator in TradingView leverages an advanced Pine Script algorithm to calculate the premium (or discount) percentage of GBTC compared to the spot price of Bitcoin (BTC/USD) on Coinbase. The premium is a critical insight that reflects market sentiment and potentially arbitrage opportunities between the trust's share price and the underlying cryptocurrency asset.
Here's how the indicator works:
1. **Calculation Methodology:**
- **Implied Bitcoin Price of GBTC:** We determine the implied price of Bitcoin within GBTC by dividing the GBTC closing price by the known ratio of Bitcoin per share.
- **GBTC Premium to Coinbase:** The percentage premium is then calculated as:
$$\text{GBTC Premium} = \frac{(\text{Implied Bitcoin Price of GBTC} - \text{Actual Bitcoin Price on Coinbase})}{\text{Actual Bitcoin Price on Coinbase}} \times 100$$
- This calculation is performed using the closing prices on a per-minute basis to ensure timely and accurate analysis.
2. **Visualization:** The indicator plots the premium as a step line chart, making it easy to visualize changes over time. A dynamic label accompanies the plot, displaying the implied Bitcoin price, the actual percentage premium or discount, and whether the premium is trending up or down compared to the previous day's value.
3. **Usage Scenario:** Traders can use this indicator to monitor the live premium 24/7 and analyze how it behaves during different market conditions, including when the equity market, where GBTC is traded, is closed.
#### Additional Features:
- **Color-Coding:** The premium is color-coded in green when positive (premium) and in red when negative (discount), aiding quick visual assessment.
- **Zero-Line Reference:** A horizontal line is drawn at zero to easily identify when GBTC is trading at par with the spot price of Bitcoin.
- **Real-Time Label Updates:** The label updates in real time with the latest premium/discount information and includes an arrow to signify the trend direction.
#### Access and Usage:
The indicator can be favorited or added to your TradingView charts. You are also welcome to use the source code as a foundation for further customization to suit your trading strategies.
#### Notes:
Please consider that the GBTC has specific trading hours, and the indicator can show live changes even when its market is closed, which might lead to discrepancies from official static data. For best performance, use this indicator alongside the GBTC candlestick chart on TradingView.
BTC ETF VolumesVolume
This script plots the trading volume of all BTC spot ETFs as well as the aggregate volume. Works on any chart and any timeframe.
Indicators
The volume of every ETF is plotted in a different color, with the total column adding up to the aggregate volume.
If you have price and indicator labels enabled you will also see individual ETF volume on your price scale on the right hand side.
If more BTC ETFs get launched I will add them.
Bitcoin ETF Tracker (BET)Get all the information you need about all the different Bitcoin ETFs.
With the Bitcoin ETF Tracker, you can observe all possible Bitcoin ETF data:
The ETF name.
The ticker.
The price.
The volume.
The share of total ETF volume.
The ETF fees.
The exchange and custodian.
At the bottom of the table, you'll find the day's total volume.
In addition, you can see the volume for the different Exchanges, as well as for the different Custodians.
If you don't want to display these lines to save space, you can uncheck "Show Additional Data" in the indicator settings.
The Idea
The goal is to provide the community with a tool for tracking all Bitcoin ETF data in a synthesized way, directly in your TradingView chart.
How to Use
Simply read the information in the table. You can hover above the Fees and Exchanges cells for more details.
The table takes space on the chart, you can remove the extra lines by unchecking "Show Additional Data" in the indicator settings or reduce text size by changing the "Table Text Size" parameter.
Upcoming Features
As soon as we have a little more history, we'll add variation rates as well as plots to observe the breakdown between the various Exchanges and Custodians.


