EHRHART Algo Premium (V.2)EHRHART Algo Premium is a indicator designed to help traders analyze market flow. It work with multiple EMA for identifying the sentiment of market. It's very simple calculation but it's a good help for people who use price action. I think the visual of the chart is very important and and I wanted to create an indicator very visual. I'm price action lover like lots of people and I personally think it's very important to identify the flow of market because buying when the flow of market is up give you better chance to win your trade. It's not BUY and SELL signal, this indicator don't tell u when u need buy or when u need sell, it's principally here for helping the visual of trading chart (have a good clear chart). I decided to post this indicator because people were asking me how it worked and were curious about these colors, so here we go !
This indicator show:
The main flow ( green candle=buy pressure /red candle=seller pressure ), it's based on two EMA cross over, this two EMA are editable so u can take the combination you want depending on your trading strategy. When the first EMA is above the second EMA candle becoming green and when the second EMA is above the first EMA candle becoming red.
The trend of two EMA crossover (blue=bullish and violet=bearish), it's based on two EMA (two different than main flow) cross over, this two EMA are editable so u can take the combination you want depending on your trading strategy. When the first EMA is above the second EMA the trend becoming blue and when the second EMA is above the first EMA the trend becoming violet.
Potential trend reversals (violet candle), it's calculate with the two EMA of the main flow, when these two EMA becoming closer, the candle becoming violet. It meaning that the trend may reversals. I added sensitivity parameter, so u can adjust it depending on your trading strategy, the more sensitive it is, the more candle will be colored violet.
A system of RSI print on the chart, when the RSI becoming overbought (more than 75) a red triangle will pop up on the chart, and when the RSI becoming oversold (less than 25) a green triangle will pop up on the chart. U can show or hidden these setting.
Bullish candles are represented by hollow candles.
Bearish candles are represented by full candles.
You can use this indicator with multiple strategy, I personally use it with price action (support/resistance) and I made it for that (but it's your choice).
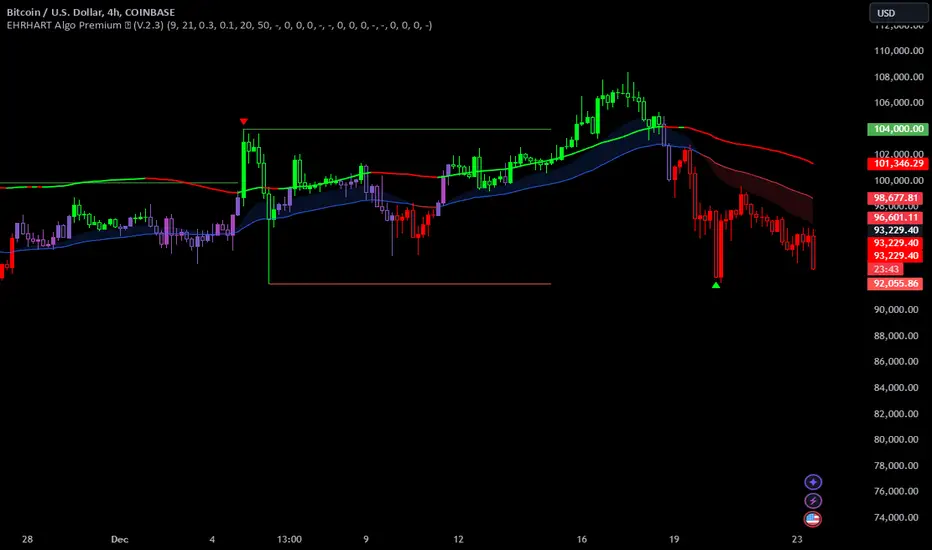
This is an example of how I'll use it:
Here we can see that the price is coming testing our weakly support, however the main flow is bullish (red candle), so I'm waiting my first signal (violet candle). When the first candle passed violet I decided to enter the trade because violet candle after red candle means that the two EMA start closed to themselves meaning that's the flow may turn green. My second signal will be candle passed green, because it meaning the two EMA start deviate from themselves, buyer are taking advantage. In this situation a green triangle on the support will be my third signal.
K线分析
Gradient Candles
The Gradient Candles indicator is crafted to be a comprehensive replacement for default candlesticks, offering users an enhanced and visually stunning alternative. To experience the intended results and fully immerse in the distinctive features of Gradient Candles, it's recommended to hide the default candlesticks. This ensures that traders can fully appreciate the unique color gradient and dynamic visual representation that this indicator brings to chart analysis.
Designed to elevate chart analysis, Gradient Candles not only offer a fresh perspective on price movements but also captivate users with their visually appealing representation of market dynamics. Departing from traditional candlestick coloration, the dynamic adaptation of colors, the 'color.from_gradient()' function plays a pivotal role in translating the current source value into a color that reflects its proximity to the highest and lowest values and corresponding colors. Beyond its analytical capabilities, Gradient Candles transform market analysis into an aesthetically enriching experience, providing traders with a unique and comprehensive tool for their technical analysis toolkit.
Traders can tailor the indicator's appearance to suit their preferences and seamlessly integrate it into their personal trading environment. From color inversion to transparency adjustments and the option to fill candles instead of outlining them, the customization features empower users to create a visual representation that aligns precisely with their unique preferences.

Wick %Heyo Fellas,
thanks for checking out my new indicator.
Introduction
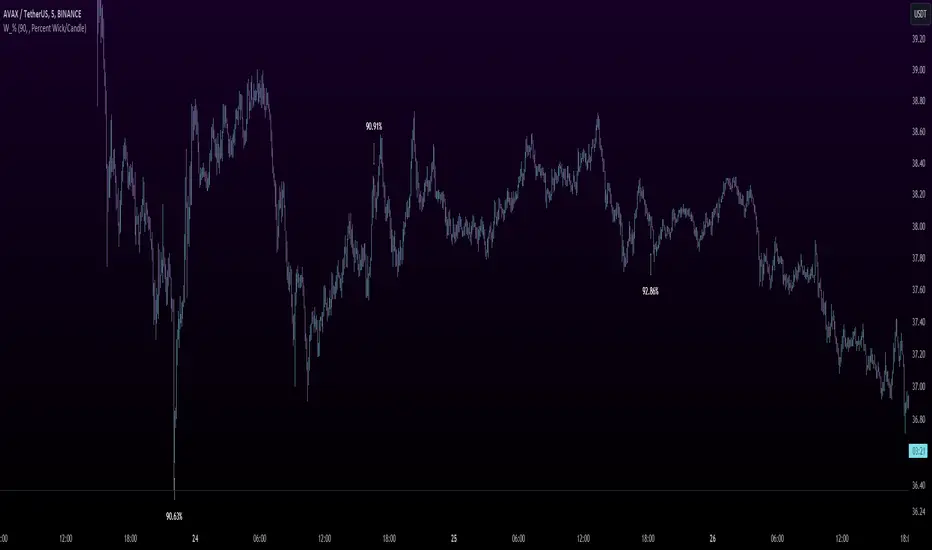
Wick % is a simple indicator to compare wick size with body size (mode 1) and to compare wick size with candle size (mode 2).
Upper wicks are bullish when close is higher than open pricen.
Lower wicks are bearish when close is lower than open price.
Wick Theory
In general, big wick and small bodie on a bar means that bull and bears are fighting heavily.
A big wick below the body means the bulls are leading in that fight,
and a big wick above the body means the bears are leading in that fight.
Calculation Formula
Mode 1 – Percentual Increase Wick/Body:
upperWickPercentage = (upperWick / body) * 100 - 100
lowerWickPercentage = (lowerWick / body) * 100 - 100
Mode 2 – Percent Wick/Candlestick:
upperWickPercentage = (upperWick / (high - low)) * 100
lowerWickPercentage = (lowerWick / (high - low)) * 100
Usage
You can use it on every symbol and every timeframe.
The indicator repaints by default, but you can disable it in the settings.
When you disable repaint, it moves the label one bar to the right.
If you want to use the indicator for signals, you must disable repainting.
Best regards,
simwai
CandleStick [TradingFinder] - All Reversal & Trend Patterns🔵 Introduction
"Candlesticks" patterns are used to predict price movements. We have included 5 of the best candlestick patterns that are common and very useful in "technical analysis" in this script to identify them automatically. The most important advantage of this indicator for users is saving time and high precision in identifying patterns.
These patterns are "Pin Bar," "Dark Cloud," "Piercing Line," "3 Inside Bar," and "Engulfing." By using these patterns, you can predict price movements more accurately and therefore make better decisions in your trades.
🔵 How to Use
Pin Bar : This pattern consists of a Candle where "Open Price," "Close Price," "High Price," and "Low Price" form the "Candle Body," and it also has "Long Shadow" and "Short Shadow." In the visual appearance of the Pin Bar pattern, we have a candle body and a pin bar shadow, where the candle body is smaller relative to the shadow.
Just as the candle body plays an important role in analysis, the pin bar shadow can also be influential. The larger the pin bar shadow, the stronger the expectation of a trend reversal.
When a "bearish pin bar" occurs at resistance or the chart ceiling, it can be predicted that the price trend will be downward. Similarly, at support points and the chart floor, a "bullish pin bar" can indicate an upward price movement.
Additionally, patterns like "Hammer," "Shooting Star," "Hanging Man," and "Inverted Hammer" are types of pin bars. Pin bars are formed in two ways: bullish pin bars have a long lower shadow, and bearish pin bars have a long upper shadow. Important: Displaying "Bullish Pin Bar" is labeled "BuPB," and "Bearish Pin Bar" is labeled "BePB."
Dark Cloud : The Dark Cloud pattern is one type of two-candle patterns that occurs at the end of an uptrend. The 2-candle pattern indicates the shape of this pattern, which actually consists of 2 candles, one bullish and one bearish. This pattern indicates a trend reversal and is quite powerful.
The Dark Cloud pattern is seen when, after a bullish candle at the end of an uptrend, a bearish candle opens at a higher level (weakly, equal, or higher) than the closing point of the bullish candle and finally closes at a point approximately in the middle of the previous candle. In this indicator, the Dark Cloud pattern is identified as "Wick" and "Strong" .
The difference between these two lies in the strictness of their conditions. Important: Strong Dark Cloud is labeled "SDC," and Weak Dark Cloud is labeled "WDC."
Piercing Line : The Piercing candlestick pattern consists of 2 candles, the first being bearish and consistent with the previous trend, and the second being bullish. The conditions of the pattern are such that the first candle is bearish and a price gap is created between the two candles upon the opening of the next candle because its opening price is below (weakly equal to or less than) the closing price of the previous candle.
Additionally, its closing price must be at least 50% above the red candle.
This means that the second candle must penetrate at least 50% into the first candle. Important: Strong Piercing Line is labeled "SPL," and Weak Piercing Line is labeled "WPL."
3 Inside Bar (3 Bar Reversal) : The 3 Inside Bar pattern is a reversal pattern. This pattern consists of 3 consecutive candles and can be either bullish or bearish. In the bullish pattern (Inside Up) formed at the end of a downtrend, the last candle must be bullish, and the third candle from the end must be bearish.
Additionally, the close price must be more than 50% of the third candle from the end. In the bearish pattern (Inside Down) formed at the end of an uptrend, the last candle must be bearish, and the third candle from the end must be bullish. Additionally, the close price must be less than 50% of the third candle from the end. Important: Bullish 3 Inside Bar is labeled "Bu3IB," and Bearish 3 Inside Bar is labeled "Be3IB."
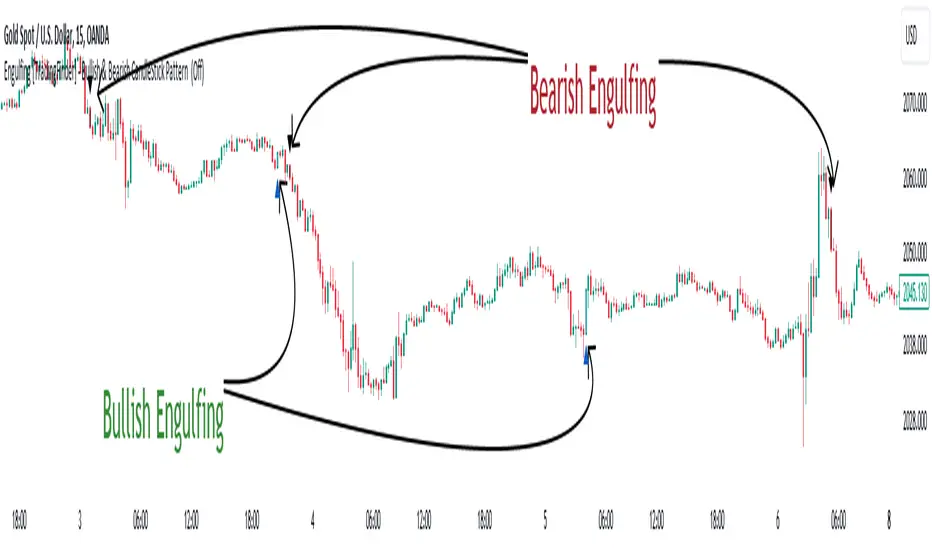
Engulfing : The Engulfing candlestick pattern is a reversal pattern and consists of at least two candles, where one of them completely engulfs the body of the previous or following candle due to high volatility.
For this reason, the term "engulfing" is used for this pattern. This pattern occurs when the price body of a candle encompasses one or more candles before it. Engulfing candles can be bullish or bearish. Bullish Engulfing forms as a reversal candle at the end of a downtrend.
Bullish Engulfing indicates strong buying power and signals the beginning of an uptrend. This pattern is a bullish candle with a long upward body that completely covers the downward body before it. Bearish Engulfing, as a reversal pattern, is a long bearish candle that engulfs the upward candle before it.
Bearish Engulfing forms at the end of an uptrend and indicates the pressure of new sellers and their strong power. Additionally, forming this pattern at resistance levels and the absence of a lower shadow increases its credibility. Important: Bullish Engulfing is labeled "BuE," and Bearish Engulfing is labeled "BeE."
🔵 Settings
This section, you can use the buttons "Show Pin Bar," "Show Dark Cloud," "Show Piercing Line," "Show 3 Inside Bar," and "Show Engulfing" to enable or disable the display of each of these candlestick patterns.

Engulfing [TradingFinder] Bullish & Bearish CandleStick Pattern🔵 Introduction
The candlestick engulfing pattern is important pattern in technical analysis that can be observed in candlestick charts. This pattern occurs when a complete candle engulfs or "engulfs" the body of a previous candle, meaning that the body of the new candle completely covers the body of the previous candle.
The candlestick engulfing pattern has two types: the bullish engulfing pattern and the bearish engulfing pattern.
• Bullish Engulfing Pattern: This pattern occurs when a market candle opens with a larger and higher body than the previous market candle and completely covers the body of the previous candle. This pattern may indicate the presence of strong buying pressure and a potential change in price direction upwards.
• Bearish Engulfing Pattern: This pattern occurs when a market candle opens with a larger and lower body than the previous market candle and completely covers the body of the previous candle. This pattern may indicate the presence of strong selling pressure and a potential change in price direction downwards.
The candlestick engulfing pattern is usually used as a valid signal for a change in price direction in the market and can enhance a combination of crossover investments and technical analysis. However, it should always be evaluated alongside other indicators and market factors, and counter decisions should be made accordingly.
🔵 Recognition Method
Correct, the candlestick engulfing pattern is one of the important patterns in technical analysis that is typically used as a strong signal for a valid change in price direction in the market. This pattern occurs when a candle (usually in the market) opens with a larger and higher (for bullish engulfing pattern) or lower (for bearish engulfing pattern) body than a previous market candle and completely covers the body of the previous candle.
Example of Bullish Engulfing Pattern:
• First Candle: A bearish (downward) candle with a small red body.
• Second Candle: A bullish (upward) candle with a larger body that completely covers the body of the previous candle.
This pattern may indicate a change in price direction from downward to upward.
Example of Bearish Engulfing Pattern:
• First Candle: A bullish (upward) candle with a small green body.
• Second Candle: A bearish (downward) candle with a larger body that completely covers the body of the previous candle.
This pattern may indicate a change in price direction from upward to downward.
The most important point is that the candlestick engulfing pattern should be carefully considered and always evaluated alongside other market indicators and overall conditions. For example, the engulfing pattern near important support or resistance levels, during significant market command changes, or accompanied by other technical signals can have greater signaling power.
🟣 "Bullish Engulfing" Candle
• The first candle is bullish and the second candle is bearish.
• At the end of a downtrend.
• The closing of the first candle is above the opening of the second candle.
• The high of the first candle is higher than the high of the second candle.
Optimal Condition:
• The closing of the first candle is higher than the high of the second candle.
• More than 80% of the first candle is bullish.
🟣 "Bearish Engulfing" Candle
• The first candle is bearish and the second candle is bullish.
• At the end of an uptrend.
• The closing of the first candle is below the opening of the second candle.
• The low of the first candle is lower than the low of the second candle.
Optimal Condition:
• The closing of the first candle is below the opening of the second candle.
• More than 80% of the first candle is bearish.
🔵 Settings
The "Engulf Filter" option allows the "Optimal Condition" to be executed and will show fewer candlesticks.
🔵 Status
Off: Default mode, showing more identifications.
• Green color indicates optimal "Bullish Engulfing" candles.
• Red color indicates optimal "Bearish Engulfing" candles.
On: By changing the default to "On," the number of identifications decreases and the optimal condition is applied.
• Blue color indicates "Bullish Engulfing" candles.
• Black color indicates "Bearish Engulfing" candles.
🟣 Important Note
"Engulfing" candles are very useful signals in the direction of the overall trend, but we do not expect a suitable movement from "Engulfing" candles against the trend.
Fetch EngulfingBuysThis script makes use of bullish engulfing candles, trend analysis, and time.
The trend is devided between an up- and downtrend. This is based on a simple cross over strategy, using the 9 and 50 moving averages.
The buys are calculated based on how many times a bullish engulfing candle was displayed on the chart during a downtrend. Bullish engulfing candles in an uptrend will never result in a buy signal.
The sells are simply based on time. This means that the script counts how many days you have been in a trade. The default is 100 candles. You can tweak this in the settings of the indicator.
Finally, this script does not provide you with any stop-losses. I am planning on releasing a v2 once I figured out what a good balance is. Also, you might notice that there are more buys than sells. This is because only the first trade in the series is tracked. V2 could improve on this flaw of the indicator.
Hope you enjoy this first iteration of the indicator.

Global Liquidity Index (Candles)The Global Liquidity Index (Candles) provides a comprehensive overview of major central bank balance sheets worldwide, presenting values converted to USD for consistency and comparability, following relevant forex rates. This indicator, based on the code developed by user ingeforberg , incorporates essential US accounts including the Treasury General Account (TGA) and Reverse Repurchase Agreements (RRP), subtracted from the Federal Reserve's balance sheet to offer a nuanced perspective on US liquidity. Users can tailor their analysis by selectively enabling or disabling specific central banks and special accounts according to their preferences. The index exclusively includes central banks abstaining from currency pegging and with reliable data accessible since late 2007, ensuring a robust aggregated liquidity model.
The calculation of the Global Liquidity Index involves subtracting the Treasury General Account (TGA) and Reverse Repurchase Agreements (RRP) from the Federal Reserve System (FED) and adding the balance sheets of major central banks worldwide: the European Central Bank (ECB), the People's Bank of China (PBC), the Bank of Japan (BOJ), the Bank of England (BOE), the Bank of Canada (BOC), the Reserve Bank of Australia (RBA), the Reserve Bank of India (RBI), the Swiss National Bank (SNB), the Central Bank of the Russian Federation (CBR), the Central Bank of Brazil (BCB), the Bank of Korea (BOK), the Reserve Bank of New Zealand (RBNZ), Sweden's Central Bank (Riksbank), and the Central Bank of Malaysia (BNM).
This tool proves invaluable for individuals seeking a consolidated perspective on global liquidity to interpret macroeconomic trends. Analyzing these balance sheets enables users to discern policy trajectories and assess the global economic landscape, providing insights into asset pricing and assisting investors in making well-informed capital allocation decisions. Historically, assets perceived as riskier, such as small caps and cryptocurrencies, have tended to perform favorably during periods of escalating liquidity. Thus, investors may exercise caution regarding additional risk exposure unless a sustained upward trend in global liquidity is evident.
Main differences between the original and updated indicators:
The "Global Liquidity Index (Candles)" script, compared to the original "Global Liquidity Index" script, offers a more detailed and visually rich representation of liquidity data.
"Global Liquidity Index (Candles)" employs candlestick visualization to represent liquidity data. Each candlestick encapsulates open, high, low, and close prices over a given period. This format provides granular insights into liquidity fluctuations, facilitating a more nuanced analysis.
By using candlesticks, the script offers traders detailed information about liquidity dynamics. They can analyze the patterns formed by candlesticks to discern trends, reversals, and market sentiment shifts, aiding in making informed trading decisions.

SMC Fake Zones + InsideBarThis indicator is useful for whom trade with "Smart Money Concept (SMC)" strategy.
It helps SMD traders to identify fake or weak zones in the chart, So they can avoid taking position in this zones.
This indicator marks "Asia session" as well as "London and New York's Lunch Time (one hour before London and NY session starts)" zones.
It also marks Inside Bar candles which SMC trades consider as order flow. You can mark every Inside Bar or only those with opposite color via setting options.
*** As we know in SMC rules
1- Supply and Demand zones in "Asia session and Lunch Times" are fake zones for SMC trading and price will engulf them in most of times.
2- "Asia session high and low" has huge liquidity and usually price sweep that in London session.
This indicator will helps traders to visually identify those Fake zones and Asia session liquidity.
* You can change session times based on your time zone in settings.
* You can set options to show all Inside Bars or only with Opposite color in settings.

Contract Size CalculatorContract Size Calculator - Overview
Description:
The "Contract Size Calculator" is an innovative Pine Script indicator designed for traders seeking to optimize their risk management through precise contract size calculations. This tool enables traders to define their risk amount in dollars and risk per point, which it then uses, in conjunction with market volatility data, to dynamically calculate the optimal number of contracts for trading positions.
Key to this calculation is the use of the Average True Range (ATR), a widely respected measure of market volatility. The indicator adjusts contract sizes based on the ATR, reflecting current market conditions and ensuring that traders' exposure aligns with their risk tolerance. It provides immediate insights into the recommended contract sizes for both long and short positions, directly on the trading chart.
Calculation Methodology:
The indicator calculates contract sizes using several steps:
Volatility Adjustment: Utilizes the ATR (with user-defined length and multiplier) to gauge market volatility.
Risk Calculation for Long and Short Positions: Determines the risk per contract by factoring in the ATR-adjusted high and low of the price, alongside the trader's specified risk per point.
Contract Size Determination: Divides the total risk amount by the calculated risk per contract to determine the number of contracts that can be traded within the set risk parameters.
This methodology ensures that traders can manage their risk effectively, adjusting their trading strategies to market conditions.
Originality and Usefulness:
What sets this indicator apart is its focus on integrating ATR-based volatility adjustments into the contract size calculation process. This approach allows for real-time, volatility-adjusted position sizing, offering:
A customizable framework for managing trading risk according to individual preferences.
Enhanced decision-making through immediate visual feedback on contract sizes.
Adaptability to changing market conditions, ensuring consistent risk exposure.
Chart Presentation:
The indicator clearly displays the calculated long and short contract sizes through color-coded plots and labels. These visual cues are designed to be easily interpretable, allowing traders to quickly assess their position sizing options without overwhelming the chart with excessive information.
Disclaimer:
This tool is provided for informational and educational purposes only and should not be considered financial advice. Users are encouraged to perform their own analysis and consult with a professional advisor as needed. The developers assume no responsibility for any trading losses incurred by using this indicator.
VSA Volume Spread AnalysisVolume Spread Analysis with Trend Direction is an indicator designed to Identify trend based volume spread.
Volume
Spread
Trend
This is a very simple yet powerful to identify Trend and corresponding volume Breakout. Unlike other Volume Indicators this indicator detects Breakout along with trend direction. One can detect the Early breakout in volume using this indicator. The Buy or Sell Signal is based on zero crossing of the Histogram.
Trend direction is confirmed using the MA of the Histogram which is similar to the Volume MA on volume indicator. One can enter a trade using the indicator when Trend direction and histogram are in same direction. Entry is done when ever histogram crosses the Trend MA line.
Fake entries can be eliminated by changing the indicator to higher Timeframe.
Spread is determined using the difference in open and close of the candle
Volume change is determined using the ratio of change of volume to previous volume
EMA 10 is used to determine the Spread and multiplied by volume change so the
PRICE(ema10), Volume, Spread(close-open) are merged to one indicator.
Direction changes when ever difference of VSA is positive or negative.

Pattern indicatorRules are pretty simple for this indicator .we are searching candlestick pattern on current day high and low ..
*** Candlestick we are looking for ***
1) Bullish/Bearish Engulfing 2) Bearish/Bullish Harami 3)Hammer/Inverted Hammer
Rule for searching bullish candlestick ====>
1) searching for current day high and day low
2) looking for candlestick as Bullish Engulfing or Bullish Harami or Hammer
3) if we got both rule 1 and rule 2 we are getting label ex- bullish engulfing
4) we can Enable/Disable Candlestick we don't want to search
Rule for bearish candles ====>
1) searching for current day high and day low
2) looking for candlestick as Bearish Engulfing or Bearish Harami or inverted hammer
3) if we got both rule 1 and rule 2 we are getting label ex- bullish engulfing
4) we can Enable/Disable Candlestick we don't want to search
Note -- i have created all indicator calculation ....
Disclaimer: market involves significant risks, including complete possible loss of funds. Consequently trading is not suitable for all investors and traders. By increasing leverage risk increases as well.With the demo account you can test any trading strategies you wish in a risk-free environment. Please bear in mind that the results of the transactions of the practice account are virtual, and do not reflect any real profit or loss or a real trading environment, whereas market conditions may affect both the quotation and execution

Tops & Bottoms - Day of Week Report█ OVERVIEW
The indicator tracks when the weekly tops and bottoms occur and reports the statistics by the days of the week.
█ CONCEPTS
Not all the days of the week are equal, and the market dynamic can follow through or shift over the trading week. Tops and bottoms are vital when entering a trade, as they will decide if you are catching the train or being straight offside. They are equally crucial when exiting a position, as they will determine if you are closing at the optimal price or seeing your unrealized profits vanish.
This indicator is before all for educational purposes. It aims to make the knowledge available to all traders, facilitate understanding of the various markets, and ultimately get to know your trading pairs by heart (and saving a lot of your time backtesting!).
USDJPY tops and bottoms percentages on any given week.
USDJPY tops and bottoms percentages on up weeks versus down weeks.
█ FEATURES
Custom interval
By default, the indicator uses the weekly interval defined by the symbol (e.g., Monday to Sunday). This option allows you to specify your custom interval.
Weekly interval type filter
Analyze the weekly interval on any weeks, up weeks, or down weeks.
Configurable time range filter
Select the period to report from.
█ NOTES
Trading session
The indicator analyzes the days of the week from the daily chart. The daily trading sessions are defined by the symbol (e.g., 17:00 - 17:00 on EURUSD).
Extended/electronic trading session
The indicator can include the extended hours when activated on the chart, using the 24-hour or 1440-minute timeframe.
█ HOW TO USE
Plot the indicator and navigate on the 1-day or 24-hour timeframe.
Hamilton - Wick Length PredictionWick Length Prediction is a Pine Script indicator crafted to empower traders by predicting the potential length and direction of the next candle's wick based on historical price action. By analyzing previous candles' wick sizes, this tool provides valuable foresight into future price dynamics, enhancing decision-making for traders.
Key Features:
Wick Percentage Analysis : Calculates the percentages of the upper and lower wicks from the previous candle relative to its total range, offering a predictive insight into the next wick’s potential direction and size.
Directional Bias Indicator : Identifies the longer wick between the previous candle's upper and lower wicks to suggest a directional bias—green indicates an upward prediction, while red suggests downward.
Targeted Plotting : Marks a horizontal line at the anticipated wick position for the forthcoming candle, aiding traders in identifying potential price rejection zones ahead of time.
Strategic Insights for Traders:
Understanding Market Pressure : Recognizes that wicks typically indicate pressure in the opposite direction of their occurrence, presenting potential targets for price movement towards the opposite side. This insight is invaluable for identifying reversal zones or continuation patterns.
Optimal for Scalping : Especially beneficial for scalpers, this tool helps in pinpointing precise entry and exit points by forecasting where the price might face opposition and potentially reverse or absorb the wick.
Timeframe Flexibility : While best suited for higher timeframes, it also delivers on lower timeframes during aggressive market movements, making it a versatile addition to your trading arsenal.
Application Tips :
Leverage in combination with other indicators and support/resistance levels to refine your trading strategy.
Ideal for enhancing price action analysis, providing a clearer understanding of potential market movements.
Use as a strategic complement to your existing approach, mindful of its predictive nature to inform better trading decisions.
Disclaimer: Trading involves significant risk. This tool aims to support a diversified trading strategy, but it's crucial to perform your own analysis and adopt appropriate risk management practices.

Institutions vs. Crypto Whales Spot BuyingBased on analysis from @tedtalksmacro, I have put together a similar tool that helps to visualise whether institutions (Coinbase and Deribit) or native crypto whales (Binance and Bitfinex) are leading the BTC spot buying.
This is plotted as the normalised relative difference (-1 and 1) between the average of Coinbase and Deribit spot price versus Binance and Bitfinex. If positive (i.e. green bar), institutions are trading at a premium; if negative (i.e. red bar), crypto whales are trading at a premium.
For example, if crypto whales are trading at a premium and price is increasing, then they are leading the buying relative to institutions. However, if whales are trading at a premium and price is decreasing, then it is likely institutions are selling off at a more rapid rate relative to the crypto whales buying pressure. This applies to the alternate scenario where institutions are trading at a premium to crypto whales.
In recent times, native crypto whales (largely Binance) drove the push from 40 to 48k, but then also marked the local top with a major sell off at this price. Institutions then took over buying at the most recent lows, driven largely by GBTC outflows slowing down and Blackrock daily inflows exceeding Grayscale outflows for the first time late last week.
Up Weeks (William O'Neil)The indicator draws boxes when close to close returns are positive for at least a specified number of bars. The last bar is only included in the box (if positive) after the market is closed, to avoid false positives.
The standard use (by William O'Neil) is on weekly charts, using at least five consecutive up bars to define a box (indicating strong institutional buying activity).
Options:
* minimum number of up bars to form a box
* include flat bars (zero return) in the up count
* add labels to top and bottom box levels, as shown in the sample chart
Candlesticks Patterns [TradingFinder] Pin Bar Hammer Shooting🔵 Introduction
Truly, the title "TradingView" doesn't do justice to this excellent website, and that's why I've written about its crucial aspect. In this indicator, the identification of all candlesticks known as "Pin bars" is explored.
These candlesticks include the following:
- Hammer : A Pin bar formed at the end of a bearish trend, with its body being either bearish or bullish.
- Shooting Star : Formed at the end of a bullish trend, with its body being either bearish or bullish.
- Hanging Man : Formed during an upward trend, characterized by a candle with a lower shadow.
- Inverted Hammer : Formed during a downward trend, characterized by a candle with an upper shadow.
🟣 Important : For ease of use, we refer to these four candlestick patterns as Pin Bars and categorize them into the main friends "Bullish" and "Bearish."
🟣 Important : In all sources, Hanging Man and Inverted Hammer are referred to as "Reversal candles." However, in reality, whenever they appear after breaking a significant area (Break Out), we expect these candles to signal a continuation of the trend and confirmation in the direction of the trend.
🟣 Important : One of the best signs of market manipulation and entry by market giants is the "Ice Berg." So, it provides one of the best trading opportunities.
🔵 Reason for Creation
Many traders, especially volume traders, use Pin bars as confirmation and enter the market after their occurrence. In this indicator, all four patterns are identified and displayed in a colored candle format, using "triangle" and "circle."
When they are evident on the chart, directly or by drawing a horizontal line, they give us good alerts for reversal or continuation areas.
🔵 Information Table
1. Red circle: Pin bars formed in a downtrend.
2. Blue circle: Bullish Pin bars formed in an uptrend.
3. Black triangle: Bearish Pin bar candle in an uptrend.
4. Blue triangle: Bullish Pin bar candle in a downtrend.
🔵 Settings
Trend Detection Period: A special feature that considers smaller or larger fluctuations. If individual price waves need to be considered, use lower numbers; if the overall trend direction is desired, use larger numbers (e.g., 5-7 or higher). This precisely sets the Zigzag or Pivot format, not displayed but considered in the indicator calculation.
Trend Effect : By changing the Trend Effect status to "Off," all Pin bars, whether bullish or bearish, are displayed regardless of the current market trend. If the status remains "On," only Pin bars in the direction of the main market trend are shown.
🟣 Important : Black triangles "Number 3" and blue triangles "Number 4" displayed in the information table section, as explained in the "Information Table" section.
Show Bullish Pin Bar : When set to "Yes," displays bullish Pin bars; when set to "No," does not display them.
Show Bearish Pin Bar : When set to "Yes," allows the display of bearish Pin bars; when set to "No," does not display them.
Bullish Pin Bar Setting : Using the "Ratio Lower Shadow to Body" and "Ratio Lower Shadow to Higher Shadow" settings, you can customize your bullish Pin bar candles. Larger numbers impose stricter conditions for identifying bullish Pin bars.
Bearish Pin Bar Setting : Using the "Ratio Higher Shadow to Body" and "Ratio Higher Shadow to Lower Shadow" settings, you can customize your bearish Pin bar candles. Larger numbers impose stricter conditions for identifying bearish Pin bars.
Show Info Table : Allows the display or non-display of the information table (located at the bottom of the page and on the right side).
🔵 How to Use
At the end of a downtrend, look for "Hammer" candles, easily identified one by one.
To identify the "Shooting Star" candle pattern at the end of an uptrend; expect a price reversal in the downtrend.
For trades in the downward direction, wait for the formation of an "Inverted Hammer" Pin bar.
And finally, in an uptrend, where a "Hanging Man" candle can form.
🔵 Features
For better visualization, triangles and circles are used above the candles, but they can be easily removed. All Pin bars are displayed in color with the following meanings:
- Black-bodied candle: Inverted Hammer
- Turquoise blue candle: Hammer
- Pink candle: Hanging Man
- Red candle: Shooting Star
🟣 Important : The capability to detect the powerful two-candle pattern "Tweezer Top" at the end of an uptrend emerges by forming two "Shooting Star" candles side by side.
Similarly, the two-candle pattern "Tweezer Bottom" is created at the end of a downtrend with the formation of two "Hammer" candles side by side. To identify the "Tweezer" pattern, make sure the settings in the "Trend Effect" section are set to "Off."
🟣 Auxiliary Indicators
During the start of trading sessions such as Asia, London, and New York, where the highest liquidity exists, alongside this indicator, you can use the Trading Sessions indicator.
Sessions
The combination of Order Blocks "-OB" and "+OB" with candles is one of the best trading methods. The indicator that identifies order blocks, along with this indicator, can yield remarkable results in the success of Pin bar candles.
Order Blocks Finder
The trading toolset "TFlab" presents this indicator. To benefit from all indicators, we invite you to visit our page " TFlab Scripts ".

Diamond Grids @shrilssUncover hidden patterns and potential reversal zones with the Diamond Grids Indicator. This script introduces a unique approach to visualizing price extremes within a specified range, aiding traders in identifying critical support and resistance levels. The indicator dynamically calculates and displays diamond-shaped grids based on user-defined short and long lengths and ATR. Utilize this powerful tool to enhance your technical analysis and gain insights into potential trend reversals.
Key Features:
- Dynamic Grid Calculation: The indicator dynamically calculates and plots diamond-shaped grids based on specified short and long lengths. These grids represent key price extremes within the defined range.
- Multi-Level Support and Resistance: Each diamond grid consists of multiple support and resistance lines, providing a comprehensive view of potential reversal zones. Traders can use these levels to make informed decisions.
- Customizable Parameters: Tailor the indicator to your trading style with customizable parameters such as short length, long length, and a multiplier. Adjust these settings to align the indicator with your unique preferences.
- Real-Time Updates: The indicator updates in real-time, ensuring that traders have the latest information on potential reversal zones. Stay ahead of market movements and make timely decisions.
- Toggle Trend Visualization: Diamond-shaped grids are color-coded for easy interpretation. Positive and negative grid lines are distinctly marked, offering a clear visual representation of the overall trend.
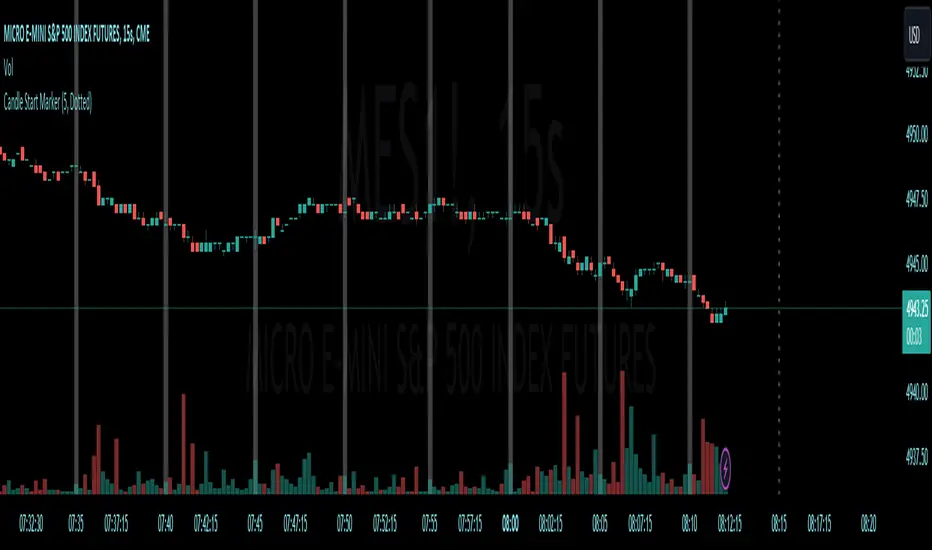
[CS] HTF Candle Start MarkerHello Traders!
I was using this script personally and thought it may be helpful to others that trade much lower timeframes. This script is particularly useful for traders who monitor price movements across multiple timeframes or need to synchronize their strategies with the start of new candle open.
Features:
User-Selectable Timeframe : Users can select the desired timeframe for the candle start marker, ranging from 1 to 60 minutes.
Start-of-Period Visualization : The indicator works by highlighting the background color at the start of each new candle for the chosen timeframe. This visual cue is particularly helpful for identifying the commencement of new trading intervals on lower timeframe charts.
Intelligent Timeframe Adaptation : A unique feature of this indicator is its ability to disable the marking on charts where the selected timeframe is equal to or higher than the chart's current timeframe. This ensures that the marker is only active when it provides meaningful information, avoiding redundancy on higher timeframe charts.
Usage:
This indicator is ideal for low time frame traders and those employing multi-timeframe analysis. It helps in quickly identifying the start of new time intervals. For example I trade the 15 second timeframe and mark the start of every 5 minute candle.
Candle Color By OHLC ComparisonThis indicator is designed to help you recognize the price movements within a candle/bar more quickly and easily. Typically, candle coloring is based on the opening and closing prices, but in this indicator, I followed the OHLC values in reverse order: starting with closing, low, high, and then opening. Each of these is compared with the value in the previous candle. I assigned the least importance to the opening, hence did not include it in the color determination. To make the colors memorable, I used a rainbow-like color scale; with purple representing the highest value and maroon the lowest. You can also change the colors if you wish. Additionally, if you want to set alarms, I assigned values to the candles; the highest being 16 and the lowest 1. A thicker barchart provides a better visual representation.
For instance, consider the monthly chart of the NASDAQ 100. After a prolonged positive trend, when our indicator shows a negative maroon bar (representing a low value) for the first time, it could signal a change in the trend direction. In this scenario, the appearance of the maroon bar serves as a crucial alert for investors to review their current positions or prepare for a potential downtrend. This indicator provides users with a significant advantage in identifying such critical turning points and assists them in quickly adapting to market dynamics.

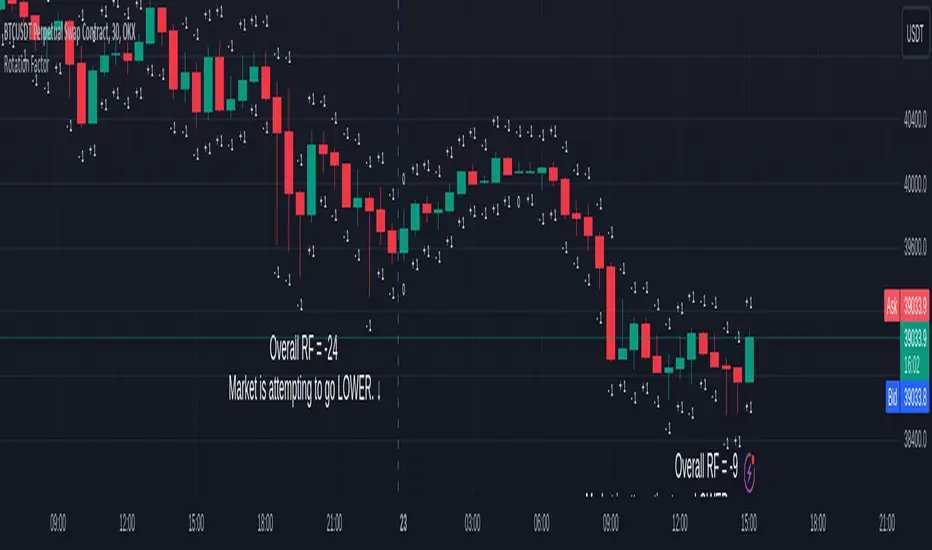
Rotation Factor for TPO and OHLC (Classic)The Rotation Factor objectively measures attempted market direction(or market sentiment) for a given period. It records the cumulative directional attempts of auction rotations within a given period, thus, helping traders determine which way the market is trying to go and which market participant is exerting greater control or influence.
Theory
The premise is that a greater number of bars auctioning higher contrasted to bars auctioning lower indicates that buyers are exerting greater control over price within the given period(usually daily). In this case, the market is attempting to go higher (Market is Bullish). The same is true for a greater number of bars auctioning lower than higher, which, in this case, indicates that the sellers are exerting greater control over price within the given period and that the market is attempting to go lower (Market is Bearish).
Calculation
Each bar is individually measured in relation to the immediate previous bar, and calculations are reset at the beginning of each period.
For every bar, two variables are utilised: One for the highs and another for the lows. During bar start, these variables are initiated at 0.
As the period progresses, these variables are set accordingly: If the high of the current bar is higher than that of the previous bar, then the bar's highs variable is assigned a "+1". If the opposite is true, it is given a "-1". Finally, if both bar highs are equal, it is, instead, assigned a "0". The same is true for the lows: if the low of the current bar is higher than that of the previous low, then the bar's lows variable is assigned a "+1". Similarly, the opposite is given a "-1", while equal lows causes it to be assigned a "0". All highs and lows are then summed together resulting to a total, which becomes the Rotational Factor.
Presentation
Furthermore, this Rotation Factor Indicator is presented as it is calculated, which is the presentation utilised by classic sources (hence the name classic).
Features
1. Customisable Tick Size/Granularity : The calculation tick size/ granularity is customisable which can be accessed through the indicator settings.
2. Customisable Labels : The colour and sizes used by the labels are customisable the better for accessibility.
3. Period Separator : A separator is rendered to represent period borders (start and end). If separators are already present on your chart, you can remove them from the indicator settings.
Works for both split Market Profile(TPO) charts and regular OHLC bars/candle charts
The Rotation Factor is usually used with a Split Market Profile (TPO). However, if no such tool is available, you will still be able to benefit from the Rotation Factor as the price ranges of Split Market Profiles and OHLC bars/candles are one and the same. In such cases, it is recommended that you set your chart to use a 30 minute timeframe and the indicator's period to "daily" to simulate a Split Market Profile.
Note :
The Rotation Factor is, to quote, "by no means not an all-conclusive indication of future market direction.". It only helps determine which way the market is trying to go by objectively measuring the market's directional attempts.
Pin Bar, Inside Bars and Engulfing Candle SticksIntroducing the Candlestick Pattern Plotter, a comprehensive TradingView indicator designed to elevate your technical analysis by automatically identifying and plotting three essential candlestick patterns – Pin Bars, Engulfing Candles, and Inside Bars. This powerful tool equips traders with a holistic view of market dynamics, enabling them to make informed decisions based on key price action signals.
Pin Bar Identification:
The indicator adeptly recognizes Pin Bars, a pivotal candlestick pattern characterized by a small body and a long wick in the opposite direction of the prevailing trend.
Pin Bars are instrumental in signaling potential trend reversals or continuations, providing crucial insights for strategic decision-making.
Engulfing Candle Detection:
Identify Engulfing Candles effortlessly with this indicator, showcasing instances where the body of one candle fully engulfs the body of the previous candle.
Engulfing Candles serve as powerful reversal indicators, offering valuable insights into shifts in market sentiment and potential trend reversals.
Inside Bar Recognition:
The indicator goes beyond traditional patterns by identifying Inside Bars, where the range of a candle is entirely within the previous candle's high and low.
Inside Bars often signify consolidation or a period of indecision in the market, providing traders with crucial information about potential breakouts or reversals.
Seamlessly integrate the Candlestick Pattern Plotter into your TradingView chart, enjoying a user-friendly interface for swift interpretation of candlestick patterns.
Toggle the display of Pin Bars, Engulfing Candles, and Inside Bars on and off with ease, allowing you to focus on the specific patterns most relevant to your analysis.
Real-Time Alerts:
Stay ahead of the market with real-time alerts that notify you when a Pin Bar, Engulfing Candle, or Inside Bar is identified on the chart.
Timely notifications keep you informed, ensuring you never miss a potential trading opportunity based on these crucial candlestick patterns.
Enhance your trading strategy with the precision of Pin Bars, Engulfing Candles, and Inside Bars, seamlessly integrated into your analysis through the Candlestick Pattern Plotter. Gain a comprehensive understanding of market movements and make well-informed decisions in real-time.
Advanced Engulfing CandlesThere are a plenty of Engulfing candle detecting indicators but every single of them detect engulfing candles engulfed by only single candle but sometime it take more then one candle to engulf the previous opposite candle, which is also considered as engulfing candle.
So this script show both type of candles.
Type of Engulfing Candles
Normal Engulfing Candles
Candle engulfed by more then one continuous candle
I hope you will like it.
If you find any bugs or have any suggestions for any possible addition feel free to comment or DM me.

PinBar and Bloom Pattern Concept (Zeiierman)█ Overview
The Precision PinBar and Bloom Pattern Concept by Zeiierman introduces two new patterns, which we call the Bloom Pattern and the Precision PinBar Pattern. These patterns are used in conjunction with market open, high, and low values from different periods and timeframes. Together, they form the basis of the "PinBar and Bloom Pattern Concept." The main idea is to identify key bullish and bearish candlestick patterns around key levels plotted on the chart.
The key levels are the Open, High, and Low from the current and previous periods of the selected timeframe. Users can choose how many previous periods to be drawn on the chart.
█ How It Works
The indicator operates by analyzing market data over selected timeframes. It uses inputs such as previous period open-high-low lines, timeframe selections, and pattern detection settings like Symmetry Precision and Range Threshold. These parameters allow the indicator to identify specific market conditions, including symmetrical movements in price and significant price range deviations, which form the basis of the Bloom and Precision PinBar patterns.
Symmetry Signal:
Purpose: To detect symmetry in price movements based on a precision threshold.
How It Works: This function calculates the symmetry of high and low prices within the specified precision. It returns two boolean values indicating whether the high and low prices are within the symmetry precision.
BaselineBound Pattern:
Purpose: To identify bullish or bearish patterns based on a range factor.
How It Works: The function calculates whether the current close price is within a certain range of the high-low difference of the previous period. It returns bullish and bearish signals based on these calculations.
█ ● Bloom Pattern
The Bloom Pattern is a unique candlestick pattern designed to identify significant trend reversals or continuations. It's not a single candlestick formation but a combination of a few elements that signal a potential strong move in the market.
⚪ Previous and Current Candle Analysis: The Bloom Pattern looks at the relationship between the current candle and the previous one. It checks whether the current candle's body (the range between its opening and closing prices) fully encompasses the body of the previous candle. This condition is known as "embodying."
⚪ Baseline Bound: The Baseline Bound concept involves comparing the closing price to a range established by the high and low of the previous candle, adjusted by a factor (the rangeFactor). This helps in identifying if the current price is showing a bullish or bearish tendency relative to the previous period's price movement.
⚪ Symmetry Signal: Additionally, it uses the Symmetry Signal, which measures the symmetry between the high and low prices of two consecutive candles.
⚪ Bullish and Bearish Signals: The combination of these conditions (embodying, baseline bound, and symmetry) results in either a bullish or bearish signal. A bullish signal suggests a potential upward trend, while a bearish signal indicates a possible downward trend.
█ ● Precision PinBar Pattern
The Precision PinBar Pattern is a refined version of the traditional Pin Bar, a well-known candlestick pattern used in trading. This pattern focuses on identifying market reversals with a high degree of accuracy.
⚪ Identification of Pin Bars: The function first identifies a pin bar, characterized by a small body and a long wick. The long wick indicates a rejection of certain price levels, and the small body shows little change between the opening and closing prices.
⚪ Tail and Body Length Analysis: The script calculates the length of the bar's tail (wick) and compares it to the length of the body. A qualifying pin bar typically has a tail at least three times longer than its body, suggesting a strong rejection of prices.
⚪ Positioning and Thresholds:
Open-Close Position: The function checks whether the opening and closing prices are within a certain threshold of the high or low of the bar, which helps in distinguishing between bullish and bearish pin bars.
⚪ Baseline Bound and Symmetry: Like the Bloom Pattern, it incorporates Baseline Bound and Symmetry Signal concepts to validate the significance of the pin bar.
⚪ Bullish and Bearish Signals: Depending on these factors, a bullish or bearish pin bar is identified. A bullish PinBar suggests potential upward price movement, while a bearish PinBar indicates possible downward price movement.
█ How to Use
Using the Bloom and Precision PinBar patterns in conjunction with key market levels, such as previous highs and lows, can be a powerful strategy for traders. These market levels often act as significant points of support and resistance, and combining them with the patterns can offer strong trade signals. Here's how traders can effectively utilize these patterns:
Identifying Key Market Levels
Previous Highs and Lows: These are the highest and lowest points reached in previous trading periods and are often considered strong levels of resistance (in the case of previous highs) and support (in the case of previous lows).
Using the Bloom Pattern
Near Previous Highs (Resistance): If a Bloom Pattern emerges near a previous high, it could indicate a potential bearish reversal. Traders might interpret this as a signal to consider short positions, especially if the pattern shows bearish characteristics.
Near Previous Lows (Support): Conversely, a bullish Bloom Pattern near a previous low could suggest a trend reversal to the upside. This could be a signal for traders to consider long positions.
Using the Precision PinBar Pattern
Precision PinBar at Resistance: A bearish Precision PinBar appearing near a previous high can be a strong signal for a potential downward move. This setup is often used by traders to enter short positions, anticipating a price rejection at this resistance level.
Precision PinBar at Support: Similarly, a bullish Precision PinBar at or near a previous low suggests that the market is rejecting lower prices, indicating potential upward momentum. This is typically used by traders as a cue to go long.
█ Settings
Previous Open-High-Low Lines: Determine the number of historical periods to analyze. Settings include toggling the visibility of lines and labels and specifying the number of periods.
Timeframe & Current Period: Select the timeframe for current market analysis. Options include different timeframes (e.g., 1H, 1D) and customization of line styles and colors.
Pattern Settings: Adjust the Symmetry Precision and Range Threshold to fine-tune the indicator's sensitivity to specific market movements.
Bloom & Precision PinBar Pattern: Enable or disable the detection of specific patterns and customize the visual representation of these patterns on the chart.
-----------------
Disclaimer
The information contained in my Scripts/Indicators/Ideas/Algos/Systems does not constitute financial advice or a solicitation to buy or sell any securities of any type. I will not accept liability for any loss or damage, including without limitation any loss of profit, which may arise directly or indirectly from the use of or reliance on such information.
All investments involve risk, and the past performance of a security, industry, sector, market, financial product, trading strategy, backtest, or individual's trading does not guarantee future results or returns. Investors are fully responsible for any investment decisions they make. Such decisions should be based solely on an evaluation of their financial circumstances, investment objectives, risk tolerance, and liquidity needs.
My Scripts/Indicators/Ideas/Algos/Systems are only for educational purposes!
