Wickless Candle Revisit TrackerWickless Candle Revisit Tracker
Identifies wickless candles (strong momentum candles) and tracks whether price revisits their opening level, providing statistical insights into price behavior patterns.
WHAT ARE WICKLESS CANDLES?
• Green wickless: Open = Low (no lower wick) - opened at the low and moved only upward
• Red wickless: Open = High (no upper wick) - opened at the high and moved only downward
These candles represent strong directional momentum, and their opening levels often act as support/resistance zones that price may revisit.
KEY FEATURES:
• Automatic Detection: Identifies wickless candles with configurable tolerance for broker spread
• Real-time Tracking: Monitors each wickless candle until price revisits its opening level
• Visual Indicators:
- Labels show "WL↑" or "WL↓" with bars count when revisited (or "N/A" if pending)
- Horizontal lines mark price levels (gray dashed = pending, green solid = revisited)
• Comprehensive Statistics Table:
- Total wickless candles detected
- Revisit rate percentage
- Min/Max/Average bars until revisit
- Pending count
• History Limit: Configure how far back to analyze (default: 500 bars)
• Customizable: Adjust colors, toggle labels/lines/table, reposition statistics
USE CASES:
• Identify potential support/resistance levels from momentum candles
• Measure how often price fills "fair value gaps" or inefficiencies
• Track mean reversion patterns after strong momentum moves
• Backtest the reliability of wickless candle levels as trading zones
SETTINGS:
• Wick Tolerance: Allow small wicks due to broker spread (e.g., 0.0001 for forex)
• History Limit: Number of bars to analyze (older candles are hidden)
• Visual Controls: Toggle labels, lines, and statistics table
• Color Customization: Adjust line colors for pending/revisited states
ALERTS:
Built-in alerts for wickless candle detection (green, red, or both).
Perfect for traders analyzing price inefficiencies, fair value gaps, and momentum-based support/resistance levels.
Candlestick analysis

True ADR% (Range/Close) / ATR / LoD dist. / Market CapHi guys
Couldn't find the script of my dreams and therefore adapted some existing ones I found from the users MikeC (AKA TheScrutiniser) & armerschlucker.
Notes on formulas used in this script:
// ADR% is calculated using the standard definition: 100 * SMA(High - Low, N) / Close
// (average daily range in points over N daily bars, normalized by the current daily close).
// ATR is standard Wilder ATR: ta.atr(N) computed on daily bars.
// LoD dist. is the distance from current close to today’s low, expressed as a % of daily ATR:
// 100 * (Close - Low) / ATR.
// All three metrics are forced to daily bars via request.security(..., "D", ...), so they stay consistent
// regardless of the chart timeframe.
Hope it helps. Please provide feedback in case I made errors.

Volume Bars Color by CandleStick Pattern [SnakeTurtle]Choose the Colors and Transparency of Volume Bars and Signals from Indicator Settings for your Better Visibility.
This Indicator ignores the color of the Candle Closed to match color of Volume Bar instead sees the candlestick pattern of the Candle to give Color to Volume Bar.
A Signal that shows Bullish or Bearish Momentum is also added (Change Color & Transparency of Signal from Indicator Settings for Better Visibility)
Comment Below to request new features
🐍🐢

Anurag Balanced 0DTE Scalper SPY QQQBalanced 0DTE Scalper
1. Purpose: A 0DTE options day trading indicator for SPY/QQQ on 5-minute charts with visual CALL/PUT entry and exit signals.
2. Trend Filter: Uses 15-minute EMA crossover (9/21) + ADX to confirm trend direction before taking trades.
3. Entry Logic: Triggers on pullback to 5m EMA9 with RSI/VWAP/MACD confirmation, bullish or bearish candle required.
4. Exit System: ATR-based trailing stop, dual targets (TP1 partial, TP2 full), time stop, and auto-exit at EOD.
5. Risk Controls: Max trades/day limit, cooldown period after exits, session filter (avoids first 10 min & last 15 min).
6. Visual Feedback: Dynamic stop/target lines, entry/exit labels with P&L, background color for trend bias and cooldown.
7. Dashboard: 16-row panel showing bias, ADX, regime, RSI, VWAP, position, bars held, cooldown status, strike suggestions, and DTE recommendation.

Anurag - Balanced 0DTE Scalper QQQ SPYBalanced 0DTE Scalper is a professional-grade execution system designed specifically for the high-velocity world of 0DTE (Zero Days to Expiration) options trading on indices like SPY, QQQ, and IWM.
Unlike standard indicators that repaint or lag, this system uses Non-Repainting Multi-Timeframe Logic to align the institutional trend (15m) with precision entry triggers (5m). It is engineered to solve the two biggest killers of 0DTE traders: Theta Decay (holding too long) and Choppy Markets (trading without trend).
How It Works
1. The "Safety Belt" (15-Minute Trend Filter) Before any trade is taken, the system checks the confirmed 15-minute Trend and ADX (Strength).
No Repainting: It strictly uses the previous closed 15m bar to determine bias. Once a signal prints, it stays printed.
Regime Detection: It automatically blocks trades during low-volume "chop" (Low ADX) to save you from theta burn.
2. Precision Entry Triggers (5-Minute) Once the 15m trend gives the "Green Light," the system hunts for 5m setups using a confluence of:
EMA Crossovers: For immediate momentum.
VWAP Filter: Ensuring you are on the right side of institutional volume.
RSI Check: To avoid buying tops or selling bottoms.
3. Aggressive Risk Management (The "Profit Locker") 0DTE profits can vanish in seconds. This script manages the trade for you visually:
Dynamic Trailing Stop: Trails price based on candle Highs/Lows (not closes), allowing it to lock in profits at the peak of a spike.
Time Stop: If a trade stalls for 60 minutes (12 bars), the system triggers a "Time Exit." In 0DTE, time is money—if it's not working, get out.
Visual Levels: Automatically draws your Stop Loss, Target 1 (Conservative), and Target 2 (Runner) lines on the chart.
Features & Dashboard
Live Dashboard: Monitors Trend Bias, ADX Strength, RSI, and Open PnL in real-time.
On-Chart Tickets: Prints a "CALL OPEN" or "PUT OPEN" label with the exact Entry Price, Stop Loss, and Strike Suggestion.
Session Filters: Automatically avoids the first 10 minutes (Open Volatility) and the last 15 minutes (Close Chaos).
Settings Guide
Risk Mode:
Balanced (Default): The recommended blend of Trend + Momentum.
Conservative: Requires a very strong ADX trend. Fewer trades, higher win rate.
Aggressive: Ignores ADX strength. Good for FOMC/CPI days only.
Strike Suggestion: Automatically calculates the nearest Strike Price (ATM/OTM) for SPY/QQQ based on your settings.
Disclaimer
This tool is for educational purposes only. 0DTE options trading involves extreme risk of capital loss. Past performance (even with non-repainting logic) is not indicative of future results. Always manage your risk.

ICT SMT Divergence (Synced + Alerts)This is a professional-grade tool designed for Inner Circle Trader (ICT) students and price action traders to automatically detect Smart Money Tool (SMT) Divergences.
SMT Divergence is "a crack in the correlation" between correlated assets (e.g., NQ vs. ES, or EURUSD vs. DXY). It reveals the footprint of institutional accumulation or distribution by showing when one asset sweeps liquidity while the other fails to do so.
🚀 Why this indicator is different? (The "Synced" Logic)
Most SMT indicators fail because they rigidly expect both assets to form a High/Low on the exact same candle. However, in live markets, correlated assets often lag or lead each other by a few minutes.
This script solves that problem.
It uses a unique "Driver-Based Synchronization" algorithm:
Main Driver: It monitors your current chart (e.g., NQ) for a confirmed Pivot structure.
Smart Scan: Once a pivot is confirmed, it actively scans the comparison symbol (e.g., ES) within a customizable Time Window (e.g., ±3 bars) to find the true price extreme.
Result: It catches valid SMT Divergences even if the comparison asset peaked 5, 10, or 15 minutes before/after your main chart.
Key Features
✅ Automatic Detection: Identifies both Bullish (Accumulation) and Bearish (Distribution) SMTs.
✅ Correlation Flexibility: Works with positive correlations (NQ vs ES) and negative correlations (EU vs DXY) automatically based on structure logic.
✅ Smart Synchronization: Includes a Time Sync Error setting to tolerate timing differences between assets.
✅ Dual Alert System: Supports both alert() for webhooks and alertcondition() for standard TradingView UI alerts.
✅ Visual Clarity: Draws divergence lines only on valid setups, keeping your chart clean.
How to Use
Apply to Chart: Load the indicator on your preferred timeframe (15m, 1H, and 4H recommended).
Select Comparison Symbol:
If trading Nasdaq (NQ), compare with ES (S&P500) or YM (Dow).
If trading EURUSD, compare with GBPUSD or DXY (Inverse logic applies).
Adjust Sensitivity:
Pivot Lookback: Controls how "sharp" a turn must be to register. (Default: 10).
Time Sync Error: How many bars of tolerance allowed. If assets are volatile and desynchronized, increase this value (Default: 3).
Alerts
Never miss a setup. You can set alerts for:
Bullish SMT: Potential bottoming formations.
Bearish SMT: Potential topping formations.
Any SMT: All divergences.

Liquidity Sweep by NKLiquidity Sweep (OC-Based) + Doji Acceptance
🔹 Designed for 4H Crypto Trading
This indicator highlights high-probability liquidity sweep candles using a body-based comparison (Open/Close) rather than traditional high/low sweeps, making it cleaner and more reliable in volatile crypto markets.
It is specifically optimized for the 4-hour timeframe, where each day consists of 6 candles, allowing clear identification of institutional stop-hunts and failed breakouts.
---
🔍 Core Concept
Liquidity is often taken above recent candle bodies (opens & closes) rather than just wicks.
This script detects those events and confirms them using candle structure, wick dominance, and doji behavior.
The indicator marks candles where:
* Liquidity is swept
* Price is rejected
* Directional intent is visible
---
🔴 Bearish Liquidity Sweep (Sell Signal)
A candle is highlighted as bearish when ALL of the following conditions are met:
1️⃣ Liquidity Sweep (Body-Based)
* Current candle HIGH is greater than ALL
* Opens of the last X candles
* Closes of the last X candles
(Wicks of previous candles are ignored to reduce noise)
2️⃣ Wick Dominance
* Upper wick > Lower wick
3️⃣ Rejection Confirmation (ANY ONE)
* Candle closes red, OR
* Candle is a Gravestone-type Doji, defined as:
* Very small candle body
* Strong upper wick
* Body color is irrelevant
---
🟢 Bullish Liquidity Sweep (Buy Signal)
A candle is highlighted as bullish when ALL of the following conditions are met:
1️⃣ Liquidity Sweep (Body-Based)
* Current candle LOW is lower than ALL
* Opens of the last X candles
* Closes of the last X candles
2️⃣ Wick Dominance
* Lower wick > Upper wick
3️⃣ Rejection Confirmation (ANY ONE)
* Candle closes green, OR
* Candle is a Dragonfly-type Doji, defined as:
* Very small candle body
* Strong lower wick
* Body color is irrelevant
---
## ⚙️ Inputs
* Liquidity Lookback (X candles)
Number of previous candles used to define the liquidity range.
* Doji Body % of Candle Range
Controls how small the candle body must be to qualify as a doji.
---
🎨 Visuals
* 🔴 Red candle + down arrow → Bearish liquidity sweep
* 🟢 Green candle + up arrow → Bullish liquidity sweep
* Indicator is plotted directly on price
---
✅ Key Features
* Uses Open & Close levels instead of highs/lows
* Filters weak signals using wick dominance
* Accepts both body-based and doji-based rejections
* No repainting
* Works on all markets, optimized for crypto
* Best used at:
* Range highs & lows
* Previous day high / low
* Consolidation extremes
---
❌ What This Indicator Does NOT Do
* No trend bias
* No RSI / EMA / CPR filters
* No session-based filtering
* No multi-timeframe logic
* No entry/exit automation

[TA] Sessions OHLC# TA Sessions OHLC
TA Sessions OHLC is a session-based market structure indicator that maps Regular Trading Hours (RTH) and Globex / Extended Hours (ETH) levels directly onto your chart.
It provides a clear, consistent framework for understanding where price is trading relative to session structure , so you can make better decisions around context, bias, and execution.
This indicator does not generate signals. It defines the map.
---
## What TA Sessions OHLC Plots
### 🔹 Regular Trading Hours (RTH)
* Session High
* Session Low
* Session Mid
* RTH Open
* Optional Previous RTH High / Low
### 🔹 Globex / Extended Trading Hours (ETH)
* Session High
* Session Low
* Session Mid
* Globex Open
* Globex Close
* Optional Previous Globex High / Low
### 🔹 Additional References
* Previous Open / Previous Close
* Week Open / Previous Week Open
* Optional RTH range extension levels (projected above and below the session range)
### 🔹 Session Table (Optional)
An on-chart table showing:
* Open, High, Low, Mid, Close, Range
For both RTH and ETH , with configurable layout and styling.
---
## How Traders Use This Indicator
TA Sessions OHLC is designed to answer one core question:
“Where are we trading relative to the session?”
Below are common, practical use cases.
---
## 1️⃣ Session Bias & Context
* Price above RTH Mid → bullish session context
* Price below RTH Mid → bearish session context
* Price rotating around mid → balanced / rotational session
Many traders use the session mid as a bias filter , not an entry signal.
---
## 2️⃣ RTH vs Globex Behavior
Globex often sets the range , and RTH decides acceptance or rejection .
Common observations:
* RTH breaking and holding above Globex High → acceptance
* RTH failing at Globex High/Low → rejection / fade opportunity
* RTH trading back into Globex range → balance / chop risk
TA Sessions OHLC makes these relationships explicit.
---
## 3️⃣ Previous Session Levels as Reaction Zones
Previous RTH and Globex highs/lows frequently act as:
* Support / resistance
* Liquidity targets
* Decision points during trend continuation or reversal
Use them to:
* Define areas to take profits
* Avoid chasing trades into known reference levels
* Frame risk (what happens if this level fails?)
---
## 4️⃣ Opens & Closes as Anchors
* RTH Open often defines early bias
* Globex Close often acts as an overnight reference
* Previous Close is frequently defended or tested early in the session
These levels help identify:
* Early trend days
* Failed opens
* Range-bound sessions
---
## 5️⃣ Range Expansion & Extension Levels
Optional extension levels project potential expansion beyond the RTH range.
Typical use:
* Price breaks RTH High → extension levels become contextual upside zones
* Price breaks RTH Low → downside extensions frame potential continuation
These are reference zones , not targets.
---
## How NOT to Use This Indicator
* Do not treat levels as automatic buy/sell signals
* Do not assume every level must hold
* Do not trade every touch
This tool defines structure , not entries.
---
## Best Practices
* Use on intraday charts (1–30 minute recommended)
* Combine with:
* Order flow
* Price action
* Volume / VWAP
* Your existing execution model
* Disable levels you don’t use to keep charts clean
---
## Supported Sessions
Preconfigured for:
* CME
* NYSE
* London
* Tokyo
Higher-timeframe session modes (weekly/monthly) are not included in this version and may be added later.
---
## Who This Indicator Is For
TA Sessions OHLC is built for traders who:
* Care about session behavior
* Trade futures, indices, or liquid intraday markets
* Want objective structure without signals or bias
* Prefer understanding context before execution
---
🎄 Released free as part of a Christmas giveaway.
Invite-only access.
Merry Christmas 🎅

Ingenuity Crazy Strategy BasicThis indicator works — IF you use it correctly.
Wrong settings = bad results.
That’s why we keep:
🔥 The exact settings
🔥 Market-specific presets
🔥 Live trade examples
INSIDE OUR DISCORD ONLY.
🚫 Do not guess
🚫 Do not freestyle settings
👉 Join the Discord and trade it the way it’s meant to be traded.
discord.gg/uRs3DWXu

Ingenuity Crazy Strategy AdvanceThis indicator works — IF you use it correctly.
Wrong settings = bad results.
That’s why we keep:
🔥 The exact settings
🔥 Market-specific presets
🔥 Live trade examples
INSIDE OUR DISCORD ONLY.
🚫 Do not guess
🚫 Do not freestyle settings
👉 Join the Discord and trade it the way it’s meant to be traded.
discord.gg

HTF Fractal Boxes by TAAKOWhat This Indicator Does
This indicator displays higher timeframe (HTF) candlesticks as an overlay on your current chart, allowing you to see larger timeframe price action without switching charts.
Key Features:
Shows the last 3 completed HTF candles (configurable)
Displays a 4th candle with dashed lines showing the current forming HTF bar
Each candle includes full OHLC data: body (open/close) and wicks (high/low)
Candles are color-coded: green for bullish, red for bearish, blue for neutral
Positioned on the right side of your chart for easy reference
Automatically scales with your Y-axis price movements

ADX Regime (5m) Companion PaneADX Regime Filter (5-Minute) — Trade Permission Indicator
This indicator is a market regime filter designed to answer one question only:
Is this market worth trading right now?
It is built specifically for intraday futures trading, with a strong focus on Gold (GC / MGC) and prop-firm style discipline.
What This Indicator Does
This ADX indicator does not give buy or sell signals.
Instead, it tells you when to trade and when to stand down.
Gold spends a large portion of the day in compression or VWAP chop.
Trading during those periods destroys consistency and drawdown control.
This indicator helps you avoid those conditions.
How ADX Is Used Here
ADX is calculated on the 5-minute timeframe
It measures trend strength and expansion, not direction
Direction should come from structure or higher-timeframe bias, not ADX
ADX is used strictly as a permission filter.
ADX Zones Explained
The indicator includes clear horizontal reference levels:
Below 18
Compression / chop
No trade environment
20 to 35
Optimal expansion zone
Best conditions for pullbacks and continuations
35 to 45
Strong trend
Trade cautiously or only first pullbacks
Above 45
Late expansion or news-driven volatility
No new entries recommended
These zones are visual guides to keep trading decisions objective.
What This Indicator Is NOT
It is not a signal generator
It is not an entry tool
It is not predictive
ADX does not tell you what direction to trade.
It tells you whether trading is allowed at all.
Best Practices
Use ADX on the 5-minute chart
Combine it with:
Higher-timeframe trend
VWAP or key levels
Clear price action
If ADX is below 18, standing aside is a valid trade decision
Who This Indicator Is For
Futures traders
Prop firm traders
Traders who value:
Capital protection
Fewer but higher-quality trades
Consistency over activity
Core Principle
ADX is a gatekeeper.
When it says no, you do nothing.
When it says yes, you still wait for structure and location.
This mindset alone can dramatically improve discipline and results.

DMI with ADX Weekly > Daily & Rising AlertWe sincerely apologise, but this script is currently undergoing testing and is unavailable for use.
This script features functionality to notify when both the weekly and daily DMI charts are trending upwards.

SVP + candle + Max volume [midst]
SVP + DALY CANDLE + MAX VOLUME
A comprehensive trading indicator that combines Session Volume Profile (SVP), Higher Timeframe (HTF) Candles, and Intrabar Max Volume Price Detection into one powerful tool. Perfect for traders who want to understand price action, volume distribution, and key levels all in one place.
KEY FEATURES
Session Volume Profile
• Real-time volume distribution across price levels for the current session
• Point of Control (POC) - identifies the price with the highest traded volume
• Value Area High (VAH) & Low (VAL) - shows where 70% of the volume occurred (customizable percentage)
• Color-coded volume bars - distinguish between up volume (bullish) and down volume (bearish)
• Value area highlighting - clearly see the most important price zones
Higher Timeframe Candle Display
• Visual daily (or custom timeframe) candle overlaid on your current chart
• OHLC labels - see Open, High, Low, and Close prices clearly marked
• Fully customizable colors - separate colors for bullish/bearish bodies, borders, and wicks
• Adjustable positioning - move the candle and labels to your preferred location
Max Volume Price Detection
• Identifies the exact price level with maximum volume within each bar
• Uses Lower Timeframe (LTF) data for precise volume analysis (Premium+ required)
• Simple mode fallback - works on all TradingView plans
• Previous max volume marker - displays previous bar's max volume as a reference dot
• Real-time calculation - updates as each bar forms
ATR Table
• Dynamic ATR-based stop levels - automatically calculates potential stop-loss levels
• Multiple smoothing methods - RMA, SMA, EMA, WMA
• Customizable multiplier - adjust for your risk tolerance
• Clean table display - shows ATR value, high stop, and low stop
PERFECT FOR
Day traders analyzing intrabar volume distribution
Swing traders wanting HTF context on lower timeframes
Volume profile traders looking for key support/resistance levels
Price action traders seeking high-probability entry zones
HOW TO USE
Volume Profile Analysis
POC often acts as a magnet for price. VAH/VAL are key support/resistance levels. High volume nodes indicate strong price acceptance, while low volume nodes suggest potential breakout zones.
HTF Candle Context
See daily range while trading on 5m-1h charts. Daily open often acts as pivot point. Daily high/low are key levels to watch.
Max Volume Price
Black line shows where most volume traded in each bar. Previous max volume (dot) helps identify institutional activity. Clusters of max volume create strong support/resistance. Can possibly indicate a Wick bounce
ATR Stops
Use ATR-based levels for logical stop placement. Adjust multiplier based on market volatility.
SETTINGS & CUSTOMIZATION
Positioning
Control the global offset to move both candle and profile together. Fine-tune with individual offsets for candle and profile spacing.
Volume Profile
Adjustable number of rows (50-500) for granular or simplified view. Customizable width and placement (left/right). Value Area percentage control. Full color customization for all volume components.
HTF Candle
Any timeframe selection (default: Daily). Full color customization for bull/bear candles. Adjustable candle width. Toggle OHLC labels on/off. Control label distance and line widths.
Max Volume Price
Choose between Simple (all plans) or LTF mode (Premium+). Auto or manual LTF resolution. Custom color and line width. Toggle current and previous markers independently.
TECHNICAL NOTES
Maximum 5000 bars lookback for volume calculations
Works on all timeframes
LTF max volume requires TradingView Premium or higher
Optimized for performance with efficient array operations
For best results, use on liquid instruments with reliable volume data
Most effective on intraday charts (5min-1hour) for day trading and scalping strategies
For Entertainment and information only
Created by midst

Pinnacle ICT Basic (PICT Basic) v1.22.4 (LOCKED)Pinnacle ICT Basic highlights market regime (stand down vs trending), HTF alignment, and two structure-only setup types (Sweep reversal and Continuation first-touch). It then issues binary “Confirm” signals when displacement + volume + HTF + micro alignment are present. This is an educational structure tool—no entries/exits, targets/stops, or trade advice.

BK AK-Flag Formations🏴☠️ BK AK-Flag Formations — Raise the standard. Drive the line. Continue the assault. 🏴☠️
Built for traders who exploit momentum with discipline: flagpoles, flags, and pennants detected, tagged, and briefed—so you press advantage instead of hesitating.
🎖️ Full Credit (Engine + Logic — Trendoscope)
Original foundation (Trendoscope Flags & Pennants):
The entire detection engine—multi-zigzag swing extraction, pivot logic, pattern validation, classification framework, and drawing architecture—is Trendoscope. He’s the architect of the core system.
I’m not claiming the engine. I’m shipping a cleaner, more tactical interface layer on top of his work.
🧩 BK Enhancements (on top of Trendoscope)
Purpose: read continuation faster with less chart noise.
Short-form pattern tags so structure stays obvious without burying price:
BF / BeF / BP / BeP / F / P / UF / DF / RF / FF / AF / DeF
Label transparency controls (text + background), plus separate transparency control for short labels
Hover tooltips (toggle): hover the tag to reveal full pattern name + bias (Bullish / Bearish / Neutral)
Upgraded alert system: filters by Bias (Bullish/Bearish/Neutral) and Type (Flag / Pennant), with clearer alert messages
Pattern border extension (optional): extends the two pattern boundary lines forward by N bars so your levels stay mapped for break/retest planning
Everything else is Trendoscope’s architecture and math.
🧠 What It Does (The Mission)
This script hunts continuation formations that form after a strong impulse move:
Detects the flagpole (impulse)
Validates a consolidation structure (flag or pennant)
Tags it cleanly with short codes
Optional hover-briefing gives the long name + bias exactly when you need it
You get continuation structure in real time, across multiple swing sensitivities.
🧭 How It Detects (So You Know It’s Not Random)
This isn’t “pattern art.” It’s rule-based geometry + swing logic:
1) Multi-Zigzag Sweep (micro → macro)
Runs up to 4 zigzag engines so it catches both tight and larger continuations.
(Default BK tuning uses 4 levels with different swing lengths/depths.)
2) Quality Filters (you control strictness)
Key scanning controls:
Error Threshold: tolerance used during trendline validation
Flat Threshold: what qualifies as “flat” vs sloped
Max Retracement (default 0.618): limits how deep the consolidation can retrace the impulse
Verify Bar Ratio (optional): checks proportion/spacing of pivots, not just price
Avoid Overlap: prevents stacking formations on top of each other
Repaint option: allows refinement if better coordinates form (for real-time users)
3) Classification (Flag vs Pennant)
Once the engine confirms an impulse + valid consolidation, it classifies:
Flag = orderly channel/wedge-style consolidation after the pole
Pennant = tighter triangle-style compression after the pole
Then it labels with bias based on direction and formation context.
🏳️ Read the Continuation (Short Codes that Actually Matter)
BF — Bull Flag: strong pole → controlled pullback; watch for break + continuation expansion
BP — Bull Pennant: thrust → tight compression; expansion confirms carry
BeF — Bear Flag: down impulse → weak rallies; breakdown favors continuation lower
BeP — Bear Pennant: pause beneath resistance; release favors trend continuation
F / P: generic flag / pennant tags when the system can’t (or shouldn’t) over-specify
Standards aren’t decoration—they’re orders.
🧑🏫 Mentor A.K.
A.K. is the discipline behind this release.
No chasing. No gambling. No emotional entries.
He drilled one rule into everything: structure first, then execution—never the reverse.
This indicator exists to make that possible under pressure.
🤝 Give Forward (The Code of the Crew)
If this tool sharpens your edge:
Teach one trader how to read continuation properly (pole → base → trigger → invalidation)
Share process, not just screenshots (entry logic, stop logic, management plan)
If you build on open work: credit loudly and contribute improvements back when you can
Tools multiply force. Character decides the outcome.
👑 Respect to King Solomon (Wisdom > Impulse)
“Plans are established by counsel; by wise guidance wage war.” — Proverbs 20:18
Continuation trading is the same: impulse → formation → execution.
BK AK-Flag Formations — when the standard rises, the line advances.
Gd bless. 🙏

BK AK-Warfare Formations👑 BK AK-Warfare Formations — Form the pride. Take the high ground. Strike with wisdom. 👑
Built for traders who think like commanders: see the formation, plan the maneuver, execute the strike.
🎖️ Full Credit (Engine + Logic — Trendoscope)
Original foundation (Trendoscope Auto Chart Patterns):
The entire pattern engine (multi-zigzag scanning, pivot logic, trendline-pair validation, geometric classification, drawing framework, overlap handling, and pattern caps) is by Trendoscope—one of the best coders on TradingView and the creator of this indicator’s core.
I’m not rewriting his war machine. I’m upgrading the interface and tactical readability so you can see structure faster and act cleaner.
🧩 BK Enhancements (on top of Trendoscope)
Built for clarity under pressure:
Short-form formation tags so your chart stays readable (AC/DC/RC/RWE/FWE/CT/DT/etc.)
Label transparency controls (text + background), including separate controls for short labels
Hover tooltips (toggle): hover a label to see the full pattern name + bias (Bullish/Bearish/Neutral)
Alerts upgraded with bias + category filtering (Channel / Wedge / Triangle)
Pattern border extension (optional): extends the two boundary lines forward by N bars so the battlefield edges stay visible (not extending random zigzag legs)
Everything else remains Trendoscope’s architecture and detection logic.
🧠 What It Does
Auto-detects and labels:
Channels
AC — Ascending Channel
DC — Descending Channel
RC — Ranging Channel
Wedges
RWE / FWE — Rising/Falling Wedge (Expanding)
RWC / FWC — Rising/Falling Wedge (Contracting)
Triangles
ATC / DTC — Asc/Desc Triangle (Contracting)
ATE / DTE — Asc/Desc Triangle (Expanding)
CT — Converging Triangle
DT — Diverging Triangle
You get clean battlefield tags (short codes) and optional hover briefings (full name + bias) without clutter.
🧭 How It Detects (So You Know It’s Not Random)
Trendoscope’s engine does this in a disciplined sequence:
Multi-Zigzag Sweep
Multiple zigzag levels scan the same market from different swing sensitivities.
Pivot Structure Validation (5 or 6 pivots)
A formation is only valid when pivot sequencing produces a legit trendline pair.
Trendline-Pair Rules
Upper boundary anchors to pivot highs
Lower boundary anchors to pivot lows
Geometry is measured (parallel / converging / diverging) to classify channel vs wedge vs triangle
Optional quality filters reduce warped/low-quality shapes (bar ratio checks, overlap avoidance, max pattern caps)
You’re not getting “art.” You’re getting validated geometry.
⚙️ Core Controls (What You Actually Tune)
Zigzag length/depth per level: swing sensitivity (faster vs cleaner)
Pivots used (5 or 6): tighter vs broader structures
Error/Flat thresholds: tolerance + what qualifies as “flat”
Avoid overlap: prevents stacking junk on top of junk
Max patterns: keeps the chart from becoming noise
Label system: short codes, transparency, tooltips, bias visibility
Border extension: projects the structure edges forward for planning
🗺️ Read the Battlefield (Tactical Translation)
AC (Ascending Channel): trend carry; buy pullbacks to the lower wall, manage risk outside structure
DC (Descending Channel): late down-leg; watch for momentum shift + reclaim = tactical reversal zone
RWE (Rising Wedge): distribution bias; break + failed retest is where weakness shows
CT / DT (Triangles): compression → expansion; plan edges, not the middle
Structure is the map. Bias is the compass. Your risk plan is the sword.
🧑🏫 Mentor A.K. (Respect Where It’s Due)
A.K. is the discipline behind this project.
Patience. Clean execution. No gambling. No chasing.
His standard is in every choice: reduce noise, sharpen structure, force clarity.
This is why the labels are tight, the tooltips are direct, and the features serve execution—not ego.
🤝 Give Forward (The Code of the Camp)
If this indicator sharpens your edge:
Teach one trader how to read structure with discipline (not hype)
Share process, not just screenshots (entries, invalidation, management)
If you build on open work, credit loudly and improve responsibly
A king builds men. A lion builds courage. A camp survives because knowledge moves forward.
👑 King Solomon’s Standard
This is warfare—market warfare—so we move by wisdom, not emotion:
“By wise counsel you will wage your own war, and in a multitude of counselors there is safety.” — Proverbs 24:6
BK AK-Warfare Formations — where formation meets judgment, and judgment meets execution.
Gd bless. 🙏

Pivot Edge ProOverview
Smart Pivot Analytics is a highly accurate technical analysis tool designed to identify and validate significant price levels. Unlike standard pivot indicators that only mark recent highs, this tool backtests each identified pivot against thousands of historical candlesticks to calculate its real-world “success rate.”
Key Features
Historical Backtesting: The indicator scans up to 4,900 historical columns to find every instance where price interacted with a specific pivot level.
Strength Score (%): Each level is assigned a percentage score based on its reversal rate. It calculates how many times the price has successfully reached and rejected the level, providing a statistical “hit rate.”
Dynamic Hit Counter: Displays the exact number of times a level has been tested (hit), helping traders distinguish between new levels and established “old” levels.
Smart Filtering: To keep the chart clean, the indicator automatically filters out weak levels and prevents “clutter” by merging levels that are too close together.
Infinite Left Projection: Lines extend left to infinity, allowing traders to see the historical significance of a level across the entire price history at a glance.
How to Trade with It
Red Levels (High Power > 75%): These are “Top Reaction Zones”. Expect a strong price rejection or significant breakout when these levels are tested.
Orange Levels (Medium Power): Suitable for profit targets or as secondary confirmation for entering a trade.
Encounter: Use these levels in conjunction with your existing strategy. When a high power pivot aligns with your entry signal, the probability of a successful trade increases significantly.
Technical Parameters
Lookback Period: Defines how far back in history the script calculates power.
Touch Radius: The "sensitivity" of the level (how close the price has to get to be considered a "hit").
Minimum Strength: A filter to show only the most reliable levels.

Supertrend 14-3 with Auto Fibthis strategy use the supertrend with the Auto fib levels for market analysis

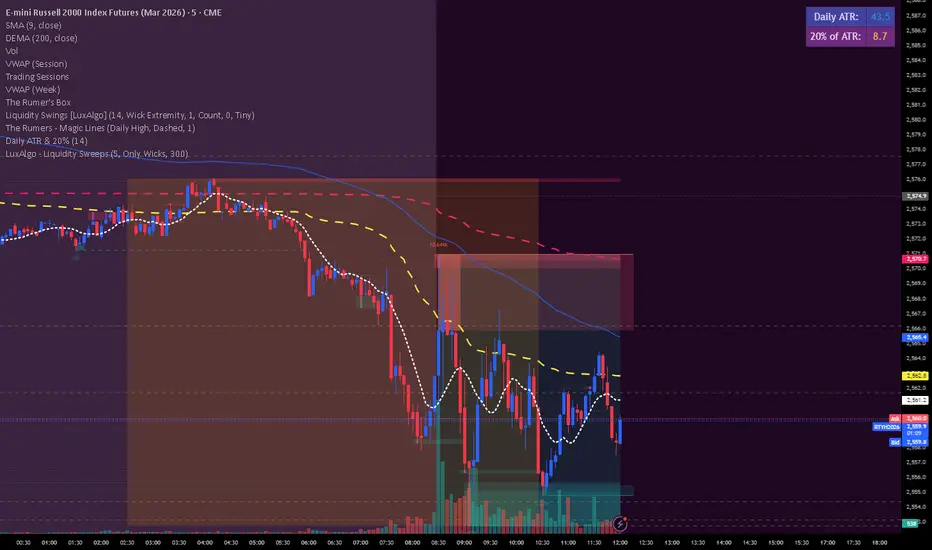
Daily ATR & 20%This is the daily atr value that is put in a table in upper right corner of trading view. it calculated 20% of the daily atr for a quick reference to see if the first candle is a manipulation candle.
Watchlist Auto Buy/Sell AlertsTrial for the best. This indicator is built to assess the chart and make it easier for traders to identify coins that are available for trading and minimize losses.

Box Theory [Interactive Zones] PyraTimeThis script combines Nicholas Darvas’s "Box Theory" with modern Supply and Demand (Premium/Discount) concepts. It automatically identifies the most recent Swing High and Swing Low to delineate the current trading range.
The purpose of this tool is to visualize market structure and help traders identify when price is relatively expensive (Premium) or cheap (Discount) within a defined range.
Visual Guide: What You Are Seeing
The Box: Represents the active trading range defined by the most recent significant Swing High and Swing Low.
Red Zone (Premium): The top 25% of the range. Mathematically, prices here are considered "expensive" relative to the current structure.
Green Zone (Discount): The bottom 25% of the range. Prices here are considered "cheap" relative to the current structure.
Grey Zone (Equilibrium): The middle 50% of the range. This is the area of fair value where price often consolidates.
Dashed Line (EQ): The exact 50% midpoint of the range.
Tutorial: How to Trade Using This Indicator
Method 1: Mean Reversion (Range Trading) This method applies when the market is moving sideways.
Identify Structure: Wait for a box to form.
Wait for Extremes: Do not trade when price is in the middle (Grey/White area). Wait for price to enter the Red or Green zones.
Entry Trigger:
Shorts: When price enters the Red Zone, look for a rejection (wicks leaving the zone) or a lower timeframe breakdown. Target the EQ (Midline) as your first take profit.
Longs: When price enters the Green Zone, look for support formation. Target the EQ (Midline) as your first take profit.
Method 2: Trend Continuation (Breakouts) This method applies when the market is trending strongly.
Breakout: Monitor the alerts. A close outside the box indicates a potential shift in market structure.
Retest: After a breakout up, the old "Red Zone" (Resistance) often flips to become new Support. Wait for price to pull back to the top of the old box before entering.
Configuration Guide (Settings)
Pivot Left/Right Bars (Sensitivity):
Default (20/20): Best for Swing Trading. It filters out market noise and only draws boxes based on major structural points.
Lower (5/5): Best for Scalping. It will create smaller, more frequent boxes but increases the risk of false signals.
Zone Percentage:
Default (25%): Standard deviation for Supply/Demand zones.
Alternative (15%): Use this for "sniping" entries at the absolute extremes of the range.
Multi-Timeframe (MTF):
Enable "Use Higher Timeframe" to see Daily or Weekly ranges while trading on lower timeframes (like the 15m or 1H). This helps keep your intraday trades aligned with the major trend.
Technical Note on "Lag" This indicator uses Pivots to draw the box. A pivot is only confirmed after a certain number of bars have passed (the "Pivot Right Bars" setting).
Example: If "Pivot Right Bars" is set to 20, the box will update 20 bars after the actual high or low occurred. This is necessary to confirm that the point was indeed a Swing High/Low. Do not treat the box lines as predictive; they are reactive to confirmed structure.

