Mutanabby_AI | Algo Pro Strategy# Mutanabby_AI | Algo Pro Strategy: Advanced Candlestick Pattern Trading System
## Strategy Overview
The Mutanabby_AI Algo Pro Strategy represents a systematic approach to automated trading based on advanced candlestick pattern recognition and multi-layered technical filtering. This strategy transforms traditional engulfing pattern analysis into a comprehensive trading system with sophisticated risk management and flexible position sizing capabilities.
The strategy operates on a long-only basis, entering positions when bullish engulfing patterns meet specific technical criteria and exiting when bearish engulfing patterns indicate potential trend reversals. The system incorporates multiple confirmation layers to enhance signal reliability while providing comprehensive customization options for different trading approaches and risk management preferences.
## Core Algorithm Architecture
The strategy foundation relies on bullish and bearish engulfing candlestick pattern recognition enhanced through technical analysis filtering mechanisms. Entry signals require simultaneous satisfaction of four distinct criteria: confirmed bullish engulfing pattern formation, candle stability analysis indicating decisive price action, RSI momentum confirmation below specified thresholds, and price decline verification over adjustable lookback periods.
The candle stability index measures the ratio between candlestick body size and total range including wicks, ensuring only well-formed patterns with clear directional conviction generate trading signals. This filtering mechanism eliminates indecisive market conditions where pattern reliability diminishes significantly.
RSI integration provides momentum confirmation by requiring oversold conditions before entry signal generation, ensuring alignment between pattern formation and underlying momentum characteristics. The RSI threshold remains fully adjustable to accommodate different market conditions and volatility environments.
Price decline verification examines whether current prices have decreased over a specified period, confirming that bullish engulfing patterns occur after meaningful downward movement rather than during sideways consolidation phases. This requirement enhances the probability of successful reversal pattern completion.
## Advanced Position Management System
The strategy incorporates dual position sizing methodologies to accommodate different account sizes and risk management approaches. Percentage-based position sizing calculates trade quantities as equity percentages, enabling consistent risk exposure across varying account balances and market conditions. This approach proves particularly valuable for systematic trading approaches and portfolio management applications.
Fixed quantity sizing provides precise control over trade sizes independent of account equity fluctuations, offering predictable position management for specific trading strategies or when implementing precise risk allocation models. The system enables seamless switching between sizing methods through simple configuration adjustments.
Position quantity calculations integrate seamlessly with TradingView's strategy testing framework, ensuring accurate backtesting results and realistic performance evaluation across different market conditions and time periods. The implementation maintains consistency between historical testing and live trading applications.
## Comprehensive Risk Management Framework
The strategy features dual stop loss methodologies addressing different risk management philosophies and market analysis approaches. Entry price-based stop losses calculate stop levels as fixed percentages below entry prices, providing predictable risk exposure and consistent risk-reward ratio maintenance across all trades.
The percentage-based stop loss system enables precise risk control by limiting maximum loss per trade to predetermined levels regardless of market volatility or entry timing. This approach proves essential for systematic trading strategies requiring consistent risk parameters and capital preservation during adverse market conditions.
Lowest low-based stop losses identify recent price support levels by analyzing minimum prices over adjustable lookback periods, placing stops below these technical levels with additional buffer percentages. This methodology aligns stop placement with market structure rather than arbitrary percentage calculations, potentially improving stop loss effectiveness during normal market fluctuations.
The lookback period adjustment enables optimization for different timeframes and market characteristics, with shorter periods providing tighter stops for active trading and longer periods offering broader stops suitable for position trading approaches. Buffer percentage additions ensure stops remain below obvious support levels where other market participants might place similar orders.
## Visual Customization and Interface Design
The strategy provides comprehensive visual customization through eight predefined color schemes designed for different chart backgrounds and personal preferences. Color scheme options include Classic bright green and red combinations, Ocean themes featuring blue and orange contrasts, Sunset combinations using gold and crimson, and Neon schemes providing high visibility through bright color selections.
Professional color schemes such as Forest, Royal, and Fire themes offer sophisticated alternatives suitable for business presentations and professional trading environments. The Custom color scheme enables precise color selection through individual color picker controls, maintaining maximum flexibility for specific visual requirements.
Label styling options accommodate different chart analysis preferences through text bubble, triangle, and arrow display formats. Size adjustments range from tiny through huge settings, ensuring appropriate visual scaling across different screen resolutions and chart configurations. Text color customization maintains readability across various chart themes and background selections.
## Signal Quality Enhancement Features
The strategy incorporates signal filtering mechanisms designed to eliminate repetitive signal generation during choppy market conditions. The disable repeating signals option prevents consecutive identical signals until opposing conditions occur, reducing overtrading during consolidation phases and improving overall signal quality.
Signal confirmation requirements ensure all technical criteria align before trade execution, reducing false signal occurrence while maintaining reasonable trading frequency for active strategies. The multi-layered approach balances signal quality against opportunity frequency through adjustable parameter optimization.
Entry and exit visualization provides clear trade identification through customizable labels positioned at relevant price levels. Stop loss visualization displays active risk levels through colored line plots, ensuring complete transparency regarding current risk management parameters during live trading operations.
## Implementation Guidelines and Optimization
The strategy performs effectively across multiple timeframes with optimal results typically occurring on intermediate timeframes ranging from fifteen minutes through four hours. Higher timeframes provide more reliable pattern formation and reduced false signal occurrence, while lower timeframes increase trading frequency at the expense of some signal reliability.
Parameter optimization should focus on RSI threshold adjustments based on market volatility characteristics and candlestick pattern timeframe analysis. Higher RSI thresholds generate fewer but potentially higher quality signals, while lower thresholds increase signal frequency with corresponding reliability considerations.
Stop loss method selection depends on trading style preferences and market analysis philosophy. Entry price-based stops suit systematic approaches requiring consistent risk parameters, while lowest low-based stops align with technical analysis methodologies emphasizing market structure recognition.
## Performance Considerations and Risk Disclosure
The strategy operates exclusively on long positions, making it unsuitable for bear market conditions or extended downtrend periods. Users should consider market environment analysis and broader trend assessment before implementing the strategy during adverse market conditions.
Candlestick pattern reliability varies significantly across different market conditions, with higher reliability typically occurring during trending markets compared to ranging or volatile conditions. Strategy performance may deteriorate during periods of reduced pattern effectiveness or increased market noise.
Risk management through stop loss implementation remains essential for capital preservation during adverse market movements. The strategy does not guarantee profitable outcomes and requires proper position sizing and risk management to prevent significant capital loss during unfavorable trading periods.
## Technical Specifications
The strategy utilizes standard TradingView Pine Script functions ensuring compatibility across all supported instruments and timeframes. Default configuration employs 14-period RSI calculations, adjustable candle stability thresholds, and customizable price decline verification periods optimized for general market conditions.
Initial capital settings default to $10,000 with percentage-based equity allocation, though users can adjust these parameters based on account size and risk tolerance requirements. The strategy maintains detailed trade logs and performance metrics through TradingView's integrated backtesting framework.
Alert integration enables real-time notification of entry and exit signals, stop loss executions, and other significant trading events. The comprehensive alert system supports automated trading applications and manual trade management approaches through detailed signal information provision.
## Conclusion
The Mutanabby_AI Algo Pro Strategy provides a systematic framework for candlestick pattern trading with comprehensive risk management and position sizing flexibility. The strategy's strength lies in its multi-layered confirmation approach and sophisticated customization options, enabling adaptation to various trading styles and market conditions.
Successful implementation requires understanding of candlestick pattern analysis principles and appropriate parameter optimization for specific market characteristics. The strategy serves traders seeking automated execution of proven technical analysis techniques while maintaining comprehensive control over risk management and position sizing methodologies.
Candlestickpattern

3 Red / 3 Green Strategy with Volatility CheckStrategy Name: 3 Red / 3 Green Strategy with Volatility Check by AlgoTradeKit
Overview
This long-only strategy is designed for daily bars on NASDAQ (or similar instruments) and combines simple price action with a volatility filter. It “tells it like it is” – enter when the market shows weakness, but only in sufficiently volatile conditions, and exit either on signs of a reversal or after a set number of days.
Entry Conditions
- Price Action :
Enter a long position when there are 3 consecutive red days (each day's close is below its open).
- Volatility Filter :
The entry is allowed only if the current ATR (Average True Range) calculated over the specified ATR Period (default 12) is greater than its 30-day simple moving average. This ensures the market has enough volatility to justify the trade.
Exit Conditions
- Reversal Signal :
Exit the long position when 3 consecutive green days occur (each day's close is above its open), signaling a potential reversal.
- Time Limit :
Regardless of market conditions, any open trade is closed if it reaches the Maximum Trade Duration (default 22 days). This helps limit exposure during stagnant or unfavorable market conditions.
- You can toggle the three-green-day exit if you want to isolate the time-based exit.
Input Parameters
- Maximum Trade Duration (days): Default is 22 days.
- ATR Period: Default is 12.
- Use 3 Green Days Exit: Toggle to enable or disable the three-green-day exit condition.
How It Works
1. Entry: The strategy monitors daily price action for 3 consecutive down days. When this occurs and if the market is volatile enough (current ATR > 30-day ATR average), it opens a long position.
2. Exit: The position is closed if the price action reverses with 3 consecutive up days or if the trade has been open for the maximum allowed duration - i.e. use it on daily chart.
Risk Management
- The built-in maximum trade duration prevents trades from lingering too long in a non-trending or consolidating market.
- The volatility filter helps ensure that trades are only taken when there is sufficient price movement, potentially increasing the odds of a meaningful move.
Disclaimer
This strategy is provided “as is” without any warranties. It is essential to backtest and validate the performance on your specific instrument and market conditions before deploying live capital. Trading involves significant risk, and you should adjust parameters to match your risk tolerance.
Test and tweak this strategy to see if it fits your trading style and market conditions. Happy trading!

Candle Emotion Index (CEI) StrategyThe Candle Emotion Index (CEI) Strategy is an innovative sentiment-based trading approach designed to help traders identify and capitalize on market psychology. By analyzing candlestick patterns and combining them into a unified metric, the CEI Strategy provides clear entry and exit signals while dynamically managing risk. This strategy is ideal for traders looking to leverage market sentiment to identify high-probability trading opportunities.
How It Works
The CEI Strategy is built around three core oscillators that reflect key emotional states in the market:
Indecision Oscillator . Measures market uncertainty using patterns like Doji and Spinning Tops. High values indicate hesitation, signaling potential turning points.
Fear Oscillator . Tracks bearish sentiment through patterns like Shooting Star, Hanging Man, and Bearish Engulfing. Helps identify moments of intense selling pressure.
Greed Oscillator . Detects bullish sentiment using patterns like Marubozu, Hammer, Bullish Engulfing, and Three White Soldiers. Highlights periods of strong buying interest.
These oscillators are averaged into the Candle Emotion Index (CEI):
CEI = (Indecision + Fear + Greed) / 3
This single value quantifies overall market sentiment and drives the strategy’s trading decisions.
Key Features
Sentiment-Based Trading Signals . Long Entry: Triggered when the CEI crosses above a lower threshold (e.g., 0.1), indicating increasing bullish sentiment. Short Entry: Triggered when the CEI crosses above a higher threshold (e.g., 0.2), signaling rising bearish sentiment.
Volume Confirmation . Trades are validated only if volume exceeds a user-defined multiplier of the average volume over the lookback period. This ensures entries are backed by significant market activity.
Break-Even Recovery Mechanism . If a trade moves into a loss, the strategy attempts to recover to break-even instead of immediately exiting at a loss. This feature provides flexibility, allowing the market to recover while maintaining disciplined risk management.
Dynamic Risk Management . Maximum Holding Period: Trades are closed after a user-defined number of candles to avoid overexposure to prolonged uncertainty. Profit-Taking Conditions: Positions are exited when favorable price moves are confirmed by increased volume, locking in gains. Loss Threshold: Trades are exited early if the price moves unfavorably beyond a set percentage of the entry price, limiting potential losses.
Cooldown Period . After a trade is closed, a cooldown period prevents immediate re-entry, reducing overtrading and improving signal quality.
Why Use This Strategy?
The CEI Strategy combines advanced sentiment analysis with robust trade management, making it a powerful tool for traders seeking to understand market psychology and identify high-probability setups. Its unique features, such as the break-even recovery mechanism and volume confirmation, add an extra layer of discipline and reliability to trading decisions.
Best Practices
Combine with Other Indicators . Use trend-following tools (e.g., moving averages, ADX) and momentum oscillators (e.g., RSI, MACD) to confirm signals.
Align with Key Levels . Incorporate support and resistance levels for refined entries and exits.
Multi-Market Compatibility . Apply this strategy to forex, crypto, stocks, or any asset class with strong volume and price action.

Bullish Reversal Bar Strategy [Skyrexio]Overview
Bullish Reversal Bar Strategy leverages the combination of candlestick pattern Bullish Reversal Bar (description in Methodology and Justification of Methodology), Williams Alligator indicator and Williams Fractals to create the high probability setups. Candlestick pattern is used for the entering into trade, while the combination of Williams Alligator and Fractals is used for the trend approximation as close condition. Strategy uses only long trades.
Unique Features
No fixed stop-loss and take profit: Instead of fixed stop-loss level strategy utilizes technical condition obtained by Fractals and Alligator or the candlestick pattern invalidation to identify when current uptrend is likely to be over (more information in "Methodology" and "Justification of Methodology" paragraphs)
Configurable Trading Periods: Users can tailor the strategy to specific market windows, adapting to different market conditions.
Trend Trade Filter: strategy uses Alligator and Fractal combination as high probability trend filter.
Methodology
The strategy opens long trade when the following price met the conditions:
1.Current candle's high shall be below the Williams Alligator's lines (Jaw, Lips, Teeth)(all details in "Justification of Methodology" paragraph)
2.Price shall create the candlestick pattern "Bullish Reversal Bar". Optionally if MFI and AO filters are enabled current candle shall have the decreasing AO and at least one of three recent bars shall have the squat state on the MFI (all details in "Justification of Methodology" paragraph)
3.If price breaks through the high of the candle marked as the "Bullish Reversal Bar" the long trade is open at the price one tick above the candle's high
4.Initial stop loss is placed at the Bullish Reversal Bar's candle's low
5.If price hit the Bullish Reversal Bar's low before hitting the entry price potential trade is cancelled
6.If trade is active and initial stop loss has not been hit, trade is closed when the combination of Alligator and Williams Fractals shall consider current trend change from upward to downward.
Strategy settings
In the inputs window user can setup strategy setting:
Enable MFI (if true trades are filtered using Market Facilitation Index (MFI) condition all details in "Justification of Methodology" paragraph), by default = false)
Enable AO (if true trades are filtered using Awesome Oscillator (AO) condition all details in "Justification of Methodology" paragraph), by default = false)
Justification of Methodology
Let's explore the key concepts of this strategy and understand how they work together. The first and key concept is the Bullish Reversal Bar candlestick pattern. This is just the single bar pattern. The rules are simple:
Candle shall be closed in it's upper half
High of this candle shall be below all three Alligator's lines (Jaw, Lips, Teeth)
Next, let’s discuss the short-term trend filter, which combines the Williams Alligator and Williams Fractals. Williams Alligator
Developed by Bill Williams, the Alligator is a technical indicator that identifies trends and potential market reversals. It consists of three smoothed moving averages:
Jaw (Blue Line): The slowest of the three, based on a 13-period smoothed moving average shifted 8 bars ahead.
Teeth (Red Line): The medium-speed line, derived from an 8-period smoothed moving average shifted 5 bars forward.
Lips (Green Line): The fastest line, calculated using a 5-period smoothed moving average shifted 3 bars forward.
When the lines diverge and align in order, the "Alligator" is "awake," signaling a strong trend. When the lines overlap or intertwine, the "Alligator" is "asleep," indicating a range-bound or sideways market. This indicator helps traders determine when to enter or avoid trades.
Fractals, another tool by Bill Williams, help identify potential reversal points on a price chart. A fractal forms over at least five consecutive bars, with the middle bar showing either:
Up Fractal: Occurs when the middle bar has a higher high than the two preceding and two following bars, suggesting a potential downward reversal.
Down Fractal: Happens when the middle bar shows a lower low than the surrounding two bars, hinting at a possible upward reversal.
Traders often use fractals alongside other indicators to confirm trends or reversals, enhancing decision-making accuracy.
How do these tools work together in this strategy? Let’s consider an example of an uptrend.
When the price breaks above an up fractal, it signals a potential bullish trend. This occurs because the up fractal represents a shift in market behavior, where a temporary high was formed due to selling pressure. If the price revisits this level and breaks through, it suggests the market sentiment has turned bullish.
The breakout must occur above the Alligator’s teeth line to confirm the trend. A breakout below the teeth is considered invalid, and the downtrend might still persist. Conversely, in a downtrend, the same logic applies with down fractals.
How we can use all these indicators in this strategy? This strategy is a counter trend one. Candle's high shall be below all Alligator's lines. During this market stage the bullish reversal bar candlestick pattern shall be printed. This bar during the downtrend is a high probability setup for the potential reversal to the upside: bulls were able to close the price in the upper half of a candle. The breaking of its high is a high probability signal that trend change is confirmed and script opens long trade. If market continues going down and break down the bullish reversal bar's low potential trend change has been invalidated and strategy close long trade.
If market really reversed and started moving to the upside strategy waits for the trend change form the downtrend to the uptrend according to approximation of Alligator and Fractals combination. If this change happens strategy close the trade. This approach helps to stay in the long trade while the uptrend continuation is likely and close it if there is a high probability of the uptrend finish.
Optionally users can enable MFI and AO filters. First of all, let's briefly explain what are these two indicators. The Awesome Oscillator (AO), created by Bill Williams, is a momentum-based indicator that evaluates market momentum by comparing recent price activity to a broader historical context. It assists traders in identifying potential trend reversals and gauging trend strength.
AO = SMA5(Median Price) − SMA34(Median Price)
where:
Median Price = (High + Low) / 2
SMA5 = 5-period Simple Moving Average of the Median Price
SMA 34 = 34-period Simple Moving Average of the Median Price
This indicator is filtering signals in the following way: if current AO bar is decreasing this candle can be interpreted as a bullish reversal bar. This logic is applicable because initially this strategy is a trend reversal, it is searching for the high probability setup against the current trend. Decreasing AO is the additional high probability filter of a downtrend.
Let's briefly look what is MFI. The Market Facilitation Index (MFI) is a technical indicator that measures the price movement per unit of volume, helping traders gauge the efficiency of price movement in relation to trading volume. Here's how you can calculate it:
MFI = (High−Low)/Volume
MFI can be used in combination with volume, so we can divide 4 states. Bill Williams introduced these to help traders interpret the interaction between volume and price movement. Here’s a quick summary:
Green Window (Increased MFI & Increased Volume): Indicates strong momentum with both price and volume increasing. Often a sign of trend continuation, as both buying and selling interest are rising.
Fake Window (Increased MFI & Decreased Volume): Shows that price is moving but with lower volume, suggesting weak support for the trend. This can signal a potential end of the current trend.
Squat Window (Decreased MFI & Increased Volume): Shows high volume but little price movement, indicating a tug-of-war between buyers and sellers. This often precedes a breakout as the pressure builds.
Fade Window (Decreased MFI & Decreased Volume): Indicates a lack of interest from both buyers and sellers, leading to lower momentum. This typically happens in range-bound markets and may signal consolidation before a new move.
For our purposes we are interested in squat bars. This is the sign that volume cannot move the price easily. This type of bar increases the probability of trend reversal. In this indicator we added to enable the MFI filter of reversal bars. If potential reversal bar or two preceding bars have squat state this bar can be interpret as a reversal one.
Backtest Results
Operating window: Date range of backtests is 2023.01.01 - 2024.12.31. It is chosen to let the strategy to close all opened positions.
Commission and Slippage: Includes a standard Binance commission of 0.1% and accounts for possible slippage over 5 ticks.
Initial capital: 10000 USDT
Percent of capital used in every trade: 50%
Maximum Single Position Loss: -5.29%
Maximum Single Profit: +29.99%
Net Profit: +5472.66 USDT (+54.73%)
Total Trades: 103 (33.98% win rate)
Profit Factor: 1.634
Maximum Accumulated Loss: 1231.15 USDT (-8.32%)
Average Profit per Trade: 53.13 USDT (+0.94%)
Average Trade Duration: 76 hours
How to Use
Add the script to favorites for easy access.
Apply to the desired timeframe and chart (optimal performance observed on 4h ETH/USDT).
Configure settings using the dropdown choice list in the built-in menu.
Set up alerts to automate strategy positions through web hook with the text: {{strategy.order.alert_message}}
Disclaimer:
Educational and informational tool reflecting Skyrex commitment to informed trading. Past performance does not guarantee future results. Test strategies in a simulated environment before live implementation
These results are obtained with realistic parameters representing trading conditions observed at major exchanges such as Binance and with realistic trading portfolio usage parameters.

E9 Shark-32 Pattern Strategy The E9 Shark-32 Pattern is a powerful trading tool designed to capitalize on the Shark-32 pattern—a specific Candlestick pattern.
The Shark-32 Pattern: What Is It?
The Shark-32 pattern is a technical formation that occurs when the following conditions are met:
Higher Highs and Lower Lows: The low of two bars ago is lower than the previous bar, and the previous bar's low is lower than the current bar. At the same time, the high of two bars ago is higher than the previous bar, and the previous bar’s high is higher than the current bar.
This unique setup forms the "Shark-32" pattern, which signals potential volume squeezes and trend changes in the market.
How Does the Strategy Work?
The E9 Shark-32 Pattern Strategy builds upon this pattern by defining clear entry and exit rules based on the pattern's confirmation. Here's a breakdown of how the strategy operates:
1. Identifying the Shark-32 Pattern
When the Shark-32 pattern is confirmed, the strategy "locks" the high and low prices from the initial bar of the pattern. These locked prices serve as key levels for future trade entries and exits.
2. Entry Conditions
The strategy waits for the price to cross the pattern's locked high or low, signaling potential market direction.
Long Entry: A long trade is triggered when the closing price crosses above the locked pattern high (green line).
Short Entry: A short trade is triggered when the closing price crosses below the locked pattern low (red line).
The strategy ensures that only one trade is taken for each Shark-32 pattern, preventing overtrading and allowing traders to focus on high-probability setups.
3. Stop Loss and Take Profit Levels
The strategy has built-in risk management through stop-loss and take-profit levels, which are visually represented by the lines on the chart:
Stop Loss:
Stop loss can be adjusted in settings.
Take Profit:
For long trades: The take-profit target is set at the upper white dotted line, which is projected above the pattern high.
For short trades: The take-profit target is set at the lower white dotted line, which is projected below the pattern low.
These clearly defined levels help traders to manage risk effectively while maximizing potential returns.
4. Visual Cues
To make trading decisions even easier, the strategy provides helpful visual cues:
Green Line (Pattern High): This line represents the high of the Shark-32 pattern and serves as a resistance level and short entry signal.
Red Line (Pattern Low): This line represents the low of the Shark-32 pattern and serves as a support level and long entry signal.
White Dotted Lines: These lines represent potential profit targets, projected both above and below the pattern. They help traders define where the market might go next.
Additionally, the strategy highlights the pattern formation with color-coded bars and background shading to draw attention to the Shark-32 pattern when it is confirmed. This adds a layer of visual confirmation, making it easier to spot opportunities in real-time.
5. No Repeated Trades
An important aspect of the strategy is that once a trade is taken (either long or short), no additional trades are executed until a new Shark-32 pattern is identified. This ensures that only valid and confirmed setups are acted upon.

Trend-based Price Action StrategyThis is a strategy script that combines trend-based price action analysis with the Relative Strength Index (RSI) and Exponential Moving Averages (EMA) as trend filters. Here's a summary of the key components and logic:
Price Action Candlestick Patterns:
Bullish patterns: Engulfing candle and Morning Star.
Bearish patterns: Engulfing candle and Evening Star.
RSI Integration:
RSI is used to identify overbought and oversold conditions.
EMA Trend Filter:
Three EMAs with different periods: Fast , Medium and Slow.
Long trend condition occur when the fast EMA is above the medium and the medium is above the slow EMA.
Short trend condition occur when the slow EMA is above the medium and the medium is above the fast EMA.
Long entry conditions: RSI is oversold, RSI is decreasing, bullish candlestick pattern, and EMA trend filter conditions are met.
Short entry conditions: RSI is overbought, RSI is decreasing, bearish candlestick pattern, and EMA trend filter conditions are met.
Exit conditions:
Take profit or stop loss is reached.
Plotting:
Signals are plotted on the chart when entry conditions are met.
EMAs are plotted when the EMA trend filter is enabled.
This script aims to capture potential trend reversal points based on a combination of candlestick patterns, RSI, and EMA trend analysis.
Traders can use this script as a starting point for further customization or as a reference for developing their own trading strategies. It's important to note that past performance is not indicative of future results, and thorough testing and validation are recommended before deploying any trading strategy.

Buy&Sell Bullish Engulfing - The Quant Science🇺🇸
GENERAL OVERVIEW
Buy&Sell Bullish Engulfing - The Quant Science It is a Buy&Sell strategy based on the 'Bullish Engulfing' candlestick pattern. The main goal of the strategy is to achieve a consistent and sustainable return over time, with a manageable level of risk.
Bullish Engulfing
The template was developed at the top of the Indicator provided by TradingView called 'Engulfing - Bullish'.
ENTRY AND EXIT CRITERIA
Entry: A single long order is opened when the candlestick pattern is formed, and the percentage size of the order (%) is fixed by the trader through the user interface.
Exit: The long trade is closed on a percentage equity take profit-stop loss.
----------------------------------------------------------------------------------------------------------------------------------------------------------------------------------------------
🇮🇹
PANORAMICA GENERALE
Buy&Sell Bullish Engulfing - The Quant Science è una strategia Buy&Sell basata sul candlestick pattern 'Bullish Engulfing'. L'obiettivo principale della strategia è ottenere un ritorno costante e sostenibile nel tempo, con un livello gestibile di rischio.
Bullish Engulfing
Il template è stato sviluppato al top dell' Indicatore fornito da Trading View chiamato 'Engulfing - Bullish'.
CRITERI DI ENTRATA E USCITA
Entrata: viene aperto un singolo ordine long quando si forma il candlestick pattern, la size percentuale dell'ordine (%) viene selezionato tramite l'interfaccia utente dal trader.
Uscita: la chiusura della posizione avviene unicamente tramite un take profit-stop loss percentuale calcolato sul capitale.

V Bottom & V Top Pattern [Misu]█ This indicator shows V bottom & V top patterns as well as potential V bottom & V top.
These V bottom & V top are chart powerful reversal patterns.
They appear in all markets and time-frames, but due to the nature of the aggressive moves that take place when a market reverses direction, it can be difficult to identify this pattern in real-time.
To address this problem, I added potential V pattern as well as the confirmed one.
█ Usages:
You can use V top & V bottoms for reversal zones.
You can use it for scalping strategies, as a main buy & sell signal.
Potential V patterns can be used to anticipate the market, in addition to volatility or momentum indicators, for example.
█ How it works?
This indicator uses pivot points to determine potential V patterns and confirm them.
Paramaters are available to filter breakouts of varying strengths.
Patterns also have a "max number bars" to be validated.
█ Why a Strategy type indicator?
Due to the many different parameters, this indicator is a strategy type.
This way you can overview the best settings depending on your pair & timeframe.
Parameters are available to filter.
█ Parameters:
Deviation: Parameter used to calculate parameters.
Depth: Parameter used to calculate parameters.
Confirmation Type: Type of signal used to confirme the pattern.
> Mid Pivot: pattern will confirm on mid pivot breakout.
> Opposit Pivot: pattern will confirm on opposit pivot breakout.
> No confirmation: no confirmation.
Lenght Avg Body: Lenght used to calculate the average body size.
First Breakout Factor: This factor multiplied by the "body avg" filters out the non-significant breakout of potential V pattern.
Confirmation Breakout Factor: This factor multiplied by the "body avg" filters out the non-significant breakout for the confirmation.
Max Bars Confirmation: The maximum number of bars needed to validate the pattern.

3LS | 3 Line Strike Strategy [Kintsugi Trading]What is the 3LS | 3 Line Strike Strategy?
Incorporating the 3 Line Strike candlestick pattern into our strategy was inspired by Arty at The Moving Average and the amazing traders at TheTrdFloor .
The Three Line Strike is a trend continuation candlestick pattern consisting of four candles. Depending on their heights and collocation, a bullish or a bearish trend continuation can be predicted.
In a symphony of trend analysis, price action, and volume we can find and place high-probability trades with the 3LS Strategy.
How to use it!
----- First, start by choosing a Stop-Loss Strategy, Stop PIP Size, and Risk/Reward Ratio -----
- Stop-Loss Strategy
Fixed PIP Size – This uses the top/bottom of the indicator candle and places a TP based on the chosen Risk:Reward ratio.
ATR Trail (No set Target Profit, only uses ATR Stop)
ATR Trail-Stop (Has set Target Profit, however, stop is based on ATR inputs)
**If you choose an ATR Stop-Loss Strategy - input the desired ATR period and Multiple you would like the stop to be calculated at**
**ATR Stop-Loss Strategies have a unique alert setup for Auto-Trading. See Auto-Trading Section**
- Risk/Reward Ratio = If you have a .5 risk/reward, it means you are risking $100 to make $50.
- Additional Stop PIP Size = Number of PIPs over the default stop location of the top or bottom of the indicator candle.
----- Next, we set the Session Filter -----
Set the Timezone and Trade Session you desire. If no specific session is desired, simply set the Trade Session to 00:00 - 00:00.
----- Next, we set the Moving Average Cloud Fill -----
Enter the Fast and Slow Moving Average Length used to calculate trend direction:
MA Period Fast
MA Period Slow
These inputs will determine whether the strategy looks for Long or Short positions.
----- Next, we set the VSA – Volume Spread Analysis Settings -----
Check the box to show the indicator at the bottom of the chart if desired.
This is just a different visual output of the VSA | Volume Spread Analysis indicator available for free under the community indicators tab. You can add that indicator to your chart and see the same output in candle format.
In combination with the Moving Average Cloud, the Volume Spread Analysis will help us determine when to take a trade and in what direction.
The strategy is essentially looking for small reversals going against the overall trend and placing a trade once that reversal ends and the price moves back in the direction of the overall trend.
The 3LS Strategy utilizes confirmation between trend, volume, and price action to place high probability trades.
The VSA is completely customizable by:
Moving Average Length
MA-1 Multiplier
MA-2 Multiplier
MA-3 Multiplier
Check out the VSA | Volume Spread Analysis indicator in the community scripts section under the indicators tab to use this awesome resource on other strategies.
----- Next, we have the option to view the automated KT Bull/Bear Signals -----
Check the boxes to show the buy-sell signal on the chart if desired.
----- Next, we set the risk we want to use if Auto Trading the strategy -----
I always suggest using no more than 1-3% of your total account balance per trade. Remember, if you have multiple strategies triggering per day with each using 1%, the total percent at risk will be much larger.
For Example – if you have 10 strategies each risking 1% your total risk is 10% of your account, not 1%! Be mindful to only use 1-3% of your total account balance across all strategies, not just each individual one.
----- Finally, we backtest our ideas -----
After using the 'Strategy Tester' tab on TradingView to thoroughly backtest your predictions you are ready to take it to the next level - Automated Trading!
This was my whole reason for creating the script. If you work a full-time job, live in a time zone that is hard to trade, or just don't have the patience, this will be a game-changer for you as it was for me.
Auto-Trading
When it comes to auto-trading this strategy I have included two options in the script that utilize the alert messages generated by TradingView.
*Note: Please trade on a demo account until you feel comfortable enough to use real money, and then please stick to 1%-2% of your total account value in risk per trade.*
AutoView
PineConnector
**ATR Auto-Trading Alert Setup**
How to create alerts on 3 Line Strike Strategy
For Trailing Stops:
1) Adjust autoview/pineconnector settings
2) Click "add alert"
3) Select "Condition" = Strategy Name
4) Select "Order Fills Only" from the drop-down
3) Remove template message text from "message" box and place the exact text. '{{strategy.order.alert_message}}'
4) Click "create"
For Fixed Pip Stop:
1) Adjust autoview/pineconnector settings
2) Click "add alert"
3) Select "Condition" = Strategy Name
4) Select "alert() function calls only"
5) I like to title my Alert Name the same thing I named it as an Indicator Template to keep track
Good luck with your trading!

3 Candle Strike StretegyMainly developed for AMEX:SPY trading on 1 min chart. But feel free to try on other tickers.
Basic idea of this strategy is to look for 3 candle reversal pattern within trending market structure. The 3 candle reversal pattern consist of 3 consecutive bullish or bearish candles,
followed by an engulfing candle in the opposite direction. This pattern usually signals a reversal of short term trend. This strategy also uses multiple moving averages to filter long or short
entries. ie. if the 21 smoothed moving average is above the 50, only look for long (bullish) entries, and vise versa. There is option change these moving average periods to suit your needs.
I also choose to use Linear Regression to determine whether the market is ranging or trending. It seems the 3 candle pattern is more successful under trending market. Hence I use it as a filter.
There is also an option to combine this strategy with moving average crossovers. The idea is to look for 3 candle pattern right after a fast moving average crosses over a slow moving average.
By default , 21 and 50 smoothed moving averages are used. This gives additional entry opportunities and also provides better results.
This strategy aims for 1:3 risk to reward ratio. Stop losses are calculated using the closest low or high values for long or short entries, respectively, with an offset using a percentage of
the daily ATR value. This allows some price fluctuation without being stopped out prematurely. Price target is calculated by multiplying the difference between the entry price and the stop loss
by a factor of 3. When price target is reach, this strategy will set stop loss at the price target and wait for exit condition to maximize potential profit.
This strategy will exit an order if an opposing 3 candle pattern is detected, this could happen before stop loss or price target is reached, and may also happen after price target is reached.
*Note that this strategy is designed for same day SPY option scalping. I haven't determined an easy way to calculate the # of contracts to represent the equivalent option values. Plus the option
prices varies greatly depending on which strike and expiry that may suits your trading style. Therefore, please be mindful of the net profit shown. By default, each entry is approximately equal
to buying 10 of same day or 1 day expiry call or puts at strike $1 - $2 OTM. This strategy will close all open trades at 3:45pm EST on Mon, Wed, and Fri.
**Note that this strategy also takes into account of extended market data.
***Note pyramiding is set to 2 by default, so it allows for multiple entries on the way towards price target.
Remember that market conditions are always changing. This strategy was only able to be back-tested using 1 month of data. This strategy may not work the next month. Please keep that in mind.
Also, I take no credit for any of the indicators used as part of this strategy.
Enjoy~

Same high/lowIf you are using support/resistance level-based strategies in your trading then this indicator can help you. I think that the retest level strategy is the best for beginners due to its simplicity of risk/reward calculations and higher abundance on the market. There is a well-known method to recognize a big player (buyer/seller) by candlestick pattern where the last two candles have the same low or same high. Moreover, abnormal candles increase the probability of a retest of a strong level, so my indicator highlights these two situations. In my opinion, a higher timeframe of a candle chart increases the win rate for this indicator (>1h).
So there are several patterns which my indicator can recognize:
1. Same low/high: blue flag up - same low, blue flag down - same high.
2. Mirror levels: high-low - green flag up, low-high - green flag down.
3. abnormal candles: yellow body if >2*ATR (please tune atr in properties, the default value is 5).
4. The red flag indicates the third candle with the same high/low in a row.
Thanks for your attention and have a good trading time!

Hammers & Stars StrategyOverview
This script trades basic hammer and shooting star candlestick patterns.
It's an extremely simple strategy with minimal filters, and according to my personal manual backtesting and automated trading results, performs best on the Daily chart on certain forex pairs.
It is intended to be traded on the forex markets but theoretically should work on all markets (especially if you optimize the settings).
The script also comes with complete AutoView automation for Oanda.
Make sure you've connected AutoView to TradingView and Oanda, then simply set an alert using the "alert() function calls only" condition and it will automatically execute trades based on whatever settings you've selected (only recommended for experienced traders - use at your own risk!)
If you're not sure how to set up AutoView, search "The Art of Trading AutoView Guide" on YouTube to find my detailed video guide.
Check out my website and YouTube channel for more information, scripts, resources and free Pine Script & trading lessons (link in my profile).
Best of luck with your trading!
- Matt / The Art of Trading
Settings Menu
Tooltips are included explaining what the various settings do, but here's a quick summary:
Strategy Settings
>= ATR Filter: Minimum size of entry candle compared to ATR
<= ATR Filter: Maximum size of entry candle compared to ATR
Stop Loss ATR: Stop loss multiplier (x ATR)
R:R: Risk:Reward profile
Fib Level: Used to calculate upper/lower third of candle. (For example, setting it to 0.5 will mean hammers must close >= 50% mark of the total candle size)
Start Date Filter: Date & time to begin trading from
End Date Filter: Date & time to stop trading
AutoView Oanda Settings
Use Oanda Demo: If turned on then oandapractice broker prefix will be used for AutoView alerts (demo account). If turned off then live account will be used
Use Limit Order: If turned on then AutoView will use limit orders. If turned off then market orders will be used (recommended to use limit order to mitigate spread issues)
Days To Leave Limit Order: This is your GTD setting (good til day)
Account Balance: Your account balance (used for calculating position size)
Account Currency: Your account balance currency (used for calculating position size)
Risk Per Trade %: Your risk per trade as a % of your account balance

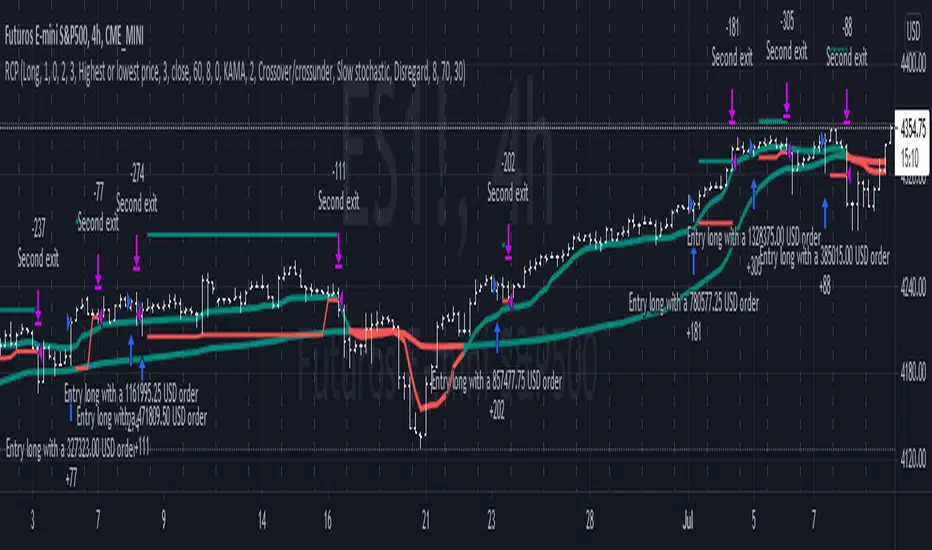
Reversal closing priceThe reversal closing price (RCP) is a candlestick pattern which follows two simples rules:
the low price of current candle needs to be lower than the low price of the last 2 candles
the closing price of current candle needes to be higher than the closing price of the last candle
This generates a signal for a long position. For a short position, the conditions are inverted:
the high price of current candle needs to be higher than the high price of the last 2 candles
the closing price of current candle needes to be lower than the closing price of the last candle
Since RCP is a trend follower indicator, the strategy is programmed in such a way that long positions are only placed if the short period EMA is above the long period EMA, and short positions are only placed if the short EMA is bellow the long EMA. Both periods are configurable, and should be ajusted for each asset.
This strategy uses a fixed stop loss and take profit, and the it's ratio is configurable. The stop price is one tick lower than the lowest price of X candles prior to the order execution for long positions, while in short positions it's one tick higher than the higher price. The amount of candles to lookback (X) is configurable. Both stop and take profit prices are displayed, the first as a red line, and the second as a green line.
This is the setting that I've found to work best with TVC:SPX , but you may find a better setting. While the RCP is universal, it's placement depends on the trend and it's strenght, something that is very heterogeneous among assets.
I really wish that I was able to place images, but I don't have PRO, so text will have to do.
This strategy was designed by Alexandre Wolwacz, a.k.a. Stormer.
Candle checker for long/short for scalping/day tradingHey.
This strategy is still in working.
For it I check a x amount of candles in the past if they been for example all red/green in row, and based on that I enter. For example candle 7 < candle 6 .... candle 3 < candle 2 .... candle 1 < candle current for long and viceversa for short.
After that,once the trade is initiated, I exit based on 2 possibilities : candle color is different than the color of candle when entry, or based tp/sl.
Let me know what you think of it.
I will try to make the process to calculate automatically and input the number of candles to check like 5-10-15 and so on.

BEST Engulfing + Breakout StrategyHello traders
This is a simple algorithm for a Tradingview strategy tracking a convergence of 2 unrelated indicators.
Convergence is the solution to my trading problems.
It's a puzzle with infinite possibilities and only a few working combinations.
Here's one that I like
- Engulfing pattern
- Price vs Moving average for detecting a breakout
Definition
Take out the notebooks :) and some coffee (good for focus). I'm bullish in coffee
The engulfing pattern is a two-candle reversal pattern.
The second candle completely ‘engulfs’ the real body of the first one, without regard to the length of the tail shadows.
The bullish Engulfing pattern appears in a downtrend and is a combination of one red candle followed by a larger green candle
The bearish Engulfing pattern appears in a downtrend and is a combination of one green candle followed by a larger red candle
Example: imgur.com
We're bored sir... what's the point of all this?
In summary, an engulfing is a pattern to track reversals. (the whole TradingView audience stands up now giving a standing ovation)
Adding the Price vs Moving average filters allows to track reversals with momentums (half of the audience collapsed because this is too awesome)
Ok sir... you picked up my interest
I included some cool backtest filters:
- date range filtering
- flexible take profit in USD value (plotted in blue)
- flexible stop loss in USD value (plotted in red)
All the best
Dave

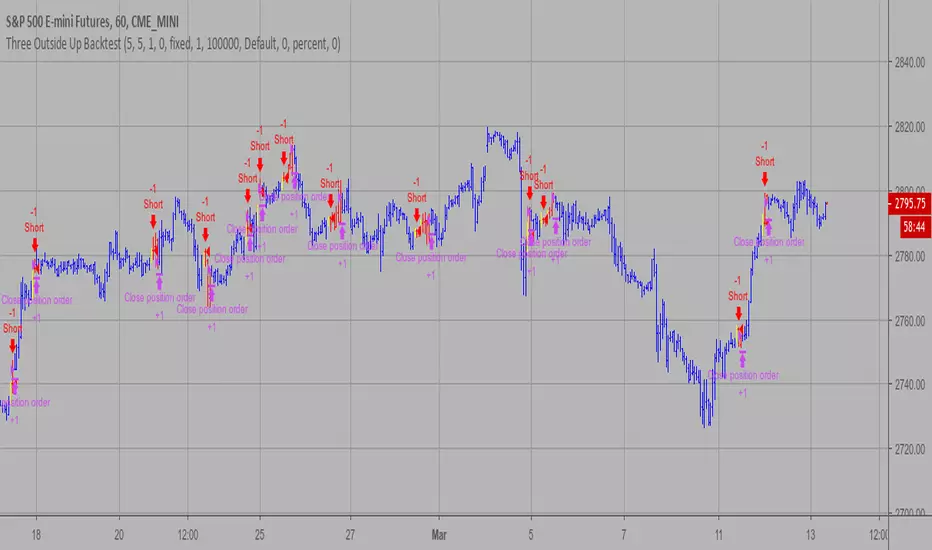
Three Outside Up Backtest This is a three candlestick bullish reversal pattern consisting of a bullish
engulfing pattern formed by the first two candlesticks then followed by an up
candlestick with a higher close than the prior candlestick.
WARNING:
- For purpose educate only
- This script to change bars colors.
Three Outside Down Backtest This is a three candlestick bearish reversal pattern consisting of a bearish
engulfing pattern formed by the first two candlesticks then followed by a down
candlestick with a lower close than the prior candlestick.
WARNING:
- For purpose educate only
- This script to change bars colors.

Candlestick Signals StrategyThis strategy allows you to pick from 9 different candlestick patterns, and test them against historical data from your chart. You can get a good idea what patterns work best for each chart by turning each pattern on and off in the settings.

Dark Cloud Backtest This is a bearish reversal pattern formed by two candlesticks within a uptrend.
Consists of an up candlestick followed by a down candlestick which opens lower
than the prior candlestick and closes below the midrange of the prior candlestick.
It is the reverse of the Piercing Line.
WARNING:
- For purpose educate only
- This script to change bars colors.

Bearish Engulfing Backtest This is a bearish candlestick reversal pattern formed by two candlesticks.
Following an uptrend, the first candlestick is a up candlestick which is
followed by a down candlestick which has a long real body that engulfs or
contains the real body of the prior bar. The Engulfing pattern is the reverse
of the Harami pattern.
WARNING:
- For purpose educate only
- This script to change bars colors.
