Dow Jones 5 Minutes Up Down Scalp with extratradeAfter my DJI 15M Scalper -> here is the 5 Min Scalper.
Only with DJI 5 Min!
No Stop LOSS!!
中心震荡指标

Up Down Scalp for DJI only!I programmed this Robot for the 15 Min DJI with the optimum Parameters. (Wall Street CFD FOREXCOM:DJI )
Hope you like it.
:)

Commodity Channel Index with Hull MAExperimental strategy, try changing the settings etc
feedback welcome for any timeframe/pair profitable settings

Kirin Strategy [Eric]This is a long term buy/sell strategy, with leverage 1x it can flip into 130 times within 300 trades.

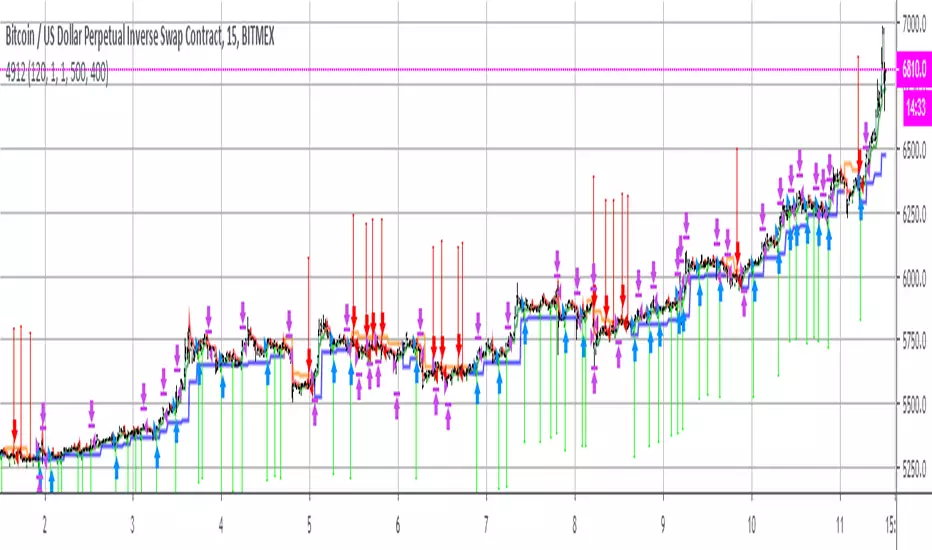
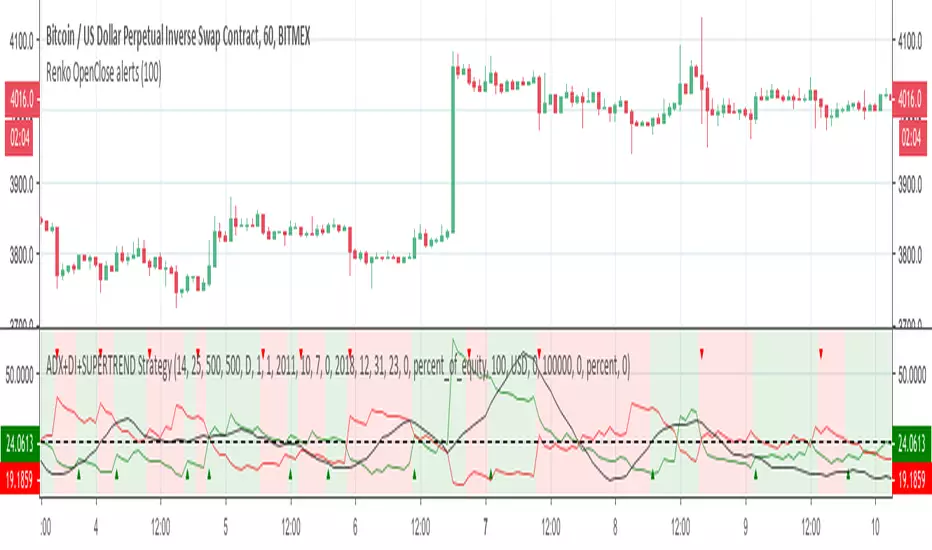
ADX+DI+SUPERTREND StrategyThis strategy is a port of famous script from MasaNakamura ADX and DI.
Here is the exact startegy from original study from MasaNakamura MasaNakamura at
In this version, I added also SUPERTREND as filter!
Scope of this port is to identify corrects inputs to get best results from signals that indicator gives.
I added the possibility to choose stop loss and take profits and to smooth the results also with heikin ashi candles.
Please use comment section for any feedback.
Next improvement (only to whom is interested to this script and follows me): study with alerts on multiple tickers all at one. Leave a comment if you want to have access to study.
********************************** IMPORTANT*******************************
I have developed an expert advisor for metatrader4 (MT4) and for jforex platform: results of expert advisor form 2015-01-01 to 2018-11-25 are very good with low drawdown and good profit.
********************************************************************************
ADX and DI StrategyThis strategy is a port of famous script from MasaNakamura ADX and DI
Original study from MasaNakamura MasaNakamura at
Scope of this port is to identify corrects inputs to get best results from signals that indicator gives.
I added the possibility to choose stop loss and take profits and to smooth the results also with heikin ashi candles.
Please use comment section for any feedback.
Next improvement (only to whom is interested to this script and follows me): study with alerts on multiple tickers all at one. Leave a comment if you want to have access to study.
********************************** IMPORTANT*******************************
I have developed an expert advisor for metatrader4 (MT4) and for jforex platform: results of expert advisor form 2015-01-01 to 2018-11-25 are very good with low drawdown and good profit.
********************************************************************************

STOCH MACD SAR RSI V2 STRAT 15M// Strategy based on Stochastic Oscillator ( STOCH ), Moving Average Convergence / Divergence ( MACD ), Parabolic Stop and Reverse (PSAR) and Relative Strength Index (RSI)
// In the second version RSI added
// Adapted for15M time frame
// Created and based on Binance chart
// Working with comission
// No repaints

Rainbow MA10 with Signal Strategy Version by letsplayantsRainbow MA10 with Signal Strategy Version
Just One for Man.

MACD/EMA Long StrategyThis incredibly simple strategy uses a combination of the 20 EMA and bullish/bearish MACD crosses as a low risk method of getting in and out of markets.
Depending on whether the market is above or below the 200 SMA, the script determines if the market is in bullish or bearish territory. Above the 200 SMA, the script will ignore the 20 EMA as a buy condition and buy solely on the confirmation of a bullish MACD cross upon the close of a candle. In this bullish market, the script will only enable the sell condition if both the MACD is bearish AND a close below the 20 EMA occurs. This is to reduce the chances of the script selling prematurely in the event of a bearish MACD cross, if the market is still in overall bullish territory.
When the market is below the 200 SMA, the confirmation occurs in the opposite direction. The buy condition will only be met if both the MACD is bullish AND a close above the 20 EMA occurs. However, the sell condition ignores the 20 EMA and will sell solely on the confirmation of a bearish MACD cross upon the close of the candle.
This strategy can be used in both bullish and bearish markets. This conservative strategy will slightly underperform in a bull market, with the sell condition occasionally being met and then potentially buying back higher. However, it will successfully get you out of a turning market and automatically switch into a more 'risk-off' mentality during a bear market. This strategy is not recommended for sideways markets, as trading around the 20 EMA coupled with a relatively flat MACD profile can cause the strategy to buy the peaks and sell troughs easily.

MACD_Long_OnlyI created this indicator to calculate the gains that can be made purely by going long on the market. For exchanges without the ability to short, the standard MACD strategy is unable to accurately calculate the profit/loss from entering and exiting a position, as it includes profit/loss from actively shorting the market, which may either not be possible, or be undesirable for a specific asset.

Remora v16.x - aka ‘Crazy Willy’ - TESTERRemora v16 (aka ‘Crazy Willy’) introduced trailing stops, and like 'Cetus' represents the culmination of everything we know to be working, at this time. It is the last variant before 'Intensity' and the histogram.
Backtesting includes .25% commission, but not slippage.

Mby_test straegythis indicator based on Mby_stoch and CCI flow +etc
this indicator got about 66% benefits.


MOMENTUM INDICATOR / INVERS FISHER / RSI / MTF / STRAT// Strategy based on Momentum indicator and Inverse Fisher transform with Multi Time Frame function on Relative Strength Index (RSI)
// Greatest effect on 15M+ time frame
// Created and based on Binance chart
// Working with comission
// No repaints

Momentum Indicator Strategy 15m// Strategy based on Momentum Indicator
// Greatest effect on 15M time frame
// Created and based on Binance chart
// Working with comission
// No repaints

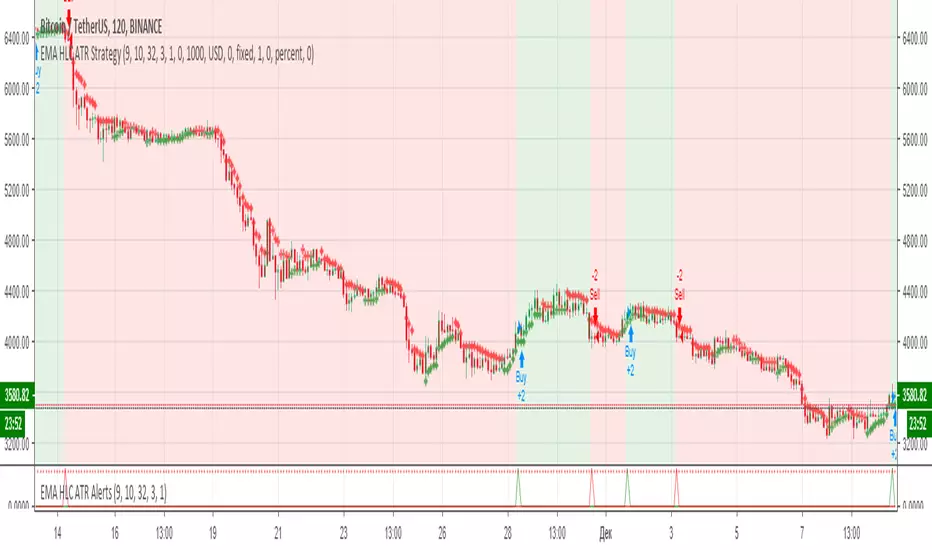
EMA HLC ATR Strategy// Strategy based on EMA HLC ATR Indicators
// Greatest effect on 2H time frame
// Created and based on Binance chart
// Working with comission
// No repaints

Adjustable MACD StrategyThis script provide a backtest version MACD, and provide some adjustable options.
Heize Signal V3헤이즈 시그널의 버전3인 "채널 전략"입니다. 헤이즈 시그널 버전 1과 같이 사용하면 하루에 진입 기회가 30번정도 나오게 됩니다.
15틱 익절/35틱 손절이였을때 아래의 수익과 승률, 최대손실폭을 확인해주시기 바랍니다.
수수료 전부 포함한 값입니다. (승률이 높기 때문에 리스크:보상 비율이 낮아도 이기는 전략이 됩니다.)
손절틱과 익절틱을 사용해 뇌동을 방지하며 매매할 수 있습니다.
imgur.com
감사합니다.
--------------------------------------------------------------------------------------------------------------------------------------
The version 3 of Heize Signal Strategy is now available. You can use it with version 1 to get more than 30 profitable entries in a day.
It is set to 15 pips for TP, 35 pips for SL. (The win rate is high enough to cover low R:R).
Please check profits/win rate/max drawdowns below. Commission is set to $3 per trades.
Thanks.
지표 체험과 문의는 개인 메세지로 주시면 되겠습니다.
PM me for trials/access.


B3 FisherTransform TraderB3 Fisher Transform Trader ~ As you may have found, Fisher Transform (FT) is not an easy beast to tame. However, I have never seen an indicator so consistently early to a move, so, I had to pry into it some more. I tend to stick with indicators that work on many symbols and time-frames, but FT isn't one of them. For starters, I only had a small amount of success in back-tests and only with stocks not futures. I did find however that when set to 9-10 and tightly trailed with a signal average and then put to a intermediate chart like 2h to day bars, it seems to have a nice sweet space in back-tests. I found this to work in multiple platforms, and after plenty of testing, I came up with a few personal tweaks to the indicator. Then walking forward the tests have played out like the back-testing, which is key!
Each symbol you trade will have a sweet spot bar interval in that intermediate area, so long as you keep the input setting to 9-10 for the FT and 2-3 for the signal average length. You are welcome to test well beyond these parameters . :)
Here is a quick view of the success the system has had trading AAPL in binary long or short at all times fashion over the last 10 years.
virtuosotrader.files.wordpress.com
~B3

Multiple MACD RSI simple strategySimple strategy script I've had for a while but looks like I never published.
Although it is one of my most simple it seems to have the best profitability. It is pretty rough though. the Stoch RSI has only a little weight to the trade trigger. I'll refine it more over time or you can by all means. Basically the Stoch RSI current K line has to be OVER 40 to trigger a SELL. It has no effect on buy side.
The triggers are roughly as follows:
Year - since so many assets have gone 2x, 3x, 10x+ since 2013 having a strategy that earns a 500% return from 2013 to now isn't that good if buy-and-holding would have got you 800%. This eliminates some of that noise and makes it a little easier to quickly gauge success. So buy/sell trigger need a value of greater or equal to 2018 (default)
MACD 1 - First MACD (short) needs to indicate greater than 0 to buy or less than 0 to sell.
MACD 2 - Same as MACD1 but for second MACD set (long)
Uptrend - Latest close + high divided by last periods close + high needs to be grater than 1. So if latest is 34.30 close and 34.60 high and previous interval is 34.80 close and 34.82 high, that is 0.99 and will not trigger a buy trade.
Downtrend - Same thing but close + low and less than 1.
This script/strategy is pretty rough but if there is interest I'll polish it more since it is a pretty solid but simple strategy for most assets.
