Swing H/L with EMAIndicator uses pivot points to mark swing highs (LH/HH) and swing lows (HL/LL),this strategy detects swing structure (HH/LL) and confirms them with EMA crossovers where a ❤︎ symbol will be added above swing H and below swing L.
A Buy signal is generated after the Last H is broken and a bullish signal appears. When the condition is met, the indicator will place a label ‘B’.
A Sell signal is generated after the Last L is broken and a bearish signal appears. When the condition is met, the indicator will place a label ‘S’.
Buy or Sell signals will be recalculated each time when H or L is broken.
图表形态

BSL/SSL Sweep + FVG Strategy Jobin (c) The New York ATM Model is a structured intraday strategy designed to capture algorithmic stop-hunts and reversals during the New York session open. It focuses on liquidity sweeps—either Buy-Side or Sell-Side—followed by a confirmation using Fair Value Gaps (FVGs).

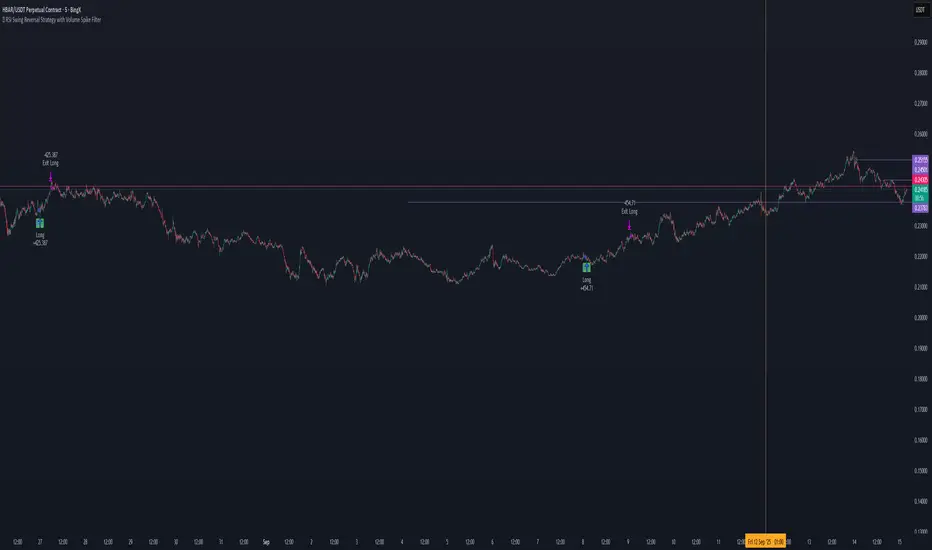
📊 RSI Swing Reversal Strategy with Volume Spike FilterHi , i did test that on Hbar time frame 5min. please let me know if i did miss something .85% win rate. please get back test.
What Will This Strategy Do?
Use RSI cross over/under its MA + Swing High/Low + optional Trend Filter.
Enter long on bullish signals.
Enter short on bearish signals.
Exit on opposite signals or optional take-profit/stop-loss.
Killzones SMT + IFVG detectorKillzones SMT + IFVG Detector
Summary
This strategy implements a specific intraday workflow inspired by ICT-style concepts.
It combines:
Killzone session levels (recording untouched highs/lows)
SMT divergence between NQ and ES (exclusive sweep logic)
IFVG confirmation (3-bar imbalance + width filter + inversion guard)
and an optional smart exit engine
The components are not simply mashed together: they interact in sequence.
A setup only confirms if all conditions line up (time window → untouched level sweep → divergence → valid IFVG → confirmation candle → risk filter).
Workflow
Killzones & session levels
Tracks highs/lows inside default killzones (19:00–23:00, 01:00–04:00, 08:30–10:00, 11:00–12:00, 12:30–15:00, chart timezone).
Stores untouched levels forward; sweeps trigger candidate signals.
SMT divergence (exclusive sweep)
Bullish SMT : one index sweeps its low while the other remains above its session low.
Bearish SMT : one index sweeps its high while the other remains below its session high.
Detection supports “Sweep (Cross)” or “Exact Tick.”
Session IDs are tracked so once a side has fired, later re-touches can’t re-trigger .
IFVG confirmation
Locks the first valid 3-bar IFVG after SMT.
Confirmation requires a candle close beyond the IFVG boundary in the direction of the close.
IFVGs must meet a minimum width filter (default 1.0 point).
Inversion guard: ignores IFVGs already inverted before SMT.
Optional “re-lock” keeps tracking the latest IFVG until confirmation/expiry.
Smart exit engine
Initial stop from opposite wick (+ buffer).
Fixed TP (default 40 points).
Dynamic stop escalation at progress thresholds (BE → 50% → 80% of target).
Safety gates
Weekend lockout (Fri 16:40 → Sun 18:00).
Same-bar sweep of high & low cancels setups.
Max initial stop filter skips oversized setups.
Optional cooldown bars.
Alerts
SMT Bullish/Bearish : divergence detected this bar.
Confirm Long/Short : IFVG confirmation triggered.
Default Strategy Properties (used in screenshots/backtests)
Initial capital: $25,000
Order size: 1 contract
Commission: $1.25 per contract per side
Slippage: 2 ticks
Backtest window: Jun 16, 2025 – Sep 14, 2025
These settings are intentionally conservative. If you change them, your results will differ.
How to use
Apply on an NQ or ES futures chart (1–5 min).
Choose your killzones and detection mode.
Select confirmation symbol (NQ, ES, or “Sweeper”).
Enable/disable IFVG re-lock.
Review signals and use alerts for automation if desired.
Limitations
Strict filters reduce trade count; extend backtest window for more samples.
Works best on NQ/ES; not validated elsewhere.
Past performance is not indicative of future results.
This is an educational tool ; not financial advice.

RSI DCA StrategyThis strategy combines RSI oversold signals with a Dollar-Cost Averaging (DCA) buying approach.
Trigger:
When the RSI (Relative Strength Index) crosses below 30, the strategy marks an oversold condition.
DCA Entry:
Once triggered, the strategy executes up to three consecutive daily entries (1 per day), splitting the predefined capital equally (configurable by user).
Position Management:
Take Profit at a configurable % above the average entry price.
Stop Loss at a configurable % below the average entry price.
Exit Conditions:
The strategy automatically exits either on reaching Take Profit or Stop Loss.
Visualization:
RSI plotted with oversold line (30).
Take Profit and Stop Loss lines displayed after entry.
Performance Reporting:
Includes an optional monthly performance table for evaluating results by month.
Note:
This strategy is for testing RSI-based mean reversion with staggered entries. It is not financial advice and should be optimized and validated for each market or timeframe before practical use.

Hilly's 0010110 Reversal Scalping Strategy - 5 Min CandlesKey Features and Rationale:
Timeframe: Restricted to 5-minute candles as requested.
Pattern Integration: Includes single (Hammer, Shooting Star, Doji), two (Engulfing, Harami), and three-plus (Morning Star, Evening Star) candlestick patterns, plus reversal patterns based on RSI extremes.
VWAP Cross: Incorporates bullish (price crosses above VWAP) and bearish (price crosses below VWAP) signals, enhanced by trend context.
Volume Analysis: Uses a volume spike threshold to filter noise, with a simple day-start volume comparison for financial environment context.
Financial Environment: Approximates the day's sentiment using early-hour volume compared to current volume, adjusted by trend.
Aggregation: Scores each condition (e.g., 1 for basic patterns, 2 for strong patterns like Engulfing, 3 for three-candle patterns) and decides based on weighted consensus, with trendStrength as a tunable threshold.
Risky Approach: Minimal filtering and a low trendStrength (default 0.5) allow frequent signals, aligning with your $100-to-$200 goal, but expect higher risk.
Suggested Inputs:
EMA Length: 10 (short enough for 5-minute sensitivity).
VWAP Lookback: 1 (uses current session VWAP).
Volume Threshold Multiplier: 1.2 (moderate spike requirement).
RSI Length: 14 (standard, adjustable to 7 for more sensitivity).
Trend Strength Threshold: 0.5 (balance between signals; lower to 0.4 for more trades, raise to 0.6 for fewer).


Small-Cap — Sell Every Spike (Rendon1) Small-Cap — Sell Every Spike v6 — Strict, No Look-Ahead
Educational use only. This is not financial advice or a signal service.
This strategy targets low/ mid-float runners (≤ ~20M) that make parabolic spikes. It shorts qualified spikes and scales out into flushes. Logic is deliberately simple and transparent to avoid curve-fit.
What the strategy does
Detects a parabolic up move using:
Fast ROC over N bars
Big range vs ATR
Volume spike vs SMA
Fresh higher high (no stale spikes)
Enters short at bar close when conditions are met (no same-bar fills).
Manages exits with ATR targets and optional % covers.
Tracks float rotation intraday (manual float input) and blocks trades above a hard limit.
Draws daily spike-high resistance from confirmed daily bars (no repaint / no look-ahead).
Timeframes & market
Designed for 1–5 minute charts.
Intended for US small-caps; turn Premarket on.
Works intraday; avoid illiquid tickers or names with constant halts.
Entry, Exit, Risk (short side)
Entry: parabolic spike (ROC + Range≥ATR×K + Vol≥SMA×K, new HH).
Optional confirmations (OFF by default to “sell every spike”): upper-wick and VWAP cross-down.
Stop: ATR stop above entry (default 1.2× ATR).
Targets: TP1 = 1.0× ATR, TP2 = 2.0× ATR + optional 10/20/30% covers.
Safety: skip trades if RVOL is low or Float Rotation exceeds your limit (default warn 5×, hard 7×).
Inputs (Balanced defaults)
Price band: $2–$10
Float Shares: set per ticker (from Finviz).
RVOL(50) ≥ 1.5×
ROC(5) ≥ 1.0%, Range ≥ 1.6× ATR, Vol ≥ 1.8× SMA
Cooldown: 10 bars; Max trades/day: 6
Optional: Require wick (≥35%) and/or Require VWAP cross-down.
Presets suggestion:
• Balanced (defaults above)
• Safer: wick+VWAP ON, Range≥1.8×, trades/day 3–4
• Micro-float (<5M): ROC 1.4–1.8%, Range≥1.9–2.2×, Vol≥2.2×, RVOL≥2.0, wick 40–50%
No look-ahead / repaint notes
Daily spike-highs use request.security(..., lookahead_off) and shifted → only closed daily bars.
Orders arm next bar after entry; entries execute at bar close.
VWAP/ATR/ROC/Vol/RVOL are computed on the chart timeframe (no HTF peeking).
How to use
Build a watchlist: Float <20M, RelVol >2, Today +20% (Finviz).
Open 1–5m chart, enter Float Shares for the ticker.
Start with Balanced, flip to Safer on halty/SSR names or repeated VWAP reclaims.
Scale out into flushes; respect the stop and rotation guard.
Limitations & risk
Backtests on small-caps can be optimistic due to slippage, spreads, halts, SSR, and limited premarket data. Always use conservative sizing. Low-float stocks can squeeze violently.
Alerts
Parabolic UP (candidate short)
SHORT Armed (conditions met; entry at bar close)

MOONA130925-2305bThe Martingale strategy in crypto trading involves doubling trade size after each loss, aiming to recover losses with one win and secure a small profit. While potentially effective short-term, it carries high risk, as consecutive losses can rapidly exhaust capital, making it unsustainable without strict risk management.
Use Below Settings for Best Results.
5Min or 15 Min
EMA 20
EMA 45
EMA 200
Keep Enable EMA on Entry- ON
Length 1- 45
Length 2- 200
Set Target 3% (Untick all Except T1)
Set SL 1.5%

2 of 3 Confluence StrategyA strategy created for swing and positional trading on stocks and index. Best to use on daily or minimum hourly time frame. It will also work in smaller time frames but there will be some noise.

Range Breakout StrategyAfter consecutive candle closes it creates a range, and if price breaks out of it it enters with fixed take profit.

QZ Trend (Crypto Edition) v1.1a: Donchian, EMA, ATR, Liquidity/FThe "QZ Trend (Crypto Edition)" is a rules-based trend-following breakout strategy for crypto spot or perpetual contracts, focusing on following trends, prioritizing risk control, seeking small losses and big wins, and trading only when advantageous.
Key mechanisms include:
- Market filters: Screen favorable conditions via ADX (trend strength), dollar volume (liquidity), funding fee windows, session/weekend restrictions, and spot-long-only settings.
- Signals & entries: Based on price position relative to EMA and EMA trends, combined with breaking Donchian channel extremes (with ATR ratio confirmation), plus single-position rules and post-exit cooldowns.
- Position sizing: Calculate positions by fixed risk percentage; initial stop-loss is ATR-based, complying with exchange min/max lot requirements.
- Exits & risk management: Include initial stop-loss, trailing stop (tightens only), break-even rule (stop moves to entry when target floating profit is hit), time-based exit, and post-exit cooldowns.
- Pyramiding: Add positions only when profitable with favorable momentum, requiring ATR-based spacing; add size is a fraction of the base position, with layers sharing stop logic but having unique order IDs.
Charts display EMA, Donchian channels, current stop lines, and highlight low ADX, avoidable funding windows, and low-liquidity periods.
Recommend starting with 4H or 1D timeframes, with typical parameters varying by cycle. Liquidity settings differ by token; perpetuals should enable funding window filters, while spot requires "long-only" and matching fees. The strategy performs well in trends with quick stop-losses but faces whipsaws in ranges (filters mitigate but don’t eliminate noise). Share your symbol and timeframe for tailored parameters.

Hilly's Reversal Scalping Strategy - 5 Min CandlesHow to Use
Copy the Code: Copy the script above.
Paste in TradingView: Open TradingView, go to the Pine Editor (bottom of the chart), paste the code, and click “Add to Chart.”
Set Timeframe: Ensure the chart is set to 5-minute candles (TradingView: right-click chart > Timeframe > 5 Minutes).
Check for Errors: Verify no errors appear in the Pine Editor console.
Apply to Chart: Use a liquid crypto pair (e.g., BTC/USDT, ETH/USDT on Binance or Coinbase).
Verify Signals:
Green “BUY” labels and triangle-up arrows for bullish reversals (e.g., bullish engulfing, hammer, doji, morning star, three white soldiers, double bottom in a downtrend).
Red “SELL” labels and triangle-down arrows for bearish reversals (e.g., bearish engulfing, shooting star, doji, evening star, three black crows, double top in an uptrend).
Green/red background highlights for signal candles.
Backtest: Use TradingView’s Strategy Tester to evaluate performance over 1–3 months, checking Net Profit, Win Rate, and Drawdown.
Demo Test: Run on a demo account to confirm signal visibility and performance before trading with real funds.
Troubleshooting
If Errors Occur: If any errors appear in TradingView’s Pine Editor console (e.g., “Syntax error” or “Invalid argument”), please share the exact error messages to diagnose environment-specific issues.
Signal Overload: If too many signals appear, increase patternLookback to 15 or set volFilter = volume > volMa * 2.0.
Missed Signals: If signals are too rare, set useVolumeFilter=false or reduce patternLookback to 5.
Additional Features: If you need alerts, other indicators (e.g., EMA, RSI), or dynamic arrow sizing, please specify. Note that dynamic sizing caused errors previously, so I’ve kept size=size.normal.

Hilly 3.0 Advanced Crypto Scalping Strategy - 1 & 5 Min ChartsHow to Use
Copy the Code: Copy the script above.
Paste in TradingView: Open TradingView, go to the Pine Editor (bottom of the chart), paste the code, and click “Add to Chart.”
Check for Errors: Verify no errors appear in the Pine Editor console. The script uses Pine Script v5 (@version=5).
Select Timeframe:
1-Minute Chart: Use defaults (emaFastLen=7, emaSlowLen=14, rsiLen=10, rsiOverbought=80, rsiOversold=20, slPerc=0.5, tpPerc=1.0, useCandlePatterns=false, patternLookback=10).
5-Minute Chart: Adjust to emaFastLen=9, emaSlowLen=21, rsiLen=14, rsiOverbought=75, rsiOversold=25, slPerc=0.8, tpPerc=1.5, useCandlePatterns=true, patternLookback=10.
Apply to Chart: Use a liquid crypto pair (e.g., BTC/USDT, ETH/USDT on Binance or Coinbase).
Verify Signals:
Green “BUY” or “EMA BUY” labels and triangle-up arrows below candles for bullish signals (EMA crossovers, bullish engulfing, hammer, doji, morning star, three white soldiers, double bottom).
Red “SELL” or “EMA SELL” labels and triangle-down arrows above candles for bearish signals (EMA crossovers, bearish engulfing, shooting star, doji, evening star, three black crows, double top).
Green/red background highlights for signal candles.
Backtest: Use TradingView’s Strategy Tester to evaluate performance over 1–3 months, checking Net Profit, Win Rate, and Drawdown.
Demo Test: Run on a demo account to confirm signal visibility and performance before trading with real funds.

Sr.Ram.GodSoun.Market StructureDisclaimer: This chart is for educational purposes only. Please do your own due diligence — this is not trade advice. Any signals for buys, sells, calls, or puts are purely strategy outputs and should not be considered trading recommendations.
This strategy is designed for "SPY" and "QQQ" on a 3-minute time frame. It is built on market-structure breakouts, identifying swing highs and lows using a configurable Market Structure Duration.
A bullish breakout triggers a Calls (long) entry, while a bearish breakout triggers a Puts (short) entry.
Signals are filtered with session-based exclusions, ensuring no entries or exits occur during the following EST time windows:
09:30 – 09:45
12:00 – 13:00
15:30 – 16:00
Risk management is enforced through percentage-based exits:
Close Longs and switch to Puts if price moves 0.2%
Close Puts and switch to Calls if price moves 0.2%
The strategy also incorporates re-entry logic after a stop-out:
Re-enter Puts on a further 0.3% breakdown.
Re-enter Calls on a further 0.3% breakout.
Built-in alerts cover all entries, exits, and re-entries, enabling seamless use with automated trading or notifications.

Sr.Rma.Prev High/lows with Alerts
Disclaimer: This chart is designed for educational purposes only. Please conduct your own due diligence before entering any trades.
The strategy is based on previous highs and lows, combined with stop-loss and reversal percentage logic. It is most effective on SPY and QQQ using the 1-minute time-frame, where I personally trade next-day expiration with preset configurations.
If you choose to apply it to other stocks, be sure to adjust the stop-loss % and re-entry % parameters to match your trading style and risk tolerance.

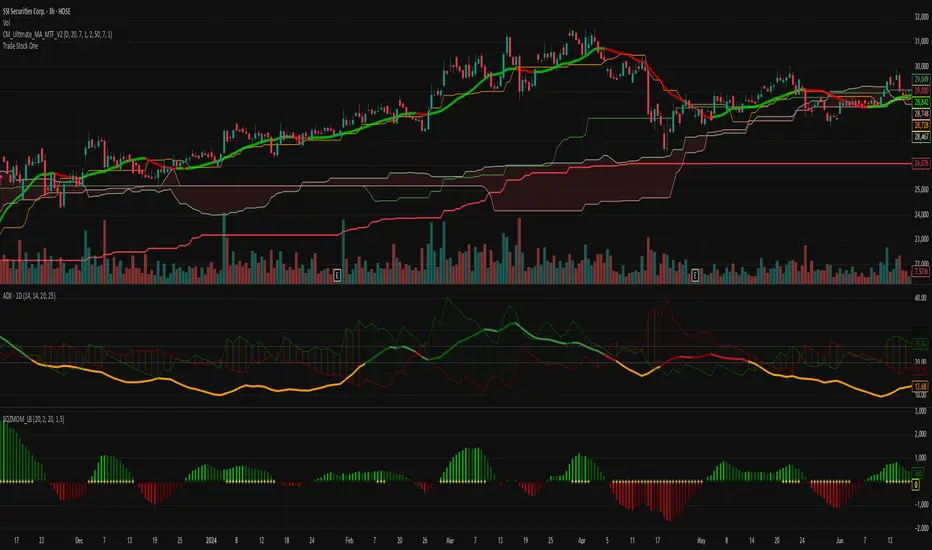
TradeStockOnev4Professional Trading Strategy
Specializes in trading uptrends, riding long-term waves
Limits frequent entries
Suitable for medium- to long-term stock trading
C25_EngulfingEngulfing Testing Script. Best used for 5m MNQ futures. Can work on others with tweaks to parameters


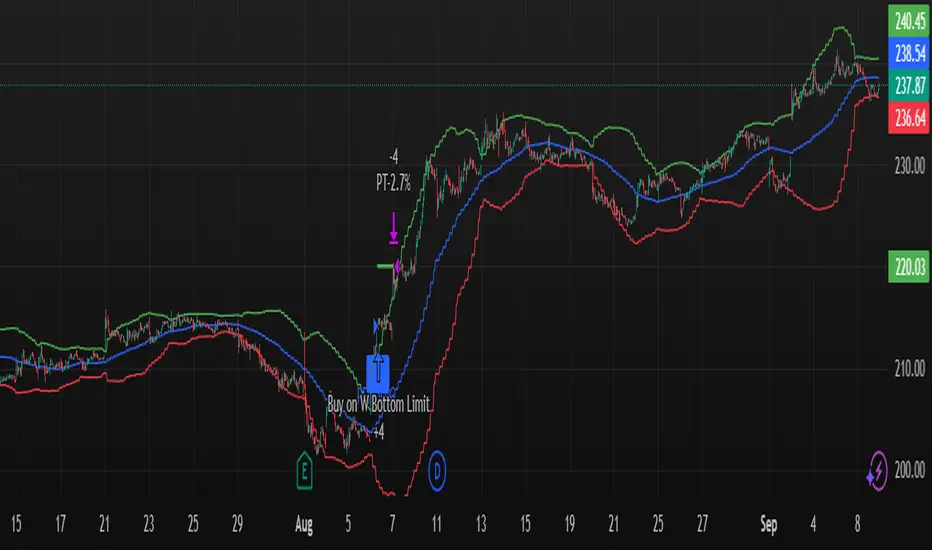
W Bottom Reversal Strategy W Bottom Reversal Strategy (15m-close entries; intrabar TP; daily MACD exit; JSON alerts v49.3-expire2)
Overview
A precision reversal strategy designed for 15-minute charts on liquid symbols. It detects a capitulation-and-stabilization “W” base using 1-hour (1H) context, confirms momentum improvement, then enters only on bar close to avoid early/“ghost” signals. Exits combine a fast intrabar take-profit (~2.7%) with a daily MACD risk-off exit that closes positions when higher-timeframe momentum turns against the setup.
How it works (high-level, matching code)
1H volatility + oversold gate (arming)
Compute 1H Bollinger-style bands (basis = SMA(close, bbLength=20), stdev multiplier bbMult=2.0).
Arm the setup when a 1H bar closes with price < 1H lower band and 1H RSI( rsiLength=14 ) < rsiThreshold (default 20.0).
1H momentum flip → pending entry
When a new 1H bar closes and 1H MACD line (EMA12−EMA26) crosses above 0 while armed and flat, set an entryPending flag.
This does not enter yet—it prepares a confirmed, bar-close entry on the lower timeframe.
Bar-close execution on the chart timeframe (15m)
On the next 15m bar close (or within N bars, see below) and still flat, fire the entry using a limit order at close × (1 − 0.00001) (≈ 0.001% below close) to reduce slippage and maintain chart/alert alignment.
Anti-late filter (no stale triggers)
If the pending entry doesn’t trigger within N chart bars (input: “Pending entry valid for N chart bars”, default 1, range 1–8), it expires and the arm state resets. This prevents late fills long after the 1H confirmation.
Exit logic
Primary: Standing intrabar take-profit at +2.7% from the average entry price (managed via strategy.exit limit).
Risk-off: On daily bar close, if Daily MACD line (EMA12−EMA26) crosses under 0, close the position (flat on daily momentum flip).
Default Properties (used for this publication)
Timeframe: 15m (with 1H and Daily higher-timeframe confirmations via request.security)
Initial capital: $10,000
Position sizing: Percent of equity = 10% per trade (enters only when flat; no stacking while in a position)
Commission: 0.05% per side
Slippage: Recommend 1 tick in Strategy Properties for realistic fills
Inputs exposed:
BB Length: 20 • BB Multiplier: 2.0
RSI Length: 14 • RSI Threshold: 20.0
MACD: Short 12, Long 26, Signal 9 (signal kept for compatibility; logic uses MACD line vs 0)
Pending entry valid for N chart bars: default 1 (1–8)
Execution behavior (per code):
calc_on_every_tick = false (evaluates on bar close)
process_orders_on_close = true (orders placed at bar close)
Limit entry at close −0.001%
Intrabar TP (2.7%)
Daily risk-off exit on MACD<0 at daily bar close
Alerts (exact behavior in code)
Uses alert() function calls with standardized JSON.
Set your alert to “Only alert() function calls” and “Once per bar close.”
Two events are emitted:
LONG_CONFIRMED on entry fire (15m bar close)
EXIT_CONFIRMED_DAILY_MACD on daily MACD<0 (daily bar close)
JSON fields include: event, version ("v49.3-expire2"), symbol, interval, price, and time.
How to use
Apply on liquid tickers (tight spreads, healthy volume).
Keep defaults initially; run across a broad, liquid watchlist to gather a proper sample.
For automation, route bar-close alerts to your executor; confirm broker lot/route settings and that limit orders at close −0.001% are acceptable.
Expect fewer signals in powerful trends; the daily risk-off helps cut failed bases.
Methodology & expectations (results transparency)
Evaluate on a dataset yielding 100+ trades before drawing conclusions.
Keep commission & slippage enabled (see defaults).
Risk sizing: With 10% of equity per trade and flat-to-flat entries, exposure aligns with typical 5–10% guidance.
No performance guarantees—outcomes depend on symbol selection, volatility regime, news, and execution quality.
Originality & value (vendor justification)
While it uses familiar building blocks (BB/RSI/MACD), the edge comes from the 1H volatility + oversold arming, 1H momentum flip, strict 15m bar-close limit execution, and the N-bar pending expiry that prevents stale triggers—paired with a dual-exit design (intrabar TP + daily risk-off). The focus is on reducing premature fills, keeping alerts 1:1 with chart marks, and capturing the first impulse out of a W-base.
Disclaimers
For educational purposes only; not financial advice. Paper-test first. Verify alerts, fills, and symbol liquidity with your broker before live use.
Changelog: v49.3-expire2 — Bar-close limit entries; anti-late pending window; standardized JSON alerts; intrabar 2.7% TP; daily MACD risk-off exit.
Recovery StrategyDescription:
The Recovery Strategy is a long-only trading system designed to capitalize on significant price drops from recent highs. It enters a position when the price falls 10% or more from the highest high over a 6-month lookback period and adds positions on further 2% drops, up to a maximum of 5 positions. Each trade is held for 6 months before exiting, regardless of profit or loss. The strategy uses margin to amplify position sizes, with a default leverage of 5:1 (20% margin requirement). All key parameters are customizable via inputs, allowing flexibility for different assets and timeframes. Visual markers indicate recent highs for reference.
How It Works:
Entry: Buys when the closing price drops 10% or more from the recent high (highest high in the lookback period, default 126 bars ~6 months). If already in a position, additional buys occur on further 2% drops (e.g., 12%, 14%, 16%, 18%), up to 5 positions (pyramiding).
Exit: Each trade exits after its own holding period (default 126 bars ~6 months), regardless of profit or loss. No stop loss or take-profit is used.
Margin: Uses leverage to control larger positions (default 20% margin, 5:1 leverage). The order size is a percentage of equity (default 100%), adjustable via inputs.
Visualization: Displays blue markers (without text) at new recent highs to highlight reference levels.
Inputs:
Lookback Period for High Peak (bars): Number of bars to look back for the recent high (default: 126, ~6 months on daily charts).
Initial Drop Percentage to Buy (%): Percentage drop from recent high to trigger the first buy (default: 10.0%).
Additional Drop Percentage to Buy (%): Further drop percentage to add positions (default: 2.0%).
Holding Period (bars): Number of bars to hold each position before selling (default: 126, ~6 months).
Order Size (% of Equity): Percentage of equity used per trade (default: 100%).
Margin for Long Positions (%): Percentage of position value covered by equity (default: 20%, equivalent to 5:1 leverage).
Usage:
Timeframe: Designed for daily charts (126 bars ~6 months). Adjust Lookback Period and Holding Period for other timeframes (e.g., 1008 hours for hourly charts, assuming 8 trading hours/day).
Assets: Suitable for stocks, ETFs, or other assets with significant price volatility. Test thoroughly on your chosen asset.
Settings: Customize inputs in the strategy settings to match your risk tolerance and market conditions. For example, lower Margin for Long Positions (e.g., to 10% for 10:1 leverage) to increase position sizes, but beware of higher risk.
Backtesting: Use TradingView’s Strategy Tester to evaluate performance. Check the “List of Trades” for skipped trades due to insufficient equity or margin requirements.
Risks and Considerations:
No Stop Loss: The strategy holds trades for the full 6 months without a stop loss, exposing it to significant drawdowns in prolonged downtrends.
Margin Risk: Leverage (default 5:1) amplifies both profits and losses. Ensure sufficient equity to cover margin requirements to avoid skipped trades or simulated margin calls.
Pyramiding: Up to 5 positions can be open simultaneously, increasing exposure. Adjust pyramiding in the code if fewer positions are desired (e.g., change to pyramiding=3).
Market Conditions: Performance depends on price drops and recoveries. Test on historical data to assess effectiveness in your market.
Broker Emulator: TradingView’s paper trading simulates margin but does not execute real margin trading. Results may differ in live trading due to broker-specific margin rules.
How to Use:
Add the strategy to your chart in TradingView.
Adjust input parameters in the settings panel to suit your asset, timeframe, and risk preferences.
Run a backtest in the Strategy Tester to evaluate performance.
Monitor open positions and margin levels in the Trading Panel to manage risk.
For live trading, consult your broker’s margin requirements and leverage policies, as TradingView’s simulation may not match real-world conditions.
Disclaimer:
This strategy is for educational purposes only and does not constitute financial advice. Trading involves significant risk, especially with leverage and no stop loss. Always backtest thoroughly and consult a financial advisor before using any strategy in live trading.

LP Sweep / Reclaim & Breakout Grading: Long-onlySignals
1) LP Sweep & Reclaim (mean-reversion entry)
Compute LP bounds from prior-bar window extremes:
lpLL_prev = lowest low of the last N bars (offset 1).
lpHH_prev = highest high of the last N bars (offset 1).
Sweep long trigger: current low dips below lpLL_prev and closes back above it.
Real-time quality grading (A/B/C) for sweep:
Trend filter & slope via EMA(88).
BOS bonus: close > last confirmed swing high.
Body size vs ATR, location above a long EMA, headroom to swing high (penalty if too close), and multi-sweep count bonus.
Sum → score → grade A/B/C; A or B required for sweep entry.
2) Trend Breakout (momentum entry)
Core trigger: close > previous Donchian high (length boLen) + ATR buffer.
Optional filter: close must be above the default EMA.
Breakout grading (A/B/C) in real time combining:
Trend up (price > EMA and EMA rising),
Body/ATR, Gap above breakout level (in ATR),
Volume vs MA,
Upper-wick penalty,
Position-in-Score: headroom to last swing high (penalty if too near) + EMA slope bonus.
Sum → score → A or B required if grading enabled.

Sweep/Reclaim & Breakout Grading — Long-onlyStrategy Overview
Name: LP Sweep & Reclaim — Long-only: Breakout Grading with Position-in-Score + Hybrid SL + 1R→BE
Signals
1) LP Sweep & Reclaim (mean-reversion entry)
2) Trend Breakout (momentum entry)
Risk & Exit Logic
Hybrid Stop-Loss (at entry)
Compute two candidates:
Structure-based SL: reference level (LP low for sweeps, min(low, donchianHigh) for breakouts) minus k × ATR.
ATR-based SL: close − m × ATR.
Hybrid rule (longs): pick the tighter one (the higher price) → initial SL.
1R → Breakeven (BE) transition
Trend Take-Profit (EMA cross)
Exit condition: after at least minHoldBars since entry (default 4), close crosses below the chosen EMA → strategy.close.
