SP500 Session Gap Fade StrategySummary in one paragraph
SPX Session Gap Fade is an intraday gap fade strategy for index futures, designed around regular cash sessions on five minute charts. It helps you participate only when there is a full overnight or pre session gap and a valid intraday session window, instead of trading every open. The original part is the gap distance engine which anchors both stop and optional target to the previous session reference close at a configurable flat time, so every trade’s risk scales with the actual gap size rather than a fixed tick stop.
Scope and intent
• Markets. Primarily index futures such as ES, NQ, YM, and liquid index CFDs that exhibit overnight gaps and regular cash hours.
• Timeframes. Intraday timeframes from one minute to fifteen minutes. Default usage is five minute bars.
• Default demo used in the publication. Symbol CME:ES1! on a five minute chart.
• Purpose. Provide a simple, transparent way to trade opening gaps with a session anchored risk model and forced flat exit so you are not holding into the last part of the session.
• Limits. This is a strategy. Orders are simulated on standard candles only.
Originality and usefulness
• Unique concept or fusion. The core novelty is the combination of a strict “full gap” entry condition with a session anchored reference close and a gap distance based TP and SL engine. The stop and optional target are symmetric multiples of the actual gap distance from the previous session’s flat close, rather than fixed ticks.
• Failure mode it addresses. Fixed sized stops do not scale when gaps are unusually small or unusually large, which can either under risk or over risk the account. The session flat logic also reduces the chance of holding residual positions into late session liquidity and news.
• Testability. All key pieces are explicit in the Inputs: session window, minutes before session end, whether to use gap exits, whether TP or SL are active, and whether to allow candle based closes and forced flat. You can toggle each component and see how it changes entries and exits.
• Portable yardstick. The main unit is the absolute price gap between the entry bar open and the previous session reference close. tp_mult and sl_mult are multiples of that gap, which makes the risk model portable across contracts and volatility regimes.
Method overview in plain language
The strategy first defines a trading session using exchange time, for example 08:30 to 15:30 for ES day hours. It also defines a “flat” time a fixed number of minutes before session end. At the flat bar, any open position is closed and the bar’s close price is stored as the reference close for the next session. Inside the session, the strategy looks for a full gap bar relative to the prior bar: a gap down where today’s high is below yesterday’s low, or a gap up where today’s low is above yesterday’s high. A full gap down generates a long entry; a full gap up generates a short entry. If the gap risk engine is enabled and a valid reference close exists, the strategy measures the distance between the entry bar open and that reference close. It then sets a stop and optional target as configurable multiples of that gap distance and manages them with strategy.exit. Additional exits can be triggered by a candle color flip or by the forced flat time.
Base measures
• Range basis. The main unit is the absolute difference between the current entry bar open and the stored reference close from the previous session flat bar. That value is used as a “gap unit” and scaled by tp_mult and sl_mult to build the target and stop.
Components
• Component one: Gap Direction. Detects full gap up or full gap down by comparing the current high and low to the previous bar’s high and low. Gap down signals a long fade, gap up signals a short fade. There is no smoothing; it is a strict structural condition.
• Component two: Session Window. Only allows entries when the current time is within the configured session window. It also defines a flat time before the session end where positions are forced flat and the reference close is updated.
• Component three: Gap Distance Risk Engine. Computes the absolute distance between the entry open and the stored reference close. The stop and optional target are placed as entry ± gap_distance × multiplier so that risk scales with gap size.
• Optional component: Candle Exit. If enabled, a bullish bar closes short positions and a bearish bar closes long positions, which can shorten holding time when price reverses quickly inside the session.
• Session windows. Session logic uses the exchange time of the chart symbol. When changing symbols or venues, verify that the session time string still matches the new instrument’s cash hours.
Fusion rule
All gates are hard conditions rather than weighted scores. A trade can only open if the session window is active and the full gap condition is true. The gap distance engine only activates if a valid reference close exists and use_gap_risk is on. TP and SL are controlled by separate booleans so you can use SL only, TP only, or both. Long and short are symmetric by construction: long trades fade full gap downs, short trades fade full gap ups with mirrored TP and SL logic.
Signal rule
• Long entry. Inside the active session, when the current bar shows a full gap down relative to the previous bar (current high below prior low), the strategy opens a long position. If the gap risk engine is active, it places a gap based stop below the entry and an optional target above it.
• Short entry. Inside the active session, when the current bar shows a full gap up relative to the previous bar (current low above prior high), the strategy opens a short position. If the gap risk engine is active, it places a gap based stop above the entry and an optional target below it.
• Forced flat. At the configured flat time before session end, any open position is closed and the close price of that bar becomes the new reference close for the following session.
• Candle based exit. If enabled, a bearish bar closes longs, and a bullish bar closes shorts, regardless of where TP or SL sit, as long as a position is open.
What you will see on the chart
• Markers on entry bars. Standard strategy entry markers labeled “long” and “short” on the gap bars where trades open.
• Exit markers. Standard exit markers on bars where either the gap stop or target are hit, or where a candle exit or forced flat close occurs. Exit IDs “long_gap” and “short_gap” label gap based exits.
• Reference levels. Horizontal lines for the current long TP, long SL, short TP, and short SL while a position is open and the gap engine is enabled. They update when a new trade opens and disappear when flat.
• Session background. This version does not add background shading for the session; session logic runs internally based on time.
• No on chart table. All decisions are visible through orders and exit levels. Use the Strategy Tester for performance metrics.
Inputs with guidance
Session Settings
• Trading session (sess). Session window in exchange time. Typical value uses the regular cash session for each contract, for example “0830-1530” for ES. Adjust if your broker or symbol uses different hours.
• Minutes before session end to force exit (flat_before_min). Minutes before the session end where positions are forced flat and the reference close is stored. Typical range is 15 to 120. Raising it closes trades earlier in the day; lowering it allows trades later in the session.
Gap Risk
• Enable gap based TP/SL (use_gap_risk). Master switch for the gap distance exit engine. Turning it off keeps entries and forced flat logic but removes automatic TP and SL placement.
• Use TP limit from gap (use_gap_tp). Enables gap based profit targets. Typical values are true for structured exits or false if you want to manage exits manually and only keep a stop.
• Use SL stop from gap (use_gap_sl). Enables gap based stop losses. This should normally remain true so that each trade has a defined initial risk in ticks.
• TP multiplier of gap distance (tp_mult). Multiplier applied to the gap distance for the target. Typical range is 0.5 to 2.0. Raising it places the target further away and reduces hit frequency.
• SL multiplier of gap distance (sl_mult). Multiplier applied to the gap distance for the stop. Typical range is 0.5 to 2.0. Raising it widens the stop and increases risk per trade; lowering it tightens the stop and may increase the number of small losses.
Exit Controls
• Exit with candle logic (use_candle_exit). If true, closes shorts on bullish candles and longs on bearish candles. Useful when you want to react to intraday reversal bars even if TP or SL have not been reached.
• Force flat before session end (use_forced_flat). If true, guarantees you are flat by the configured flat time and updates the reference close. Turn this off only if you understand the impact on overnight risk.
Filters
There is no separate trend or volatility filter in this version. All trades depend on the presence of a full gap bar inside the session. If you need extra filtering such as ATR, volume, or higher timeframe bias, they should be added explicitly and documented in your own fork.
Usage recipes
Intraday conservative gap fade
• Timeframe. Five minute chart on ES regular session.
• Gap risk. use_gap_risk = true, use_gap_tp = true, use_gap_sl = true.
• Multipliers. tp_mult around 0.7 to 1.0 and sl_mult around 1.0.
• Exits. use_candle_exit = false, use_forced_flat = true. Focus on the structured TP and SL around the gap.
Intraday aggressive gap fade
• Timeframe. Five minute chart.
• Gap risk. use_gap_risk = true, use_gap_tp = false, use_gap_sl = true.
• Multipliers. sl_mult around 0.7 to 1.0.
• Exits. use_candle_exit = true, use_forced_flat = true. Entries fade full gaps, stops are tight, and candle color flips flatten trades early.
Higher timeframe gap tests
• Timeframe. Fifteen minute or sixty minute charts on instruments with regular gaps.
• Gap risk. Keep use_gap_risk = true. Consider slightly higher sl_mult if gaps are structurally wider on the higher timeframe.
• Note. Expect fewer trades and be careful with sample size; multi year data is recommended.
Properties visible in this publication
• On average our risk for each position over the last 200 trades is 0.4% with a max intraday loss of 1.5% of the total equity in this case of 100k $ with 1 contract ES. For other assets, recalculations and customizations has to be applied.
• Initial capital. 100 000.
• Base currency. USD.
• Default order size method. Fixed with size 1 contract.
• Pyramiding. 0.
• Commission. Flat 2 USD per order in the Strategy Tester Properties. (2$ buying + 2$selling)
• Slippage. One tick in the Strategy Tester Properties.
• Process orders on close. ON.
Realism and responsible publication
• No performance claims are made. Past results do not guarantee future outcomes.
• Costs use a realistic flat commission and one tick of slippage per trade for ES class futures.
• Default sizing with one contract on a 100 000 reference account targets modest per trade risk. In practice, extreme slippage or gap through events can exceed this, so treat the one and a half percent risk target as a design goal, not a guarantee.
• All orders are simulated on standard candles. Shapes can move while a bar is forming and settle on bar close.
Honest limitations and failure modes
• Economic releases, thin liquidity, and limit conditions can break the assumptions behind the simple gap model and lead to slippage or skipped fills.
• Symbols with very frequent or very large gaps may require adjusted multipliers or alternative risk handling, especially in high volatility regimes.
• Very quiet periods without clean gaps will produce few or no trades. This is expected behavior, not a bug.
• Session windows follow the exchange time of the chart. Always confirm that the configured session matches the symbol.
• When both the stop and target lie inside the same bar’s range, the TradingView engine decides which is hit first based on its internal intrabar assumptions. Without bar magnifier, tie handling is approximate.
Legal
Education and research only. This strategy is not investment advice. You remain responsible for all trading decisions. Always test on historical data and in simulation with realistic costs before considering any live use.
图表形态


AlosAlgoAlosAlgo Version: 1 BETA
A multi-timeframe, ATR-driven trend strategy with flexible entry engines (Open/Close vs Renko), optional HTF Heikin Ashi filtering, and a built-in 3-stage take-profit model designed to be backtested on TradingView and automated via webhooks.

Fractional Candlestick Long Only Experimental V4 Another example of use an idea of Fractional Candlestick , based on mathematical rules of Fractional Calculus , typical kernel Caputo-Fabrizio ( CF ) and Atangana-Baleanu is used, alfa factor ( esential for calculation ) is in range 0,1-0.9.
Let's fun with this script .

ATR + ATR 전략It is a strong trend strategy based on ATR and ADX. Optimized for 15 installments of Bitcoin futures.

Trilok saini EMA Pullback + MACD + ADX Strategy📌 HA Double EMA Pullback + MACD + ADX Strategy — Description
This strategy combines Heikin Ashi candles, Double EMA pullbacks, MACD momentum filtering, and ADX trend-strength confirmation to generate high-probability trend-continuation signals.
It is designed to avoid choppy markets and focus only on strong trending conditions.
🔥 Key Features
1️⃣ Heikin Ashi Trend Analysis
Heikin Ashi candles are calculated on the selected timeframe.
They smooth out market noise to highlight clear bullish or bearish trends.
Trend direction is displayed in a live info table.
2️⃣ Double EMA Pullback Logic
The main signal engine of this strategy:
Buy conditions
Price crosses above EMA 20
EMA 20 > EMA 50 (confirming uptrend)
A pullback is detected using the back-step (price was above EMA earlier)
MACD + ADX filters approve the trade
Sell conditions
Price crosses below EMA 20
EMA 20 < EMA 50 (confirming downtrend)
Pullback confirmation based on earlier price action
MACD + ADX filters approve the trade
This logic focuses on trend continuation instead of reversal setups.
3️⃣ MACD Momentum Filter
Buy signals appear only when MACD histogram is positive (green).
Sell signals appear only when MACD histogram is negative (red).
Prevents entries during weak or directionless momentum.
4️⃣ ADX Trend Strength Filter
Signals are blocked when ADX is below the selected threshold.
Ensures trades happen only in strong trending markets, reducing false signals.
5️⃣ Visual Enhancements
Clean Heikin Ashi candles with customizable colors
Optional regular candles for comparison
EMA overlays on HA candles
Buy/Sell labels with customizable text
Info table showing:
Trend direction
HA close
Regular close
EMA values
ADX reading
Active filters
🎯 Ideal Use Cases
Trend-following traders
Swing traders
Intraday traders who want filtered signals
Anyone wanting fewer false signals in sideways markets
⚠️ Disclaimer
This script is for educational and research purposes only.
Past performance does not guarantee future results. Always backtest and use proper risk management.

LiquiBreak — Semi-Automatic Breakout, Gap & Trend-Filter StrategLiquiBreak is a semi-automatic breakout + gap detection strategy that combines pivots, a volatility filter and an optional Supertrend direction check to generate entry signals. It can optionally place take-profit and stop-loss orders in points. Use it to highlight high-probability breakout/gap setups and to automate exits when you want — otherwise treat its signals as trade alerts that require your confirmation.
📌 LiquiBreak — Semi-Automatic Breakout, Gap & Trend Strategy
1. Overview
1. LiquiBreak is a semi-automatic breakout + gap strategy designed to catch high-quality moves with volatility confirmation.
2. Uses pivot-based support/resistance , gap detection , Supertrend filtering , and optional automatic TP/SL in points .
3. Works on all assets and timeframes, especially effective on XAUUSD, Indices, Crypto and FX pairs .
---
2. What This Script Detects
1. Breakouts above resistance and below support during strong volatility.
2. Bullish & bearish gap patterns confirmed with momentum sequences.
3. Dynamic volatility zones based on normalized ATR ranges.
4. Optional Supertrend trend direction for filtering bad signals.
5. Automatic TP/SL orders when enabled.
---
3. Recommended Indicators to Combine With
To increase accuracy and reduce false breakouts:
1. Supertrend (included) – best for trend direction.
2. EMA 9/21 or EMA 20/50 – confirms trend strength & pullbacks.
3. RSI or Stoch RSI – avoid overbought/oversold breakouts.
4. VWAP – institutional bias & fair value zones.
5. CPR / Pivot Points – confluence with breakout levels.
6. MACD – trend confirmation on higher timeframe.
7. Volume Profile (optional) – find breakout liquidity zones.
These indicators help filter low-quality signals without affecting the script’s core logic.
---
4. Key Features
1. Volatility-based pivot support & resistance .
2. Reliable breakout confirmation using real-time volatility strength.
3. Strong gap pattern detection with ATR threshold.
4. Optional Supertrend confirmation for safer entries.
5. Point-based Take Profit / Stop Loss .
6. Toggle on/off: Longs, Shorts, TP, SL .
7. Semi-automatic execution — not fully automated.
8. Clean, optimized structure for stability and speed.
---
5. Inputs / Settings
1. Pivot / Levels Period – defines structural S/R levels.
2. Volatility Filter (%) – prevents low-quality signals.
3. TP Points – automatic take-profit target.
4. SL Points – automatic stop-loss.
5. Enable TP / Enable SL – full exit control.
6. Allow Long / Allow Short – direction control.
7. Supertrend Filter – filter weak counter-trend trades.
---
6. How to Use the Strategy
1. Select timeframe & tune pivot/volatility settings.
2. Enable/disable automatic TP/SL based on your style.
3. Turn ON Supertrend for safer trend-based trades.
4. Confirm signals using EMA, RSI, VWAP, Volume or CPR.
5. Watch for high-volatility breakouts near key levels.
6. Use multiple timeframe analysis for stronger confirmation.
---
7. Important Warning (User Must Monitor Trades)
⚠ This script is NOT a fully automatic bot.
1. You MUST monitor the chart while using this strategy.
2. You MUST manually close trades if market conditions change.
3. Auto TP/SL helps, but during news events or fast markets, slippage may occur.
4. Treat this script as a signal + entry assistant , not a fire-and-forget system.
---
8. Best Practices
1. Works best on XAUUSD, NAS100, BTC, ETH, EURUSD .
2. Avoid major news unless experienced.
3. Increase volatility filter during choppy markets.
4. Use M15–H1 for clean breakouts; M5 for scalping.
5. For beginners: keep TP/SL enabled for safety.
6. Backtest first → then paper trade → then live trade.
---
9. Disclaimer
1. For educational and research purposes only .
2. Not financial advice.
3. User is fully responsible for their trades and risk.
4. Past performance does not guarantee future results.

QQQ Momentum Regime Rider (EMA + VWAP + ADX + Vol Pullback)My strategy catches intraday momentum, has a phenomenal return of 18% annually


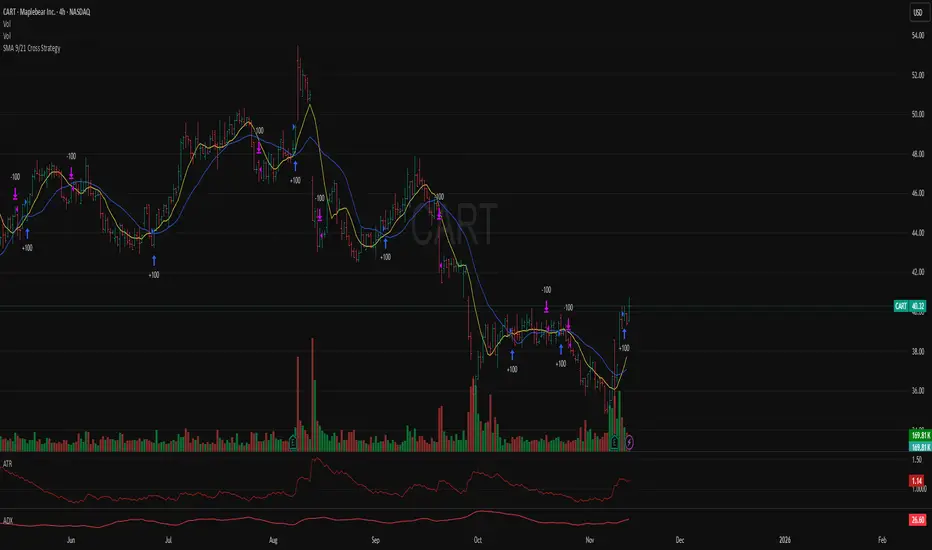
SMA 9/21 Cross StrategyThis is my SILVER CROSS strategy
after 5 months portfolio gain 39%
Never risk more then 2% of your wallet
Stop loss Price - 2xATR
Best results on 4h chart
ADILS_TREND_V5Swing 15 mins using RSI and MAs ... catching the turn around in trend in all time frames. Works best on 15 mins

[Bybit BTCUSD.P] 7Years Backtest Results. 2,609% +Non-Repainting📊 I. Strategy Overview: Trust Backed by Numbers
The ADX Sniper v12 strategy has been rigorously tested over 7 years, from November 14, 2018 to November 8, 2025, spanning every major cycle of the Bitcoin
BTCUSD.P futures market. This strategy successfully balances two often-conflicting goals: maximizing profitability while minimizing volatility, all supported by objective performance data.
This strategy has been validated across all Bitcoin (BTCUSD.P) futures market cycles over a 7-year period.
■ Visual Proof: Bar Replay Simulation
The chart above demonstrates actual entry and exit points captured via TradingView's Bar Replay feature. The green rectangle highlights the core profitable trading zone, showing where the strategy successfully captured sustained uptrends. This visual evidence confirms:
Confirmed buy/sell signals with exact execution prices (marked in red and blue)
No repainting or signal distortion after candle close
Consistent performance across multiple market cycles within the highlighted zone
💰 Core Performance Metrics:
Cumulative Return: 2,609.14% (compounded growth over 7 years)
Maximum Drawdown (MDD): 6.999% (preserving over 93% of capital)
Average Profit/Loss Ratio: 8.003 (industry-leading risk-reward efficiency)
Total Trades: 24 (focused exclusively on high-conviction opportunities)
Sortino Ratio: 11.486 (mathematically proving robustness and stability)
✅ This strategy has been validated across all Bitcoin BTCUSD.P futures market cycles over a 7-year period.
📊 I. 전략 개요: 숫자로 입증된 신뢰
ADX Sniper v12 전략은 2018년 11월 14일부터 2025년 11월 8일까지 약 7년간 비트코인 (BTCUSD.P) 선물 시장의 모든 주요 사이클을 거치며 엄격하게 검증되었습니다. 수익성 극대화와 변동성 최소화라는 상충되는 목표를 동시에 달성한 이 전략의 핵심 성과 지표를 객관적 데이터를 통해 확인하실 수 있습니다.
본 전략은 7년간의 모든 비트코인 (BTCUSD.P) 선물 시장 사이클에서 검증되었습니다.
■ 시각적 증명: 바 리플레이 시뮬레이션
위 차트는 TradingView의 바 리플레이 기능으로 포착된 실제 진입 및 청산 시점을 보여줍니다. 녹색 네모는 핵심 수익 구간을 표시하며, 전략이 지속적인 상승 추세를 성공적으로 포착한 영역을 나타냅니다. 본 시각 자료는 다음을 입증합니다:
정확한 체결 가격이 표기된 확정된 매수/매도 신호 (빨강색과 파랑색으로 표시)
캔들 종가 후 신호 왜곡이나 리페인팅 없음
강조 표시된 구간 내 여러 시장 사이클에 걸친 일관된 성과
💰 핵심 성과 지표:
누적 수익률: 2,609.14% (7년간 복리 성장 입증)
최대 낙폭 (MDD): 6.999% (7년간 자본의 93% 이상 보존)
평균 손익비: 8.003 (업계 최고 수준의 위험-보상 효율성)
총 거래 횟수: 24회 (고확신 기회에만 집중)
소르티노 비율: 11.486 (전략의 견고성과 안정성을 수학적으로 입증)
✅ 본 전략은 7년간의 모든 비트코인 (BTCUSD.P) 선물 시장 사이클에서 검증되었습니다.
🛡️ II. Core Philosophy: Cut Losses Short, Let Profits Run
Why MDD Stays Below 7% in a Volatile Market
The crypto futures market typically experiences daily volatility exceeding 10%, with most strategies enduring drawdowns between 30% and 50%. In stark contrast, this strategy has never exceeded a 7% account loss over seven years. This exceptional low MDD is achieved through deliberate design mechanisms, not luck:
🎯 Entry Filtering: The 'ADX Pop-up Filter' is the core component. It enables the strategy to strictly avoid trading when market conditions indicate major reversals or consolidation phases, thereby minimizing exposure to high-risk zones.
🏛️ Capital Preservation Priority: The strategy prioritizes investor psychological stability and capital preservation over pursuing maximum potential returns.
The Power of an 8.003 Profit Factor
The Profit Factor measures the ratio of total profitable trades to total losing trades. It's the most critical metric for assessing risk-adjusted returns.
A Profit Factor of 8.003 means that for every dollar lost, the strategy earns an average of eight dollars. This demonstrates the efficiency of a true trend-following strategy:
Cutting losses quickly (averaging $177,419 USD loss per trade)
Riding winners for maximum extension (averaging $1,419,920 USD profit per trade)
🛡️ II. 핵심 철학: 손실은 빠르게 자르고, 수익은 끝까지
암호화폐 시장에서 MDD <7%의 의미
암호화폐 선물 시장은 일일 변동성이 10%를 초과하는 경우가 빈번하며, 일반적인 전략들은 30~50%의 MDD를 겪습니다. 이와 극명한 대조로, 본 전략은 7년간 단 한 번도 7%를 초과하는 계좌 손실을 기록하지 않았습니다. 이렇게 극도로 낮은 MDD는 운이 아닌 체계적인 메커니즘을 통해 달성되었습니다:
🎯 진입 필터링: 'ADX 팝업 필터'가 핵심 구성 요소로, 시장 상황이 주요 반전이나 횡보를 나타낼 때 거래를 엄격히 회피하여 고위험 구간 노출을 최소화합니다.
🏛️ 자본 보존 우선: 본 전략은 최대 잠재 손실을 감수하기보다 투자자의 심리적 안정성과 자본 보존을 우선시하도록 설계되었습니다.
손익비 8.003의 힘
손익비는 '총 수익 거래'와 '총 손실 거래'의 비율로, 위험 조정 수익을 측정하는 핵심 지표입니다.
8.003이라는 값은 1달러를 잃을 때마다 평균적으로 8달러 이상을 벌어들이는 구조를 의미합니다. 이는 진정한 추세 추종 전략의 최대 효율성을 보여줍니다:
손실은 빠르게 자르고 ($177,419 USD 평균 손실)
수익은 최대한 연장합니다 ($1,419,920 USD 평균 수익)
🎯 III. Strategy Reliability and Structural Edge
The Secret of 24 Trades in 7 Years
Only 24 trades over 7 years signifies that this strategy ignores 99% of market volatility and targets only the 1% of 'most certain buying cycles'. This approach eliminates the drag from excessive trading:
❌ No commission bleed
❌ No slippage erosion
❌ No psychological wear from overtrading
📈 Long-Term Trend Following: The strategy analyzes Bitcoin's long-term price cycles to capture the onset of massive trends while remaining undisturbed by short-term market noise.
Non-Repainting Structure: Alignment of Reality and Simulation
🎬 Non-Repainting Proof Video Available
※↑ "If you wish, I can also show you a video as evidence of the non-repainting throughout the 7 years."
✅ Real-Time Trading Reliability: This strategy is built with a non-repainting structure, generating buy/sell signals only after each candle's closing price is confirmed.
✅ Preventing Data Exaggeration: This design ensures that backtest results do not 'repaint' or distort past performance, guaranteeing high correlation between simulated results and actual live trading environments.
✅ Live Trading Advantage: While simulations use closing prices, live trading may allow entry at more favorable prices before candle close, potentially yielding even better execution than backtest results.
🎯 III. 전략의 신뢰성과 구조적 우위
7년간 24회 거래의 비밀
7년간 단 24회의 거래는 시장 변동성의 99%를 무시하고 오직 1%의 '가장 확실한 매수 사이클'만을 타겟으로 한다는 것을 의미합니다. 이는 과도한 거래로 인한 문제를 근본적으로 제거합니다:
❌ 수수료 소모 없음
❌ 슬리피지 침식 없음
❌ 과도한 트레이딩으로 인한 심리적 소모 없음
📈 장기 추세 추종: 비트코인 가격 역사를 지배하는 장기 사이클 분석을 활용하여, 단기 시장 노이즈에 흔들리지 않고 대규모 추세의 시작점을 포착하는 데 집중합니다.
논-리페인팅 구조: 현실과 시뮬레이션의 일치
🎬 논-리페인팅 증명 영상 제공 가능
※↑ "원하신다면 7년간 리페인팅이 없음을 증명하는 영상도 보여드릴 수 있습니다."
✅ 실시간 거래 신뢰성: 본 전략은 논-리페인팅 구조로 구축되어, 캔들의 종가가 확정된 후에만 매수/매도 신호를 생성합니다.
✅ 데이터 과장 방지: 이러한 설계는 백테스트 결과가 과거 성과를 '리페인팅'하거나 과장하지 않도록 보장하며, 시뮬레이션 결과와 실제 라이브 거래 환경 간의 높은 상관관계를 보장합니다.
✅ 라이브 실행 우위 가능성: 시뮬레이션은 종가 기준이지만, 라이브 운영 시 캔들이 마감되기 전 더 유리한 가격에 진입할 수 있어 시뮬레이션 결과보다 더 나은 실행 성과를 얻을 가능성이 있습니다.
📈 IV. Performance Summary (November 14, 2018 - November 8, 2025)
| Metric | Value || Metric | Value |
|--------|-------|
| Initial Capital | $1,000,000 |
| Net Profit | +$26,091,383.74 |
| Cumulative Return | +2,609.14% |
| Maximum Drawdown | -6.999% |
| Total Trades | 24 |
| Winning Trades | 19 (79.17%) |
| Losing Trades | 5 (20.83%) |
| Avg Winning Trade | +$1,419,920.16 |
| Avg Losing Trade | -$177,419.86 |
| Profit Factor | 8.003 |
| Sortino Ratio | 11.486 |
| Win/Loss Ratio | 8.003 |
⚙️ Default Settings:
Slippage: 0 ticks
Commission: 0.333% (Bybit standard)
📈 IV. 성과 지표 요약 (2018년 11월 14일 ~ 2025년 11월 8일)
|| 지표 | 값 |
|--------|-------|
| 초기 자본 | $1,000,000 |
| 순이익 | +$26,091,383.74 |
| 누적 수익률 | +2,609.14% |
| 최대 낙폭 | -6.999% |
| 총 거래 횟수 | 24 |
| 수익 거래 | 19 (79.17%) |
| 손실 거래 | 5 (20.83%) |
| 평균 수익 거래 | +$1,419,920.16 |
| 평균 손실 거래 | -$177,419.86 |
| 손익비 | 8.003 |
| 소르티노 비율 | 11.486 |
| 평균 손익 비율 | 8.003 |
⚙️ 기본 설정:
슬리피지: 0틱 (기본값)
수수료: 0.333% (Bybit 표준)
👥 V. Who Is This Strategy For?
✅ Long-term Bitcoin investors seeking stable, low-drawdown returns
✅ Traders tired of overtrading who prefer surgical, sniper-style precision entries
✅ Investors seeking psychological stability by avoiding large account swings
✅ Data-driven decision makers who value proven performance over marketing claims
👥 V. 이 전략은 누구를 위한 것인가요?
✅ 안정적이고 낮은 낙폭의 수익을 추구하는 장기 비트코인 투자자
✅ 과도한 매매에 지친 트레이더로 저격수 스타일의 정밀한 진입을 선호하는 분
✅ 큰 계좌 변동을 피하여 심리적 안정성을 추구하는 투자자
✅ 주장보다 검증된 객관적 성과를 중시하는 데이터 기반 의사 결정자
🔒 VI. Access & Disclaimer
🔐 Access Type: Invite-Only (Protected Source Code)
💬 How to Get Access: Send a private message or leave a comment below
⚠️ Important Disclaimer:
Past performance does not guarantee future results. Cryptocurrency and futures trading involve substantial risk of loss. This strategy is provided for educational and informational purposes only. Users should conduct their own research and consult with a financial advisor before making investment decisions. The author is not responsible for any financial losses incurred from using this strategy.
🔒 VI. 접근 방법 및 면책사항
🔐 접근 유형: 초대 전용 (소스코드 보호)
💬 접근 방법: 비공개 메시지 또는 아래 댓글 남기기
⚠️ 중요 면책사항:
과거 성과가 미래 결과를 보장하지 않습니다. 암호화폐 및 선물 거래는 상당한 손실 위험을 수반합니다. 본 전략은 교육 및 정보 제공 목적으로만 제공됩니다. 사용자는 투자 결정을 내리기 전 자체 조사를 수행하고 재무 자문가와 상담해야 합니다. 저자는 본 전략 사용으로 인한 재정적 손실에 대해 책임지지 않습니다.
🏷️ VII. Tags
Bitcoin |Bitcoin | BTCUSD | BTCUSD.P | Bybit | DailyChart | LongTerm | TrendFollowing | ADX | NonRepainting | Strategy | BacktestProven | SevenYears | LowDrawdown | HighProfitFactor | StableReturns | CapitalPreservation | Ichimoku | DMI | SuperTrend | TechnicalAnalysis | Volatility | RiskManagement | AutoTrading | Futures | PerpetualFutures | AlgorithmicTrading | SystematicTrading | DataDriven | InviteOnly | ProtectedScript | SnipperTrading | HighConviction | MDD | SortinoRatio
🏷️ VII. 태그
비트코인 |비트코인 | BTCUSD | BTCUSD.P | 바이비트 | 일봉 | 장기투자 | 추세추종 | ADX | 논리페인팅 | 전략 | 백테스트검증 | 7년검증 | 저낙폭 | 고손익비 | 안정수익 | 자본보존 | 일목균형표 | DMI | 슈퍼트렌드 | 기술적분석 | 변동성 | 위험관리 | 자동매매 | 선물 | 무기한선물 | 알고리즘트레이딩 | 시스템트레이딩 | 데이터기반 | 초대전용 | 보호스크립트 | 저격수트레이딩 | 고확신 | MDD | 소르티노비율
📌 Note: This strategy is designed exclusively for Bybit BTCUSD.P perpetual futures on the 1-day (daily) timeframe. Performance may vary significantly on other symbols or timeframes.
📌 참고: 본 전략은 Bybit BTCUSD.P 무기한 선물 계약의 1일봉(Daily) 타임프레임에 전용으로 설계되었습니다. 다른 심볼이나 타임프레임에서는 성과가 크게 달라질 수 있습니다.

[Bybit BTCUSD.P] 7Years Backtest Results. 2,609% +Non-Repainting
📊 I. Strategy Overview: Trust Backed by Numbers
The ADX Sniper v12 strategy has been rigorously tested over 7 years, from November 14, 2018 to November 8, 2025, spanning every major cycle of the Bitcoin BTCUSD.P futures market. This strategy successfully balances two often-conflicting goals: maximizing profitability while minimizing volatility, all supported by objective performance data.
This strategy has been validated across all Bitcoin (BTCUSD.P) futures market cycles over a 7-year period.
■ Visual Proof: Bar Replay Simulation
The chart above demonstrates actual entry and exit points captured via TradingView's Bar Replay feature. The green rectangle highlights the core profitable trading zone, showing where the strategy successfully captured sustained uptrends. This visual evidence confirms:
1) Confirmed buy/sell signals with exact execution prices (marked in red and blue)
2) No repainting or signal distortion after candle close
3) Consistent performance across multiple market cycles within the highlighted zone
💰 Core Performance Metrics:
Cumulative Return : 2,609.14% (compounded growth over 7 years)
Maximum Drawdown (MDD) : 6.999% (preserving over 93% of capital)
Average Profit/Loss Ratio : 8.003 (industry-leading risk-reward efficiency)
Total Trades : 24 (focused exclusively on high-conviction opportunities)
Sortino Ratio : 11.486 (mathematically proving robustness and stability)
✅ This strategy has been validated across all Bitcoin BTCUSD.P futures market cycles over a 7-year period.
🛡️ II. Core Philosophy: Cut Losses Short, Let Profits Run
Why MDD Stays Below 7% in a Volatile Market
The crypto futures market typically experiences daily volatility exceeding 10%, with most strategies enduring drawdowns between 30% and 50%. In stark contrast, this strategy has never exceeded a 7% account loss over seven years. This exceptional low MDD is achieved through deliberate design mechanisms, not luck:
🎯 Entry Filtering: The 'ADX Pop-up Filter' is the core component. It enables the strategy to strictly avoid trading when market conditions indicate major reversals or consolidation phases, thereby minimizing exposure to high-risk zones.
🏛️ Capital Preservation Priority: The strategy prioritizes investor psychological stability and capital preservation over pursuing maximum potential returns.
The Power of an 8.003 Profit Factor
The Profit Factor measures the ratio of total profitable trades to total losing trades. It's the most critical metric for assessing risk-adjusted returns.
A Profit Factor of 8.003 means that for every dollar lost, the strategy earns an average of eight dollars. This demonstrates the efficiency of a true trend-following strategy:
Cutting losses quickly (averaging $177,419 USD loss per trade)
Riding winners for maximum extension (averaging $1,419,920 USD profit per trade)
🎯 III. Strategy Reliability and Structural Edge
The Secret of 24 Trades in 7 Years
Only 24 trades over 7 years signifies that this strategy ignores 99% of market volatility and targets only the 1% of 'most certain buying cycles'. This approach eliminates the drag from excessive trading:
❌ No commission bleed
❌ No slippage erosion
❌ No psychological wear from overtrading
📈 Long-Term Trend Following: The strategy analyzes Bitcoin's long-term price cycles to capture the onset of massive trends while remaining undisturbed by short-term market noise.
Non-Repainting Structure: Alignment of Reality and Simulation
🎬 Non-Repainting Proof Video Available
※↑ "If you wish, I can also show you a video as evidence of the non-repainting throughout the 7 years."
✅ Real-Time Trading Reliability: This strategy is built with a non-repainting structure, generating buy/sell signals only after each candle's closing price is confirmed.
✅ Preventing Data Exaggeration: This design ensures that backtest results do not 'repaint' or distort past performance, guaranteeing high correlation between simulated results and actual live trading environments.
✅ Live Trading Advantage: While simulations use closing prices, live trading may allow entry at more favorable prices before candle close, potentially yielding even better execution than backtest results.
📈 IV. Performance Summary (November 14, 2018 - November 8, 2025)
|| Metric | Value |
|--------|-------|
| Initial Capital | $1,000,000 |
| Net Profit | +$26,091,383.74 |
| Cumulative Return | +2,609.14% |
| Maximum Drawdown | -6.999% |
| Total Trades | 24 |
| Winning Trades | 19 (79.17%) |
| Losing Trades | 5 (20.83%) |
| Avg Winning Trade | +$1,419,920.16 |
| Avg Losing Trade | -$177,419.86 |
| Profit Factor | 8.003 |
| Sortino Ratio | 11.486 |
| Win/Loss Ratio | 8.003 |
⚙️ Default Settings:
Slippage: 0 ticks
Commission: 0.333% (Bybit standard)
👥 V. Who Is This Strategy For?
✅ Long-term Bitcoin investors seeking stable, low-drawdown returns
✅ Traders tired of overtrading who prefer surgical, sniper-style precision entries
✅ Investors seeking psychological stability by avoiding large account swings
✅ Data-driven decision makers who value proven performance over marketing claims
🔒 VI. Access & Disclaimer
🔐 Access Type: Invite-Only (Protected Source Code)
💬 How to Get Access: Send a private message or leave a comment below
⚠️ Important Disclaimer:
Past performance does not guarantee future results. Cryptocurrency and futures trading involve substantial risk of loss. This strategy is provided for educational and informational purposes only. Users should conduct their own research and consult with a financial advisor before making investment decisions. The author is not responsible for any financial losses incurred from using this strategy.
🏷️ VII. Tags
Bitcoin |Bitcoin | BTCUSD | BTCUSD.P | Bybit | DailyChart | LongTerm | TrendFollowing | ADX | NonRepainting | Strategy | BacktestProven | SevenYears | LowDrawdown | HighProfitFactor | StableReturns | CapitalPreservation | Ichimoku | DMI | SuperTrend | TechnicalAnalysis | Volatility | RiskManagement | AutoTrading | Futures | PerpetualFutures | AlgorithmicTrading | SystematicTrading | DataDriven | InviteOnly | ProtectedScript | SnipperTrading | HighConviction | MDD | SortinoRatio
📌 Note: This strategy is designed exclusively for Bybit BTCUSD.P perpetual futures on the 1-day (daily) timeframe. Performance may vary significantly on other symbols or timeframes.

BTC 1h StratUses LuxAlgo-style Support/Resistance levels (pivot-based, with volume break labels).
Adds momentum confirmation (RSI + MACD) to filter fakeouts.Keeps your swing breakout logic (close above swing high / below swing low).
Includes liquidity and TP/SL risk management.

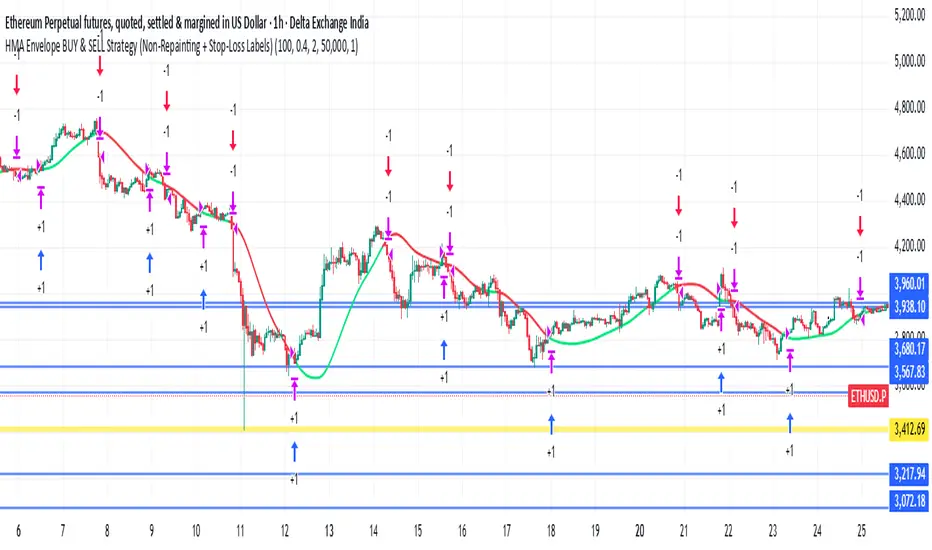
HMA Envelope BUY & SELL Strategy (Non-Repainting BY RAVI KHADSE)Done — I put the HMA Envelope BUY & SELL Strategy (Non-Repainting) script into the canvas as a code file.
Open the canvas document titled HMA Envelope BUY & SELL Strategy (Non-Repainting) to copy the Pine Script into TradingView.
MULTI time FRAME/session filter, different entry logic, alerts,
Kronos Scalper (RAVINDRA KHADSE) 11.11.2025Nice — below is a ready-to-copy TradingView Pine Script (v5) strategy named “Kronos Scalper”.
It’s a self-contained scalping strategy (non-repainting) with configurable EMAs trend filter, RSI entry filter, ATR-based stop loss / take profit, optional trailing stop, plots and entry/exit labels. Drop it into TradingView’s Pine editor and Add to Chart → Strategy Tester.

Quasimodo Pattern Strategy Back Test [TradingFinder] QM Trading🔵 Introduction
The QM pattern, also known as the Quasimodo pattern, is one of the popular patterns in price action, and it is often used by technical analysts. The QM pattern is used to identify trend reversals and provides a very good risk-to-reward ratio. One of the advantages of the QM pattern is its high frequency and visibility in charts.
Additionally, due to its strength, it is highly profitable, and as mentioned, its risk-to-reward ratio is very good. The QM pattern is highly popular among traders in supply and demand, and traders also use this pattern.
The Price Action QM pattern, like other Price Action patterns, has two types: Bullish QM and Bearish QM patterns. To identify this pattern, you need to be familiar with its types to recognize it.
🔵 Identifying the QM Pattern
🟣 Bullish QM
In the bullish QM pattern, as you can see in the image below, an LL and HH are formed. As you can see, the neckline is marked as a dashed line. When the price reaches this range, it will start its upward movement.
🟣 Bearish QM
The Price Action QM pattern also has a bearish pattern. As you can see in the image below, initially, an HH and LL are formed. The neckline in this image is the dashed line, and when the LL is formed, the price reaches this neckline. However, it cannot pass it, and the downward trend resumes.
🔵 How to Use
The Quasimodo pattern is one of the clearest structures used to identify market reversals. It is built around the concept of a structural break followed by a pullback into an area of trapped liquidity. Instead of relying on lagging indicators, this pattern focuses purely on price action and how the market reacts after exhausting one side of liquidity. When understood correctly, it provides traders with precise entry points at the transition between trend phases.
🟣 Bullish Quasimodo
A bullish Quasimodo forms after a clear downtrend when sellers start losing control. The market continues to make lower lows until a sudden higher high appears, signaling that buyers are entering with strength. Price then pulls back to retest the previous low, creating what is known as the Quasimodo low.
This area often becomes the final trap for sellers before the market shifts upward. A visible rejection or displacement from this zone confirms bullish momentum. Traders usually place entries near this level, stops below the low, and targets at previous highs or the next resistance zone. Combining the setup with demand zones or Fair Value Gaps increases its accuracy.
🟣 Bearish Quasimodo
A bearish Quasimodo forms near the top of an uptrend when buyers begin to lose strength. The market continues to make higher highs until a sudden lower low breaks the bullish structure, showing that selling pressure is entering the market. Price then retraces upward to retest the previous high, forming the Quasimodo high, where breakout buyers are often trapped.
Once rejection appears at this level, it indicates a likely reversal. Traders can enter short near this area, with stop-losses placed above the high and targets near the next support or previous lows. The setup gains more reliability when aligned with supply zones, SMT divergence, or bearish Fair Value Gaps.
🔵 Setting
Pivot Period : You can use this parameter to use your desired period to identify the QM pattern. By default, this parameter is set to the number 5.
Take Profit Mode : You can choose your desired Take Profit in three ways. Based on the logic of the QM strategy, you can select two Take Profit levels, TP1 and TP2. You can also choose your take profit based on the Reward to Risk ratio. You must enter your desired R/R in the Reward to Risk Ratio parameter.
Stop Loss Refine : The loss limit of the QM strategy is based on its logic on the Head pattern. You can refine it using the ATR Refine option to prevent Stop Hunt. You can enter your desired coefficient in the Stop Loss ATR Adjustment Coefficient parameter.
Reward to Risk Ratio : If you set Take Profit Mode to R/R, you must enter your desired R/R here. For example, if your loss limit is 10 pips and you set R/R to 2, your take profit will be reached when the price is 20 pips away from your entry point.
Stop Loss ATR Adjustment Coefficient : If you set Stop Loss Refine to ATR Refine, you must adjust your loss limit coefficient here. For example, if your buy position's loss limit is at the price of 1000, and your ATR is 10, if you set Stop Loss ATR Adjustment Coefficient to 2, your loss limit will be at the price of 980.
Entry Level Validity : Determines how long the Entry level remains valid. The higher the level, the longer the entry level will remain valid. By default it is 2 and it can be set between 2 and 15.
🔵 Results
The following examples show the backtest results of the Quasimodo (QM) strategy in action. Each image is based on specific settings for the symbol, timeframe, and input parameters, illustrating how the QM logic can generate signals under different market conditions. The detailed configuration for each backtest is also displayed on the image.
⚠ Important Note : Even with identical settings and the same symbol, results may vary slightly across different brokers due to data feed variations and pricing differences.
Default Properties of Backtests :
OANDA:XAUUSD | TimeFrame: 5min | Duration: 1 Year :
BINANCE:BTCUSD | TimeFrame: 5min | Duration: 1 Year :
CAPITALCOM:US30 | TimeFrame: 5min | Duration: 1 Year :
NASDAQ:QQQ | TimeFrame: 5min | Duration: 5 Year :
OANDA:EURUSD | TimeFrame: 5min | Duration: 5 Year :
PEPPERSTONE:US500 | TimeFrame: 5min | Duration: 5 Year :

Multi-EMA Session Breakout Strategythis is a strategy that use the session high and low and the EMA LOWS 2 3 6 9 110 355 AND 480
Multi-EMA Strategy (Low Source)this strategy use the ema low for its functionality 8 9 110 355 and 480

Final Scalping Strategy - RELAXED ENTRY, jangan gopoh braderEMA Scalping System (MTF) Guide (1HR direction, 15 min entry)
Objective
To capture small, consistent profits by entering trades when 15-minute momentum aligns with the 1-hour trend.
Trades are executed only during high-liquidity London and New York sessions to increase the probability of execution and success.
Strategy Setup
Chart Timeframe (Execution): 15-Minute (M15).
Trend Filter (HTF): 1-Hour (H1) chart data is used for the long-term EMA.
Long-Term Trend Filter: 50-Period EMA (based on H1 data).
Short-Term Momentum Signal: 20-Period EMA (based on M15 data).
Risk
Metric: 14-period ATR for dynamic Stop Loss calculation.
✅ Trading Rules🟢
Long (Buy) Entry Conditions
Session: Must be within the London (0800-1700 GMT) or New York (1300-2200 GMT) sessions.
HTF Trend: Current price must be above the 1-Hour EMA 50.
Momentum Signal: Price crosses above the 15-Minute EMA 20.
Confirmation: The bar immediately following the crossover must close above the 15-Minute EMA 20.
Ent
ry: A market order is executed on the close of the confirmation candle.
🔴 Short (Sell) Entry Conditions
Session: Must be within the London (0800-1700 GMT) or New York (1300-2200 GMT) sessions.
HTF Trend: Current price must be below the 1-Hour EMA 50.
Momentum Signal: Price crosses below the 15-Minute EMA 20.
Confirmation: The bar immediately following the crossover must close below the 15-Minute EMA 20.
Entry: A market order is executed on the close of the confirmation candle.
🛑 Trade Management & Exits
Stop Loss (SL): Placed dynamically at 2.0 times the 14-period ATR distance from the entry candle's low (for Buys) or high (for Sells).
Take Profit (TP): Placed dynamically to achieve a 1.5 Risk-Reward Ratio (RR) (TP distance = 1.5 x SL d
istance).
📊 On-Chart Visuals
Detailed Labels: A box appears on the entry bar showing the action, SL/TP prices, Risk/Reward in Pips, and the exact R:R ratio.
Horizontal Lines: Dashed lines display the calculated SL (Red) and TP (Green) levels while the trade is active.
Background: The chart background is shaded to highlight the active London and New York tradi
ng sessions.

XAutoTrade Alert Builder v1.1Automate Your NinjaTrader Trading with TradingView Alerts
The XAutoTrade Alert Builder is a flexible Pine Script strategy that bridges TradingView alerts with
NinjaTrader automated trading. Design custom entry signals, configure exit strategies, and execute trades
automatically on your NinjaTrader account - all from TradingView charts.
Key Features
📊 Flexible Signal Logic
- Configure buy/sell signals independently
- Compare any two indicators or price sources using crossover, crossunder, greater than, or less than
logic
- Visual buy/sell markers on chart for easy signal verification
🎯 Multiple Exit Methods
1. ATM Strategy - Leverage your existing NinjaTrader ATM templates for advanced order management
2. Source Signals - Exit positions based on opposite entry signals
3. Fixed Levels - Set stop loss and profit targets using ticks or percentage
⚙️ NinjaTrader Integration
- Direct webhook integration with XAutoTrade backend service
- Multi-account support (trade multiple accounts simultaneously)
- Position sizing and max position limits
- Market or limit order types with configurable offset
- Time-in-force options (DAY/GTC)
- Active hours filter (US ET timezone) to control when alerts execute
🔐 Secure & Reliable
- Webhook secret authentication
- Symbol override capability
- Real-time status indicator showing configuration readiness
How It Works
1. Configure Entry Signals - Choose your buy/sell logic by comparing any two data sources (price,
indicators, etc.)
2. Set Exit Strategy - Select ATM templates, signal-based exits, or fixed stop/profit levels
3. Connect to NinjaTrader - Enter your XAutoTrade webhook secret and account details
4. Create Alert - Use the strategy's alert system to send formatted JSON payloads to your XAutoTrade
webhook
5. Trade Futures & Stocks Automatically - TradingView alerts trigger real trades in your NinjaTrader account
Perfect For
- Traders wanting to automate TradingView strategies in NinjaTrader
- Users with existing ATM templates who want TradingView signal automation
- Multi-account traders managing several NinjaTrader accounts
- Anyone seeking a no-code bridge between TradingView and NinjaTrader
Requirements
- Active XAutoTrade account and subscription
- NinjaTrader 8 with XAutoTrade AddOn installed
- TradingView Premium/Pro account (for webhook alerts)

NEXT GEN INSPIRED BY OLIVER VELEZDYOR NFA
1. Initial Setup & Application
Load the Strategy to your desired chart (e.g., EURUSD M5, as suggested by the script's backtest).
Overlay: Ensure the script is set to overlay=true (which it is) so the signals and Moving Averages plot directly on the price chart.
Equity Management: Review the initial strategy settings for capital and position sizing:
Initial Capital: Defaults to 10,000.
Default Qty Type: Set to strategy.percent_of_equity (22%), meaning 22% of your available equity is used per trade. Adjust this percentage based on your personal risk tolerance.
2. Reviewing Key Indicator Inputs
The script uses default values that are optimized, but you can adjust them in the settings panel:
Fast EMA: Defaults to 9 (e.g., a 9-period Exponential Moving Average).
Slow EMA: Defaults to 21 (e.g., a 21-period Exponential Moving Average). These EMAs define the short-term trend.
ATR: Defaults to 14 (Average True Range). Used to dynamically calculate volatility for SL/TP distances.
Final R:R: Defaults to 4.5 (minimum R:R required for a signal). This is the core of the strategy's high reward goal.
3. Interpreting Entry Signals
A trade signal is generated only when all conditions—EMA trend, "Elephant Logic" momentum, and non-ranging market—are met.
Long Signal: Appears as a green triangle (▲) below the bar, labeled "COMBO".
Short Signal: Appears as a red triangle (▼) above the bar, labeled "COMBO".
Live Plan: Upon signal, a detailed label is immediately plotted on the chart showing the FULL BATTLE PLAN:
SL: Calculated Stop Loss price.
TP: Calculated Take Profit price (based on the Final R:R).
Risk/Reward Pips: The calculated pips for the trade's risk and reward.
R:R = 1:4.5: The exact Risk-to-Reward ratio.
4. Understanding Market Conditions & Visuals
The script provides visuals to help you understand the current market state:
Trend EMAs: The 9 EMA (green) and 21 EMA (purple/magenta) are plotted to show the underlying trend.
Long trades only fire when Price > 9 EMA > 21 EMA.
Short trades only fire when Price < 9 EMA < 21 EMA.
Ranging Market (Rejection): Bars turn a light gray/silver when the proprietary "Reject Ranging" logic is active, indicating a low-volatility period. No new trades will be taken during these bars.
Momentum Bar: Bars turn a gold/yellow color when the "Elephant Logic" (high-momentum, large-body candles over 2-3 periods) is detected, highlighting powerful price movement.
5. Execution and Exit Logic
The strategy handles entry, scaling, and exit automatically:
Entry: A market order is placed (strategy.entry) immediately upon the bar where the longSetup or shortSetup condition is met.
Scaling Out (+1R): If the trade moves favorably by an amount equal to the initial risk (1R), the script closes a portion of the position (strategy.close with comment "+1R"). This partial exit locks in profit equivalent to the initial risk.
Re-entry (Pyramiding): After the +1R exit, the strategy attempts a re-entry (LONG RE/SHORT RE diamond plot) if the price meets certain criteria near the 9 EMA, trying to capitalize on further trend continuation.
Final Exits:
Take Profit: A limit order is set at the calculated TP level (stopDist * minRR).
Stop Loss: A stop order is set at the calculated SL level (stopDist * 1.3), slightly wider than the initial SL distance, likely to account for spread/slippage, ensuring the maximum loss is defined.
Trailing Stop: A trailing stop is applied to the re-entry positions (LONG RE/SHORT RE) to protect profits as the market moves further in the direction of the trade.

Velocity SmartMoney Engine work - Delta Exchange📈 Velocity SmartMoney Engine
Adaptive Breakout & Order Block Strategy with Dynamic Risk Control
---
🔍 Overview
The Velocity SmartMoney Engine is a next-generation trading strategy that fuses Smart Money breakout logic , Order Block structure detection , and Supertrend-based directional filtering into one precision-built system.
It identifies institutional-level breakouts , manages positions with ATR-based adaptive risk , and executes disciplined exits using stop-loss, trailing stop, and profit target logic.
Designed for swing and short-term system traders, this strategy performs excellently on BTC, ETH, NIFTY, BANKNIFTY, Gold, and major FX pairs — best on 15m to 4h timeframes .
---
⚙️ Core Components
1️⃣ Smart Money Breakout Logic
Detects real breakouts using dynamic support/resistance pivots.
Confirms entries only during strong volatility bursts.
Avoids false breakouts in sideways markets.
2️⃣ Order Block Gap Detection
Finds institutional imbalance zones (Smart Money footprints).
Bullish gaps = Long bias; Bearish gaps = Short bias.
Works with candle confirmation and momentum validation.
3️⃣ Supertrend Directional Filter
Trades only in direction of Supertrend bias.
Exits instantly when Supertrend flips.
Prevents entries against dominant trend.
4️⃣ ATR-Based Risk & Volatility Filter
Uses ATR × multiplier for adaptive stop sizing.
Volatility filter ensures trades trigger only during active markets.
Avoids whipsaw zones.
---
💰 Position Management
Stop-Loss: Adaptive ATR-based.
Take-Profit: Default 5% target (editable input).
Trailing Stop: Auto-adjusts to lock profits.
No-Exit Hold: Hold position for defined candles before exits.
Supertrend Flip Exit: Instant trend-based closure.
---
🧠 Built-In Trade Discipline
One-trade-per-bar guard prevents duplicate entries.
Volatility-weighted breakout validation.
Clean and conflict-free exit hierarchy.
---
🎯 Key Features
✅ Smart Money breakout + Order Block fusion
✅ Supertrend-based trend confirmation
✅ ATR dynamic stop + 5% profit target
✅ Adaptive trailing logic
✅ One-trade-per-bar control
✅ Works across Crypto, Indices, FX, Commodities
✅ Ideal for 1h–4h swing setups
---
📊 Recommended Settings
Parameter | Typical Value | Purpose
--- | --- | ---
Levels Period | 20 | Pivot lookback for S/R zones
Volatility Filter | 20–40 | Filters out low-momentum areas
ATR Multiplier | 1.5 | Adjust stop size by volatility
Supertrend Length | 10 | ATR period for trend bias
Supertrend Multiplier | 3.0 | Supertrend sensitivity
Target Profit | 5% | Default take-profit level
---
⚡ Suggested Use
• Best suited for swing entries on 1H / 4H charts .
• Combine with session filters or trend confluence for automation.
• Ideal as a base module for TradingView + Broker integrations .
---
🧩 Disclaimer
This script is for educational purposes only .
Past performance does not guarantee future returns.
Use responsibly. The developer assumes no liability for financial losses.
---
💬 Community & Access
Developed by: Shubham Singh
Version: Velocity SmartMoney Engine v1.0
For premium modules & automation: DM "Velocity Access" on chat to request access.
---
© 2025 Velocity SmartMoney Engine — All Rights Reserved
