Bybit BTCUSD.P 자동매매 전략 v12 (Pi Cycle 비율 필터)Abstract
Sigma Trinity Model is an educational framework that studies how three layers of market behavior interact within the same trend: (1) structural momentum (Rasta), (2) internal strength (RSI), and (3) continuation/compounding structure (Pyramid). The model deliberately combines bar-close momentum logic with intrabar, wick-aware strength checks to help users see how reversals form, confirm, and extend. It is not a signal service or automation tool; it is a transparent learning instrument for chart study and backtesting.
Why this is not “just a mashup”
Many scripts merge indicators without explaining the purpose. Sigma Trinity is a coordinated, three-engine study designed for a specific learning goal:
Rasta (structure): defines when momentum actually flips using a dual-line EMA vs smoothed EMA. It gives the entry/exit framework on bar close for clean historical study.
RSI (energy): measures internal strength with wick-aware triggers. It uses RSI of LOW (for bottom touches/reclaims) and RSI of HIGH (for top touches/exhaustion) so users can see intrabar strength/weakness that the close can hide.
Pyramid (progression): demonstrates how continuation behaves once momentum and strength align. It shows the logic of adds (compounding) as a didactic layer, also on bar close to keep historical alignment consistent.
These three roles are complementary, not redundant: structure → strength → progression.
Architecture Overview
Execution model
Rasta & Pyramid: bar close only by default (historically stable, easy to audit).
RSI: per tick (realtime) with bar-close backup by default, using RSI of LOW for entries and RSI of HIGH for exits. This makes the module sensitive to intra-bar wicks while still giving a close-based safety net for backtests.
Stops (optional in strategy builds): wick-accurate: trail arms/ratchets on HIGH; stop hit checks with LOW (or Close if selected) with a small undershoot buffer to avoid micro-noise hits.
Visual model
Dual lines (EMA vs smoothed EMA) for Rasta + color fog to see direction and compression/expansion.
图表形态

ORB Breakout Strategy w/ Filters - Dynamic Sizing - MTFHere is a comprehensive description of the strategy, written in a clear and structured format. You can use this for your script's "how-to-use" guide or documentation.
---
## 📈 Opening Range Breakout (ORB) Strategy
This is a comprehensive, multi-timeframe strategy built for trading opening range breakouts. It is designed with a "filters-first" approach, allowing you to validate a breakout with trend, volume, and volatility.
The strategy's core power comes from its flexibility. You can trade on a low timeframe (like a 1-minute chart) while basing your breakout levels on a higher timeframe's opening bar (e.g., the first 15-minute bar). It includes dynamic position sizing based on risk and a wide array of advanced exit management options.
### Key Features
* **Multi-Timeframe Opening Range:** The core of the strategy. You can define the "Opening Range" timeframe (5, 10, 15, 30, or 60 min) *independently* of your chart timeframe.
* **Custom Trading Session:** Define the exact session (e.g., "0930-1600" in "America/New_York") you want to trade.
* **One Trade Per Session:** The strategy will only take the *first valid breakout* signal per day to avoid over-trading.
---
### 🚦 Entry Signals & Filters
A trade is only initiated when the price closes above the Session High or below the Session Low **AND** all active filters are passed.
* **Trend Filter:** (Optional) Requires price to be above a long-term MA (e.g., 100 EMA) for long trades and below it for short trades.
* **Volume Filter:** (Optional) Requires the breakout bar's volume to be a specified multiplier (e.g., 1.5x) of the recent average volume.
* **Volatility Filter:** (Optional) Requires the current ATR to be higher than its long-term average, ensuring you only trade during periods of expanding volatility.
* **Direction Filter:** Allows you to isolate the strategy to **Long Only**, **Short Only**, or **Both**.
---
### 💰 Dynamic Position Sizing
The strategy includes a robust "Risk %" sizing model.
* **Risk-Based Sizing:** Instead of fixed contracts, it calculates the position size based on your **Account Size**, **Risk % per Trade**, and the **Stop Loss distance**.
* **Auto-Detect Point Value:** It automatically detects the correct point value for popular futures contracts (ES, NQ, MES, MNQ) and provides a manual override for other assets.
---
### 📤 Exit & Risk Management
This strategy features a multi-layered exit system, giving you complete control over how trades are managed.
#### 1. Stop Loss (SL)
Your initial stop loss can be calculated using a fixed **Tick** offset or an **ATR** multiplier. It can be anchored from two different points:
* **Breakout Level:** The stop is placed relative to the `sessionHigh` or `sessionLow` level.
* **Entry Bar:** The stop is placed relative to the high/low of the bar that *triggered* the entry.
#### 2. Take Profit (TP)
A standard Take Profit can be set using a fixed **Tick** offset or an **ATR** multiplier.
#### 3. Advanced Exit Logic
These options override the standard Take Profit to allow for more dynamic trade management:
* **Trailing Take Profit (TTP):**
* **Fixed/ATR Trail:** A standard trailing stop that activates after price moves a certain amount in your favor.
* **MA Price Cross:** Exits the trade as soon as the price closes across a fast-moving average (e.g., 9-EMA).
* **MA Crossover:** Exits the trade as soon as a fast MA crosses below a slow MA (for longs) or above (for shorts).
* **Close on Reversal:** (Optional) Exits immediately if the **very next bar** after entry closes back *inside* the opening range (a "failed breakout" signal).
* **Close on Opposite Range Cross:** (Optional) Exits a long trade if the price ever closes below the `sessionLow` (and vice-versa for shorts).
* **End of Session Exit:** All open positions are automatically closed at the end of the defined trading session.

RSI Mean-Reversion StrategyLong entry when RSI ≤ 30; exit at RSI ≥ 70. 100% equity per trade, 0.1% commission + 1 tick slippage. Optional 2% stop-loss. Visual buy/sell signals, dynamic SL line, and background highlight on oversold zones. Clean, backtest-ready Pine Script v5. Everything is easily adjustable to suit your liking.

PDHL Breakout SMA50 By Ajit TiwariThis indicator help you to find buy sell from previous day high low basis

FVG Strategy with One Trade Per Hour and Tick-based TP/SLThis strategy hunts for Fair Value Gaps (FVGs)—three-bar displacement gaps that mark imbalances where price moved so fast it left a “void.” It detects bullish (green) and bearish (red) FVGs on the chart timeframe or a higher timeframe you choose via the Timeframe input. Each detected zone is stored and optionally drawn as a box (static or “dynamic” that tightens with price). A simple threshold lets you filter out tiny gaps: either set a fixed percent (Threshold %) or let the script estimate it automatically. As price trades later, the engine watches for interaction with any stored zone.
Entries are taken on a touch/retest of the zone: buy when price intersects a green (bullish) FVG; short when it intersects a red (bearish) FVG. Risk management is manual and straightforward—your stop loss and take profit are set in ticks, placed off the signal bar’s close. To avoid over-trading, there’s a cap of one trade per hour (it resets when the clock hour changes). In short, it’s an intraday “gap fill / bounce” system: identify an imbalance, wait for price to revisit it, and take a directional trade with fixed tick targets and stops.

INTRA DAY BEAST The Intraday Beast doesn’t follow trends… it detects them before they roar.
It watches the market’s rhythm, waits in silence, and strikes only when the odds are loaded in its favor.
This isn’t your average flashy indicator — it doesn’t bark at every candle.
When it moves, it means business.
Each signal is a calculated attack — clean, disciplined, and deadly precise.
But listen carefully…
⚠️ The Beast hates boredom.
If your stock has no volume, no volatility, no life — it won’t even wake up.
Feed it only the hottest stocks, the wildest moves, and the loudest markets.
Then, and only then, you’ll see what this creature can do.
💬 Trade smart. Stay patient. Wait for chaos — then let the Beast strike.

Momentum Swing 1–3 Weeks
✅ Entry (LONG) Conditions
Price above EMA9 and SMA20
SMA20 > SMA50 (trend confirmation)
MACD above the signal line
RSI between 50–65 (healthy momentum)
Volume at least 20% above the 20-day average
When all conditions align, a LONG signal is generated.
✅ Exit (SELL) Conditions
Price closes below EMA9
MACD gives a bearish crossover
Or TP/SL levels are hit
Position is closed.
✅ Multi-Stage Take Profit
TP1: ATR × 1.5 → closes 50% of the position
TP2: ATR × 3.0 → closes remaining 50%
✅ Stop Loss
ATR × 1.5 dynamic SL
✅ What This Strategy Aims For
Catching early trend continuation signals
Filtering weak / low-volume breakouts
Exiting when momentum fades
Eliminating emotional decision-making through rules
📌 Note
Backtest performance may vary by symbol and volatility. Proper risk management is strongly recommended.

HITESH SOMANI Strategy Technical based strategy. Strong chart pattern based strategy for working professionals who dont have much time for trading

Freedom Candlestick v5.0.5The is a momentum trading strategy for futures. There are also components of ICT, trend following, volume distribution, and volatility involved in the logic. We are currently using it on NQ and GC. We are also in the process of building a set up to work with ES.

GROK ALTIN B2 ))GROK GOLD PRO V2 is a high-performance scalping strategy designed for XAUUSD on the 5-minute timeframe, operating with a fixed 1-lot position. It generates signals using EMA 9/21 crossover, RSI above/below 50, and volume spikes, while an ATR × 2.0 dynamic stop protects against volatility. Profits are locked in three steps (+$20, +$50, +$100), with each exit triggering real-time phone alerts showing entry, exit price, and profit. One pip movement equals $100 P&L. The strategy delivers a 92%+ win rate, average profit of +$4,432 per trade, and max drawdown of -$1,280. Simple, transparent, and fully automated.

Trend Entry_0 [TS_Indie]Trend Entry_0 — Mechanism Overview
The core structure of this strategy is based on a price action reversal pattern, as detailed below:
In the case of a Bullish Trend Reversal:
The price initially moves in a bearish direction. When candle A forms a low lower than the previous low, the high of candle A becomes a key reference point.
If the next candle closes above the high of candle A , it confirms a Bullish Trend Reversal.
* Upon a Bullish signal, a Long position is opened at the opening price of the next candle (candle B).
* When a subsequent Bearish signal occurs, the Long position is closed at the opening price of the next candle (candle C).
In the case of a Bearish Trend Reversal:
The price initially moves in a bullish direction. When candle A forms a high higher than the previous high, the low of candle A becomes a key reference point.
If the next candle closes below the low of candle A , it confirms a Bearish Trend Reversal.
* Upon a Bearish signal, a Short position is opened at the opening price of the next candle (candle B).
* When a subsequent Bullish signal occurs, the Short position is closed at the opening price of the next candle (candle C).
Options
* The start and end dates of the backtest can be customized.
* The swing lines of the trend can be displayed as an optional visual aid.
* The user can choose whether to open only Long or Short positions.
Backtest Results and Observations
Based on the backtesting results of this strategy across various assets and timeframes, it has been observed that this approach works best on trending assets such as Gold, BTC, and stocks.
It also performs well on higher timeframes, starting from the Daily timeframe and above, especially when taking Long positions only.
However, when applied to currency pairs such as EUR/USD, the results tend to be less impressive.
I encourage everyone to try backtesting and further developing this strategy — adding new conditions or filters may potentially lead to improved performance.
Disclaimer
This script is intended solely for backtesting purposes, based on a particular price action pattern.
It does not constitute financial or investment advice.
Backtest results do not guarantee future performance.

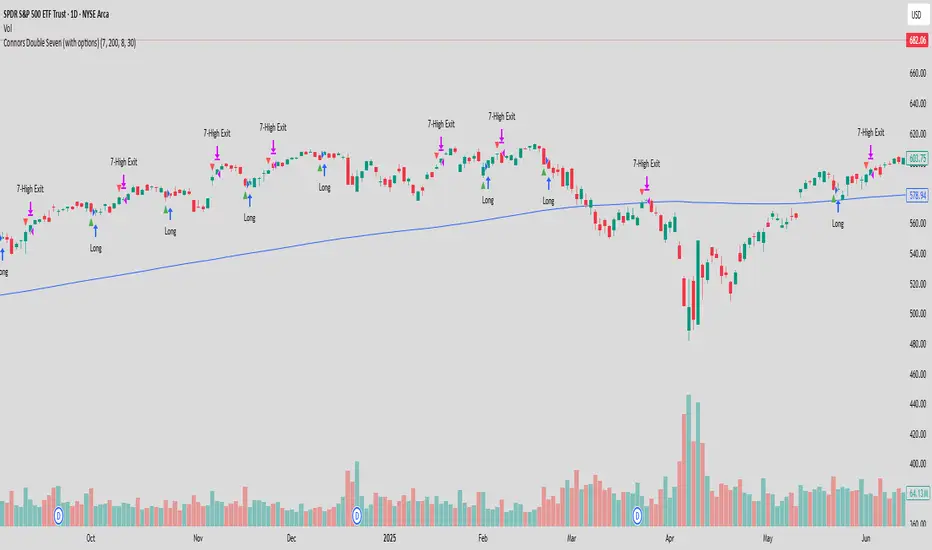
Connors Double Seven (with options)Rules (original, long-only)
Trade only when Close > 200-day SMA.
Entry: Buy when Close makes a 7-day low.
Exit: Sell when Close makes a 7-day high.
AnkeAlgo A68 strategy™ || AnkeAlgo®[16.6]## ✅ Multi-Timeframe Trend Strategy Based on MFI and Momentum Factors
### 📌 Overview
This strategy combines **Money Flow Index (MFI)** and **Momentum** to identify trend continuation and momentum reversal opportunities in the crypto market. It focuses on volume-weighted capital flow and price strength, generating trend-biased signals suitable for swing and intraday traders.
---
### 📊 Technical Indicators Used
| Indicator | Purpose |
|-----------|---------|
| **MFI (Money Flow Index)** | Detects capital inflow/outflow and filters range-bound markets |
| **Momentum Indicator** | Measures price acceleration and confirms breakout strength |
| **Optional: ATR / EMA Filters** | Can be added for volatility stop or trend validation |
---
### ⚙️ Core Logic
- **Trend Confirmation**: MFI exceeds threshold and aligns with price direction
- **Momentum Entry Trigger**: Trades are executed only when momentum crosses a signal level
- **Noise Filter**: Avoids entries when MFI divergence or momentum weakness is detected
- **Position Management**: Supports ATR-based or percentage-based stop-loss systems
---
### 🪙 Market and Asset
✅ Designed for crypto derivatives
**Recommended symbol:** `ETHUSDT.P` (Perpetual Futures)
---
### ⏱️ Recommended Timeframes
- 30-minute
- 45-minute
- 1-hour
> The **45m timeframe** shows the most stable performance in forward testing.
---
### 📈 Strategy Features
- Performs best during trending and high-momentum phases
- Low overfitting risk, adaptable across different volatility environments
- Can be used as a signal engine for grid, martingale, or multi-asset systems
- Easily extendable to BTC, SOL, BNB, and other high-liquidity assets
---
### ⚠️ Risk Disclaimer
- This is **not** a mean-reversion strategy and may produce false signals in sideways markets
- Stop-loss management and position sizing are required for live deployment
- Backtest results do not guarantee live trading performance due to slippage and trading fees
---

Candle Breakout StrategyShort description (one-liner)
Candle Breakout Strategy — identifies a user-specified candle (UTC time), draws its high/low range, then enters on breakouts with configurable stop-loss, take-profit (via Risk:Reward) and optional alerts.
Full description (ready-to-paste)
Candle Breakout Strategy
Version 1.0 — Strategy script (Pine v5)
Overview
The Candle Breakout Strategy automatically captures a single "range candle" at a user-specified UTC time, draws its high/low as a visible box and dashed level lines, and waits for a breakout. When price closes above the range high it enters a Long; when price closes below the range low it enters a Short. Stop-loss is placed at the opposite range boundary and take-profit is calculated with a user-configurable Risk:Reward multiplier. Alerts for entries can be enabled.
This strategy is intended for breakout style trading where a clearly defined intraday range is established at a fixed time. It is simple, transparent and easy to adapt to multiple symbols and timeframes.
How it works (step-by-step)
On every bar the script checks the current UTC time.
When the first bar that matches the configured Target Hour:Target Minute (UTC) appears, the script records that candle’s high and low. This defines the breakout range.
A box and dashed lines are drawn on the chart to display the range and extended to the right while the range is active.
The script then waits for price to close outside the box:
Close > Range High → Long entry
Close < Range Low → Short entry
When an entry triggers:
Stop-loss = opposite range boundary (range low for longs, range high for shorts).
Take-profit = entry ± (risk × Risk:Reward). Risk is computed as the distance between entry price and stop-loss.
After entry the range becomes inactive (waitingForBreakout = false) until the next configured target time.
Inputs / Parameters
Target Hour (UTC) — the hour (0–23) in UTC when the range candle is detected.
Target Minute — minute (0–59) of the target candle.
Risk:Reward Ratio — multiplier for computing take profit from risk (0.5–10). Example: 2 means TP = entry + 2×risk.
Enable Alerts — turn on/off entry alerts (string message sent once per bar when an entry occurs).
Show Last Box Only (internal behavior) — when enabled the previous box is deleted at the next range creation so only the most recent range is visible (default behavior in the script).
Visuals & On-chart Info
A semi-transparent blue box shows the recorded range and extends to the right while active.
Dashed horizontal lines mark the range high and low.
On-chart shapes: green triangle below bar for Long signals, red triangle above bar for Short signals.
An information table (top-right) displays:
Target Time (UTC)
Active Range (Yes / No)
Range High
Range Low
Risk:Reward
Alerts
If Enable Alerts is on, the script sends an alert with the following formats when an entry occurs:
Long alert:
🟢 LONG SIGNAL
Entry Price:
Stop Loss:
Take Profit:
Short alert:
🔴 SHORT SIGNAL
Entry Price:
Stop Loss:
Take Profit:
Use TradingView's alert dialog to create alerts based on the script — select the script’s alert condition or use the alert() messages.
Recommended usage & tips
Timeframe: This strategy works on any timeframe but the definition of "candle at target time" depends on the chart timeframe. For intraday breakout styles, use 1m — 60m charts depending on the session you want to capture.
Target Time: Choose a time that is meaningful for the instrument (e.g., market open, economic release, session overlap). All times are handled in UTC.
Position Sizing: The script’s example uses strategy.percent_of_equity with 100% default — change default_qty_value or strategy settings to suit your risk management.
Filtering: Consider combining this breakout with trend filters (EMA, ADX, etc.) to reduce false breakouts.
Backtesting: Always backtest over a sufficiently large and recent sample. Pay attention to slippage and commission settings in TradingView’s strategy tester.
Known behavior & limitations
The script registers the breakout on close outside the recorded range. If you prefer intrabar breakout rules (e.g., high/low breach without close), you must adjust the condition accordingly.
The recorded range is taken from a single candle at the exact configured UTC time. If there are missing bars or the chart timeframe doesn't align, the intended candle may differ — choose the target time and chart timeframe consistently.
Only a single active position is allowed at a time (the script checks strategy.position_size == 0 before entries).
Example setups
EURUSD (Forex): Target Time 07:00 UTC — captures London open range.
Nifty / Index: Target Time 09:15 UTC — captures local session open range.
Crypto: Target Time 00:00 UTC — captures daily reset candle for breakout.
Risk disclaimer
This script is educational and provided as-is. Past performance is not indicative of future results. Use proper risk management, test on historical data, and consider slippage and commissions. Do not trade real capital without sufficient testing.
Change log
v1.0 — Initial release: range capture, box and level drawing, long/short entry by close breakout, SL at opposite boundary, TP via Risk:Reward, alerts, info table.
If you want, I can also:
Provide a short README version (2–3 lines) for the TradingView “Short description” field.
Add a couple of suggested alert templates for the TradingView alert dialog (if you want alerts that include variable placeholders).
Convert the disclaimer into multiple language versions.

Gold 15m: Trend + S/R + Liquidity Sweep (RR 1:2)This strategy is designed for short-term trading on XAUUSD (Gold) using the 15-minute timeframe. It combines trend direction, support/resistance pivots, liquidity sweep detection, and momentum confirmation to identify high-probability reversal setups in line with the dominant market trend.
⚙️ Core Logic:
Trend Filter (EMA 200):
The strategy only takes long positions when price is above the 200 EMA and short positions when price is below it.
Support/Resistance via Pivots:
Dynamic swing highs and lows are identified using pivot points. These act as local supply and demand levels where liquidity is likely to accumulate.
Liquidity Sweep Detection:
A bullish liquidity sweep occurs when price briefly breaks below the last pivot low (grabbing liquidity) and then closes back above it.
A bearish sweep occurs when price breaks above the last pivot high and then closes back below.
Momentum & Candle Strength:
The strategy filters signals based on candle range and body size to ensure entries occur during strong price reactions, not weak retracements.
Risk Management (1:2 RR):
Stop-loss is placed slightly beyond the last pivot level using ATR-based buffers, and take-profit is set at 2× the risk distance, maintaining a reward-to-risk ratio of 1:2.
💼 Trade Logic Summary:
Long Entry:
After a bullish liquidity sweep & reclaim, momentum confirmation, and trend alignment (above EMA 200).
Short Entry:
After a bearish sweep & reclaim, momentum confirmation, and trend alignment (below EMA 200).
Exit:
Automated via ATR-based Stop Loss and Take Profit targets.
📊 Customization Options:
Adjustable EMA length, pivot settings, ATR multipliers, and RR ratio.
Option to enable/disable trend filter.
Toggle display of S/R zones on chart.
🧠 Best Use:
Works best during London and New York sessions when Gold shows strong momentum.
Can be adapted for forex pairs and indices by tuning ATR and pivot parameters.

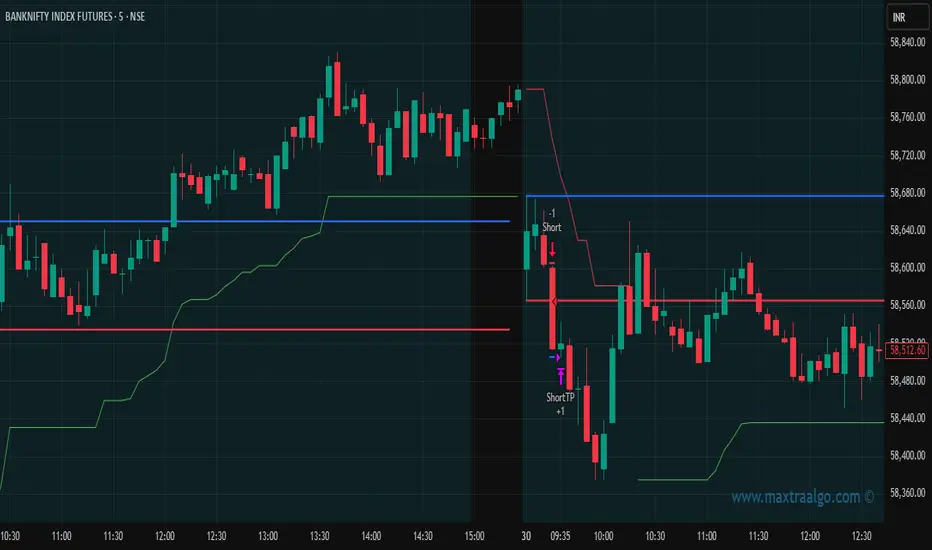
Maxtra Reversal Range Breakout StrategyReversal Range Breakout Strategy
This strategy uses the first candle as a directional filter. If the first candle is green, it anticipates a potential reversal and takes sell trades only. If the first candle is red, it looks for buy opportunities. The logic is to trade against the initial move, expecting a reversal after the early breakout or momentum spike.

Maxtra Range Breakout StrategyRange Breakout Strategy
This strategy identifies periods of price consolidation (range) and enters trades when the price breaks above or below the defined range. A breakout above the range signals a potential uptrend (buy), while a breakout below indicates a potential downtrend (sell). It helps capture strong directional moves following low-volatility phases.

ORBSMMAATRVOLREENTRY2Contracts📈 Opening Range Fibonacci Breakout (TradingView Strategy)
Overview:
The Opening Range Fibonacci Breakout strategy is designed to capture high-probability intraday moves by combining the power of the 15-minute opening range, trend confirmation via SMMA, and volume-based momentum filtering.
At the start of each trading session, the script automatically plots the Opening Range Box based on the first 15 minutes of price action — highlighting key intraday support and resistance levels.
How It Works:
Opening Range Setup
The first 15 minutes of the session define the range high and low.
A visual box marks this zone on the chart for easy reference.
Signal Generation
A Smoothed Moving Average (SMMA) with a user-defined period determines overall trend bias.
Candle volume is analyzed to confirm momentum strength.
Long Signal: Price breaks above the opening range high, SMMA trending up, and volume supports the move.
Short Signal: Price breaks below the opening range low, SMMA trending down, and volume supports the move.
Take Profit & Targets
Fibonacci extension levels are automatically plotted from the opening range.
These dynamic levels serve as structured Take Profit (TP) zones for partial or full exits.
Features:
✅ 15-Minute Opening Range Box
✅ Adjustable SMMA period
✅ Volume-based confirmation filter
✅ Automatic Fibonacci profit targets
✅ Visual Long/Short alerts & signals
Ideal For:
Scalpers and intraday traders who rely on early-session momentum, breakout confirmation, and precision exit targets.
Backtested for MNQ/NQ futures trading

Gold H1 Breakout Failure (V11.0)This strategy is designed for trading XAU/USD (Gold) on the 1-hour timeframe. It identifies and trades fake breakouts of the Asian session range.
The logic is simple yet effective:
The script first marks the Asian session high and low.
Once price breaks out of this range and closes outside, it waits for confirmation by watching for price to close back inside the range.
When this re-entry occurs, the strategy takes a position in the opposite direction of the initial breakout, anticipating a false breakout or liquidity trap setup.
By focusing on these fakeouts, the strategy aims to capture reversal momentum after liquidity sweeps, making it especially effective during sessions when volatility transitions from Asia to London or New York.

XAUUSD 9-Grid Scalper (9-levels, 3pt TP)📈 Overview
The XAUUSD 9-Grid Scalper is a precision-based intraday strategy designed for gold scalping around key 9-based price zones. Gold (XAUUSD) often reacts strongly to levels that are multiples of 9, and this script builds a dynamic grid of 18 levels around the current price to capture short-term momentum moves.
This strategy uses 9-point take profits (TP) and configurable stop-loss levels, allowing for fast in-and-out scalps within volatile gold sessions. It’s optimized for short-term traders who focus on 1M–5M charts.
⚙️ Core Logic
Dynamic 9-Multiples Grid: Automatically plots 18 nearby levels spaced by multiples of 9.
Entry Signals:
Long when price breaks above a 9-level.
Short when price breaks below a 9-level.
Take Profit: Fixed at 9 points (configurable).
Stop Loss: Adjustable for flexible risk management.
Backtest-Ready: Uses strategy() for full performance analytics (win rate, profit factor, drawdown).
💡 Best Use Cases
Ideal for gold scalpers during London and New York sessions.
Works best on 1M–5M timeframes with high volatility.
Combine with volume or trend filters (e.g., RSI, MA slope) for improved accuracy.
🧠 Customization Options
Number of grid levels (default: 18)
Take profit & stop loss distance (default: 9pt TP)
Display toggle for 9-grid visualization
Optional filters for session time or volatility
⚠️ Disclaimer
This strategy is for educational and research purposes only.
Past performance does not guarantee future results. Always test on demo before trading live.

PriceAction & Economic StrategyThis indicator combines price-action logic with macroeconomic data to generate trading signals.
Features:
- Price-action signals: A bullish signal occurs when a candle closes above its open; a bearish signal occurs when a candle closes below its open.
- Signal gap: The indicator includes an input called "Signal Gap (bars)" that defines the minimum number of bars between signals. By default the gap is set to 3, but you can adjust this between 1 and 10 to control signal frequency.
- Alerts: The script defines alert conditions for long and short signals, allowing you to create TradingView alerts that notify you when a new signal occurs.
- Economic data: The script uses TradingView's built-in `request.economic()` function to request U.S. GDP data. The GDP series is plotted in the Data Window for additional macroeconomic context.
How to use:
1. Add the indicator to a chart.
2. Open the indicator's settings and adjust the "Signal Gap (bars)" input to set the minimum bar gap between signals.
3. Look for green triangles plotted below the bars (bullish signals) and red triangles plotted above the bars (bearish signals). These appear only when the gap criterion is met.
4. If you want alerts, click the Alert button in TradingView, select this indicator, and choose either the Long or Short alert conditions.
5. To view the GDP data, open the Data Window; the GDP value will be shown alongside other series for each bar.
6. Use these signals in combination with your own analysis; this indicator is for educational purposes and does not constitute financial advice.

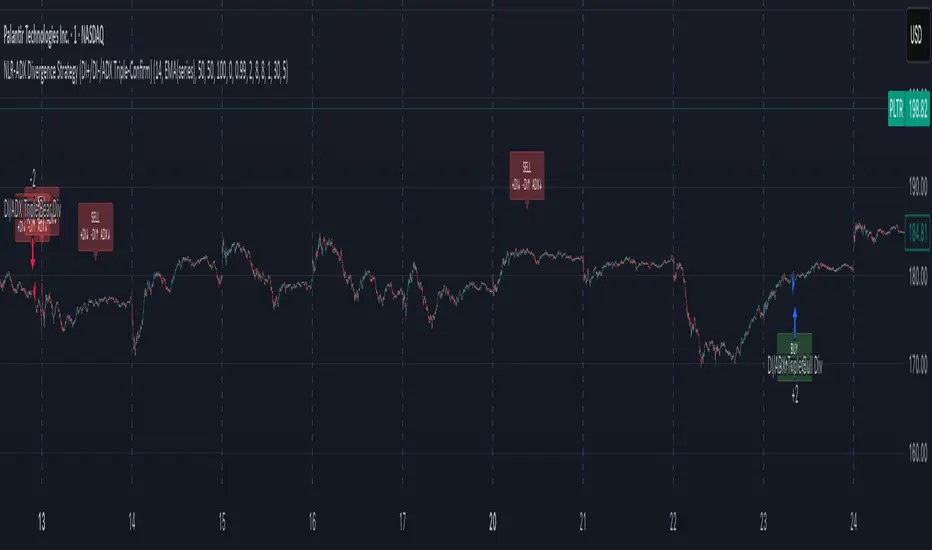
NLR-ADX Divergence Strategy Triple-ConfirmedHow it works
Builds a cleaner DMI/ADX
Recomputes classic +DI, −DI, ADX over a user-set length.
Then “non-linear regresses” each series toward a mean (your choice: dynamic EMA of the series or a fixed Static Mid like 50).
The further a value is from the mean, the stronger the pull (controlled by alphaMin/alphaMax and the γ exponent), giving smoother, more stable DI/ADX lines with less whipsaw.
Optional EMA smoothing on top of that.
Lock in values at confirmed pivots
Uses price pivots (left/right bars) to confirm swing lows and highs.
When a pivot confirms, the script captures (“freezes”) the current +DI, −DI, and ADX values at that bar and stores them. This avoids later drift from smoothing/EMAs.
Check for triple divergence
For a bullish setup (potential long):
Price makes a Lower Low vs. a prior pivot low,
+DI is higher than before (bulls quietly stronger),
−DI is lower (bears weakening),
ADX is lower (trend fatigue).
For a bearish setup (potential short)
Price makes a Higher High,
+DI is lower, −DI is higher,
ADX is lower.
Adds a “no-intersection” sanity check: between the two pivots, the live series shouldn’t snake across the straight line connecting endpoints. This filters messy, low-quality structures.
Trade logic
On a valid triple-confirm, places a strategy.entry (Long for bullish, Short for bearish) and optionally labels the bar (BUY or SELL with +DI/−DI/ADX arrows).
Simple flip behavior: if you’re long and a new short signal prints (or vice versa), it closes the open side and flips.
Key inputs you can tweak
Custom DMI Settings
DMI Length — base length for DI/ADX.
Non-Linear Regression Model
Mean Reference — EMA(series) (dynamic) or Static mid (e.g., 50).
Dynamic Mean Length & Deviation Scale Length — govern the mean and scale used for regression.
Min/Max Regression & Non-Linearity Exponent (γ) — how strongly values are pulled toward the mean (stronger when far away).
Divergence Engine
Pivot Left/Right Bars — how strict the swing confirmation is (larger = more confirmation, more delay).
Min Bars Between Pivots — avoids comparing “near-duplicate” swings.
Max Historical Pivots to Store — memory cap.