My S.T.A.C.K.📊 My S.T.A.C.K. (Simplified TA Combined Kit)
All your favorite technical tools in one clean, customizable overlay.
My S.T.A.C.K. is a power-packed indicator designed to streamline your chart by combining the most commonly used technical analysis tools into a single, space-saving script. Whether you're a trend trader, swing trader, or just looking to declutter your view — this kit gives you everything you need, nothing you don’t.
🔧 Features:
5 Customizable Moving Averages: Choose your type (SMA, EMA, WMA, etc.) and periods to match your strategy.
Bollinger Bands: Visualize volatility and overbought/oversold zones with precision.
Donchian Channels: Spot breakouts and trend reversals based on high/low ranges.
ATR Bands: Adaptive support/resistance zones based on Average True Range.
Clean Visualization: Toggle each element on or off, adjust colors, and focus only on what matters.
✅ Ideal For:
- Traders who want multiple indicators in one place
- Reducing indicator clutter on TradingView
- Quick visual analysis without switching scripts
Combined

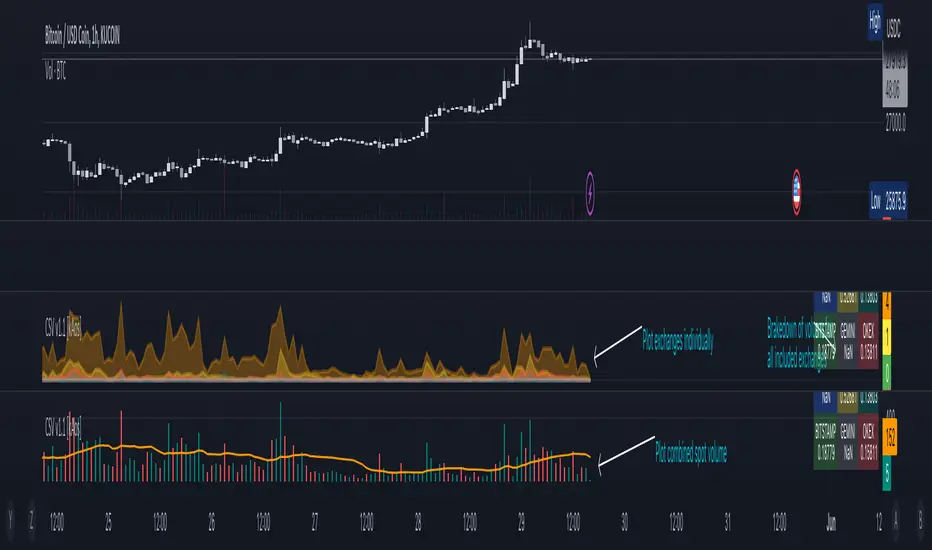
Combined Spot Volume | Crypto v1.1 [kAos]This script combines the "ticker volume" from 9 different exchanges. The default settings are for Crypto Assets only. In the settings window you can choose to plot the "combined volume" in a histogram form or "individual exchange volume" in an area view. (as shown on the chart) Addition to the plots there is also an Info Table in the bottom right corner that brakes down the volume to individual exchanges, shows how much volume was traded on which exchange. If the Table shows "NaN" on an exchange you need to check the spelling of that exchange, if thats correct, than the ticker is not available on that exchange.
Import Forex Volume from 5 biggest FX Brokers (single/combined) Some Brokers like Forex.com don't show Volume for FX. This indicator allows user to import Volume from a range of FX brokers that DO show volume
-Combine the reported volumes from all five brokers: FXCM, GLOBALPRIME, PEPPERSTONE, Currency.com, OANDA. Or pick a specific broker to import volume from.
-Image above shows combined Volume from the big 5 brokers, with added notes on the 2yr average of various broker's volumes; showing their size in descending order.
-Works across timeframes & FX pairs. Standard color formatting options Added.
//notes:
~default settings pull/combine volume from all 5 brokers. History goes back to Sept 2019 (due to GlobalPrime's later start date in publishing Volume data).
~~toggle ON 'only show FXCM, Pepperstone & Oanda' for a LONGER history, going back to June 2012.
~individual broker feeds: top checkbox toggled OFF, choose your preferred broker.
~~FXCM has both the longest history and the highest volume size of all the brokers.
~Table (toggle on/off) shows the broker feed (which broker(s) volume is on display) and the SMA 100 to give an idea of relative size.
//Cautionary note:
Volume is not as reliable in Forex as it is in Equities/commodities, due to unreported Inter-bank trades; the broker volumes do not give the full picture, but this is a best approximation of combined total volume based on brokers reported volume. The true volume will likely be much higher.
-Thank you @theEccentricTrader for the idea of pulling volume feed from other brokers.

Triple BB3 Bollinger Band Plots that are translucent in order to see where the bollinger bands align from 3 different resolutions.
Change the resolution to more closely represent the current chart. For example on a 1 hour chart you might choose Res1 as 30 minutes, Res2 as 1 hour, and Res3 as 2 hour.

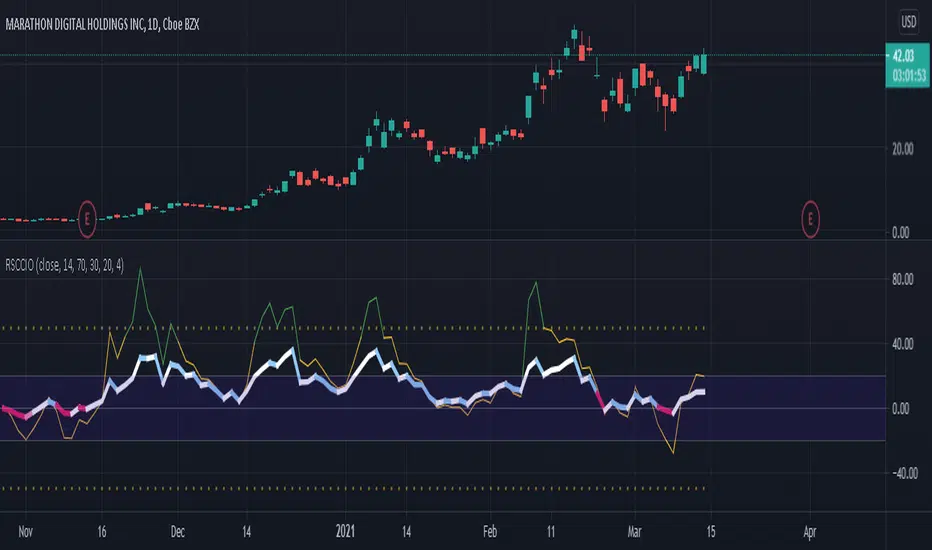
[SK] RSI/CCI Correlating OscillatorThe combination of RSI and CCI can be a powerful tool to efficiently signal the strength of the trend and upcoming reversals.
The magic comes when you're able to correlate both indicators correctly, this is the power I give you with the RSCCIO.
I've added additional features to each indicator that make signals more clear and easier to identify.
On the RSI
Directional color coding similar to what you can find on a MACD. This helps to identify the general trend ( above or below midline ) and the of the movement within.
For precise correlation the RSI is adjusted to a midline of 0. You can still enter the overbought/oversold levels as you'd expect on a regular RSI and it will be automatically adjusted.
On the CCI
Extreme strength / weakness color coding when the value exceeds the range makes signals more clear.
For precise correlation with the RSI, we need to scale down the value of the CCI with the Sensitivity Input. The default value works overall but feel free to play around to adjust the scale of the CCI movement.
---
RSI Relative Strength Index
The RSI is a momentum indicator that measures the magnitude of recent price changes. An asset is usually considered overbought when the RSI is above 70% and oversold when it is below 30%.
CCI Commodity Channel Index
The CCI was originally developed to spot trend changes. Use the CCI on the longer-term chart to establish the dominant trend and on the shorter-term chart to isolate pullbacks and generate trade signals.
[SK] Double MACDThe Double MACD indicator is precisely two different MACD indicators plotted on the same axis for precise visual correlation between each other.
This correlation provides more information than a single regular MACD by allowing you to compare the signals of a shorter timeframe to the default or longer timeframe,
showing the strength of the change in momentum and the peak of the momentum between both configurations.
The indicator has cloud options by default if you toggle on the MACD / Signal lines for better readability.
The cloud will change color to the line on top of it's set. This is to help you not get lost in the 4 different lines.
Customize the indicator to your preference and make it your own
If you'd like a candle like visualization, change the short MACD plot style to a histogram.
For a beautiful double bars style, select bars on both configurations and set the transparency to 30 - 40
For a dynamic moving average style, go with the line plot style ( default )
All MACD/Signal lines are toggled off by default, toggle them on in the inputs section.
On the styles panel, you can turn off the cloud fills or the lines.
Change all the colors you'd like!

Combined Momentum MA (Equal-Length EMA/SMA Crossover)Overview:
This momentum and trend-following strategy captures the majority of any trending move, and works well on high timeframes.
It uses an equal-period EMA and SMA crossover to detect trend acceleration/deceleration, since an EMA places a greater weight and significance on the most recent data.
To reduce noise and optimize entries, we combined this with an overall trend bias for further confluence.
How it works:
Signals are determined by the crossover of an EMA and SMA of the same length, e.g. EMA-50 and SMA-50.
The overall trend bias is determined using a slower SMA golden/death cross, e.g. SMA-50 and SMA-100.
The signal is stronger when it occurs in confluence with the overall trend bias, e.g. when EMA-50 crosses over SMA-50, while above the SMA-100. This is analogous to only opening long positions in a bull market.
Indicator description:
GREEN: Up Trend (EMA is above SMA, while EMA is above BIAS_MA. This shows a bullish confluence.)
YELLOW: No Trend (EMA/SMA crossover and BIAS_MA are not in confluence.)
RED = Down Trend (EMA is below SMA, while EMA is below BIAS_MA. This shows a bearish confluence.)

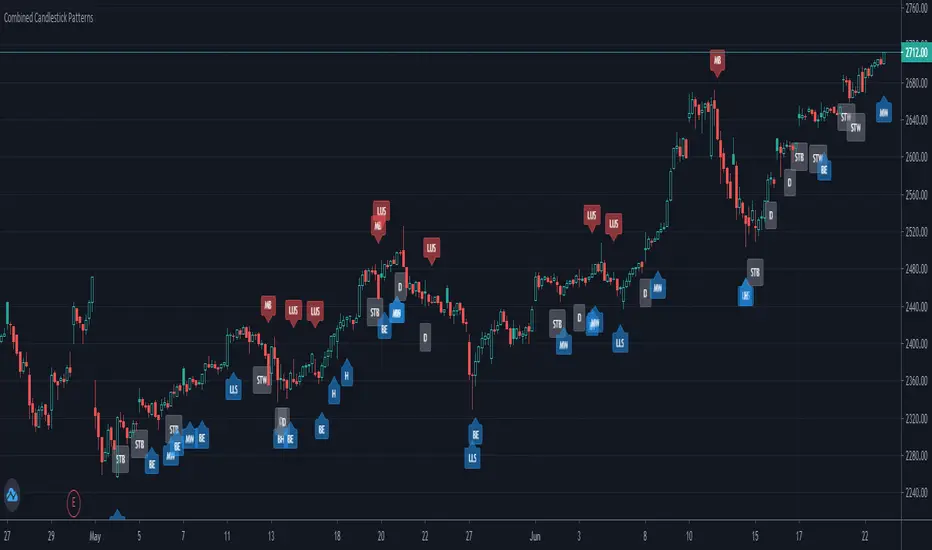
Combined Candlestick PatternsI combined all the build-in candlestick patterns scripts into one single script so anyone who does not have a Pro plan can display all the patterns in the same chart.
Leave a comment for any feedback!
8 EMA & 5 SMA ComboA combination of 8 EMA & 5 SMA to use with more advanced MA strategies and de-cluttering of indicator list.
To identify lines, Color combination should be somewhat warmer/lighter to cooler/darker colors.
EMA have a thicker line than the SMA. Color pairs have lighter/darker in cases where there are slight variations (when using one over another).

BTC Aggregate USD Volumeaggregated USD volume of BTC from Bittrex, Poloniex, OkCoin, Gemini, Binance, Bitstamp, Kraken, Bitfinex, Bitmex (leveraged), and Coinbase

HEAVI - HawkEye Aggregated Volume IndicatorThis is combined Aggregated BTC Exchange Volume by Neobutane with HawkEye volume clone indicator by LazyBear.
Indicator includes aggregated raw BTC volume from 9 user selectable fiat and tether exchanges + Exponential MA + hawkeye bar coloring where: green is bullish volume, red - bearish and white - volume neutral to the market:
Bitfinex
Coinbase
Bitstamp
Kraken
Binance
Poloniex
Bittrex
bitFlyer
Bithumb
