MVRV Ratio - R.BonaldiMVRV Ratio Indicator
The MVRV Ratio Indicator is a powerful tool for cryptocurrency traders and investors. It provides a visual representation of the Market Value to Realized Value ratio, helping you assess whether a cryptocurrency is overvalued or undervalued.
What is the MVRV Ratio?
Market Value: The current market price of the cryptocurrency multiplied by its circulating supply.
Realized Value: The average price at which each unit of the cryptocurrency was last moved on the blockchain, providing a more realistic view of its actual value.
How to Use This Indicator:
Identify Critical Levels:
The indicator displays a blue line representing the MVRV Ratio.
Horizontal lines at levels 1 (red) and 3 (green) help you quickly see significant thresholds.
When the blue line is below the red line (MVRV < 1), the cryptocurrency is considered undervalued.
When the blue line is above the green line (MVRV > 3), the cryptocurrency is considered overvalued.
Visual Cues:
The background turns red when the MVRV Ratio is below 1, indicating potential buying opportunities.
The background turns green when the MVRV Ratio is above 3, signaling potential selling opportunities.
Why Use the MVRV Ratio?
Risk Management: By identifying overvalued and undervalued conditions, you can make more informed decisions, reducing the risk of buying high and selling low.
Market Sentiment: The MVRV Ratio provides insight into market sentiment, helping you gauge the overall mood and potential future movements.
Timing: Use the indicator to time your entries and exits more effectively, aligning your trades with the underlying value of the cryptocurrency.
Whether you're a long-term investor looking to accumulate during undervalued periods or a short-term trader aiming to capitalize on overvalued spikes, the MVRV Ratio Indicator offers a clear and concise way to enhance your trading strategy.
累积量指标(CVI)

Price and Volume Stochastic Divergence [MW]Introduction
This indicator creates signals of interest for entering and exiting long and short positions on equities. It primarily uses up and down trends defined by the change in cumulative volume with some filtering provided by a short period exponential moving average (9 EMA by default).
Settings
Moving Average Period : The moving average over which the cumulative volume delta is calculated. Default: 14
Short Period EMA : The EMA used to represent price action, and is used to generate the EMA Delta line. Default: 27 (3*3*3)
Long Period EMA : The second EMA used to calculate the EMA Delta line. Default: 108 (2*2*3*3*3)
Stochastic K Value : The value used for stochastic curve smoothing. Default: 3
Dot Size : The diameter of the larger indicator. Default: 10
Dot Transparency : The transparency level of the outer ring of the primary BUY/SELL signal. Default: 50 (0 is opaque, 100 is transparent)
Band Distance from 0 to 100 : The upper and lower band distance. Default: 20
Calculations
The cumulative volume delta (CVD) is calculated using candle bodies and wicks. For a red candle, buying volume is calculated by multiplying the volume by the spread percentage of the average of the top and bottom wicks, while Selling Volume is calculated multiplying the volume by the spread percentage of the average of the top and bottom wicks - in addition to the spread percentage of the candle body.
For a green candle, buying volume is calculated by multiplying the volume by the spread percentage of the average of the top and bottom wicks - plus the spread percentage of the candle body - while Selling Volume is calculated using only the spread percentage average of the top and bottom wicks.
Once we have the CVD, we can then perform a stochastic calculation of the CVD value.
stochastic calculation = (current value - lowest value in period) / (highest value in period - lowest value in period)
We’ll do the same stochastic calculation for the short term EMA (27 EMA default) as well as for the difference between the short term and long term EMA.
When the stochastic CVD value is rising from zero and the short term EMA stochastic value equals 100, then it’s a major bullish signal. When the stochastic CVD value is falling from 100 and the short term EMA stochastic value equals 0, then it’s a major bearish signal.
Sometimes, after a bullish or bearish signal, the stochastic CVD will reverse direction triggering a new opposing signal.
How to Interpret
The CVD indicates when there is either more buying than selling or vice versa. A value over 50 for the stochastic CVD curve represents more buying taking place. A value below 50 represents more selling. One might intuitively believe that when there is more buying volume than selling volume that the price would follow suit. This is not always the case.
Most of the time buying volume will precede consistent price movement upwards, and selling volume will precede consistent price movement downwards. When this divergence occurs, the indicator generates a signal. When this divergence begins to fail, and buying or selling volume reverses, then another signal is generated indicating that the buying/selling impulse is headed back into the direction of price action.
These interactions are visually represented on the chart with the coral line that represents CVD, and the yellow line that represents the EMA, or the average price. When the coral line goes up and the yellow line stays down, that’s the BUY signal. When the coral line goes down and the yellow line stays up, that’s the sell signal. When the coral line switches direction, the chart generates another signal showing that volume is moving in a direction that supports the price.
The orange line represents the stochastic representation of the difference between the short EMA (27 by default) and the long EMA (108 by default). EMA differences is a method that can be used to define a trend. When a short term EMA is above a longer term EMA, that may represent a bullish trend. When it is below, that may represent a bearish trend. When all 3 lines are rising or falling in the same direction at the same time, it tends to indicate a movement that has the potential to continue.
Other Usage Notes and Limitations
It's important for traders to be aware of the limitations of any indicator and to use them as part of a broader, well-rounded trading strategy that includes risk management, fundamental analysis, and other tools that can help with reducing false signals, determining trend direction, and providing additional confirmation for a trade decision. Diversifying strategies and not relying solely on one type of indicator or analysis can help mitigate some of these risks.
This indicator can be paired with the MW Volume Impulse indicator if it is desired to see the actual buying and selling cumulative volume deltas. Also, in many cases, the BUY and SELL signals tend to correspond with Keltner Bands (ATR Bands) becoming extended. Lastly, volume weighted average price (VWAP) along with other macro events can impact price and negate signals. To view VWAP lines, you may choose to use the Multi VWAP or Multi VWAP for Gaps indicator to help ensure that the signals you see in this indicator are not being affected by VWAP lines.

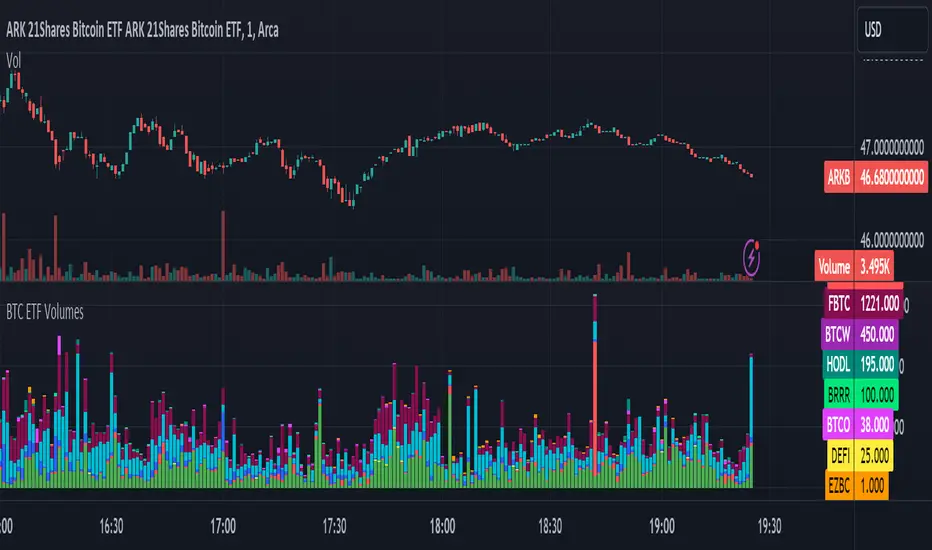
BTC ETF VolumesVolume
This script plots the trading volume of all BTC spot ETFs as well as the aggregate volume. Works on any chart and any timeframe.
Indicators
The volume of every ETF is plotted in a different color, with the total column adding up to the aggregate volume.
If you have price and indicator labels enabled you will also see individual ETF volume on your price scale on the right hand side.
If more BTC ETFs get launched I will add them.
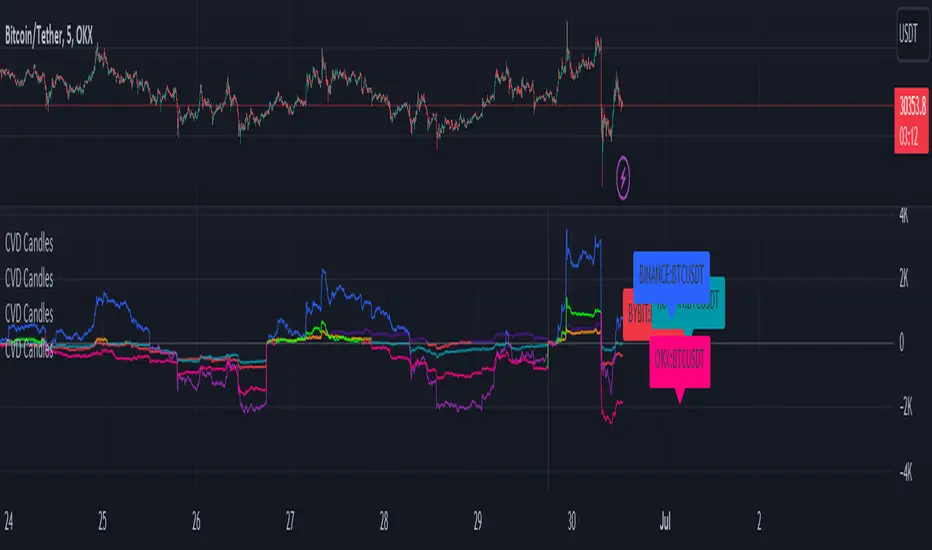
CVD+ - Multi Symbol Cumulative Volume DeltaEdit of TradingView's LTF CVD
TradingView's CVD is already the most accurate CVD on the platform because of the LTF data. The purpose of the edit is to provide the ability to compare volume flow between multiple exchanges, futures & spot, multiple symbols or any other potential use case. All in single layout or even a single pane.
Added features:
- Option to manually select a symbol from which to calculate the LTF CVD
- Option to normalize the selected symbol's CVD to the chart's symbol's CVD (Useful when you want to compare futures and spot on the same pane)
- Label that displays the selected symbol's name and exchange
- Changed presets to plot the CVD line as the predetermined option
All of TV's original features remain the same.
Strategy Myth-Busting #11 - TrendMagic+SqzMom+CDV - [MYN]This is part of a new series we are calling "Strategy Myth-Busting" where we take open public manual trading strategies and automate them. The goal is to not only validate the authenticity of the claims but to provide an automated version for traders who wish to trade autonomously.
Our 11th one is an automated version of the "Magic Trading Strategy : Most Profitable Indicator : 1 Minute Scalping Strategy Crypto" strategy from "Fx MENTOR US" who doesn't make any official claims but given the indicators he was using, it looked like on the surface that this might actually work. The strategy author uses this on the 1 minute and 3 minute timeframes on mostly FOREX and Heiken Ashi candles but as the title of his strategy indicates is designed for Crypto. So who knows..
To backtest this accurately and get a better picture we resolved the Heiken Ashi bars to standard candlesticks . Even so, I was unable to sustain any consistency in my results on either the 1 or 3 min time frames and both FOREX and Crypto. 10000% Busted.
This strategy uses a combination of 3 open-source public indicators:
Trend Magic by KivancOzbilgic
Squeeze Momentum by LazyBear
Cumulative Delta Volume by LonesomeTheBlue
Trend Magic consists of two main indicators to validate momentum and volatility. It uses an ATR like a trailing Stop to determine the overarching momentum and CCI as a means to validate volatility. Together these are used as the primary indicator in this strategy. When the CCI is above 0 this is confirmation of a volatility event is occurring with affirmation based upon current momentum (ATR).
The CCI volatility indicator gets confirmation by the the Cumulative Delta Volume indicator which calculates the difference between buying and selling pressure. Volume Delta is calculated by taking the difference of the volume that traded at the offer price and the volume that traded at the bid price. The more volume that is traded at the bid price, the more likely there is momentum in the market.
And lastly the Squeeze Momentum indicator which uses a combination of Bollinger Bands, Keltner Channels and Momentum are used to again confirm momentum and volatility. During periods of low volatility, Bollinger bands narrow and trade inside Keltner channels. They can only contract so much before it can’t contain the energy it’s been building. When the Bollinger bands come back out, it explodes higher. When we see the histogram bar exploding into green above 0 that is a clear confirmation of increased momentum and volatile. The opposite (red) below 0 is true when there are low periods. This indicator is used as a means to really determine when there is premium selling plays going on leading to big directional movements again confirming the positive or negative momentum and volatility direction.
If you know of or have a strategy you want to see myth-busted or just have an idea for one, please feel free to message me.
Trading Rules
1 - 3 min candles
FOREX or Crypto
Stop loss at swing high/low | 1.5 risk/ratio
Long Condition
Trend Magic line is Blue ( CCI is above 0) and above the current close on the bar
Squeeze Momentum's histogram bar is green/lime
Cumulative Delta Volume line is green
Short Condition
Trend Magic line is Red ( CCI is below 0) and below the current close on the bar
Squeeze Momentum's histogram bar is red/maroon
Cumulative Delta Volume line is peach

Realtime Cumulative DeltaThis is a Real time volume Delta indicator which has to run real time on the chart to capture observation.
Start it when the session starts and log the data and observe. It plots histograms as well as candlesticks of the the cumulative volume delta, from the style switch whichever you want.
It is done based on real time tick and not based on candlesticks, so the accuracy of volume delta is more. Uptick volumes are added as buy and downtick volumes as sell which is the actual way of calculating CVD
Apply the CVD concepts for trading results.

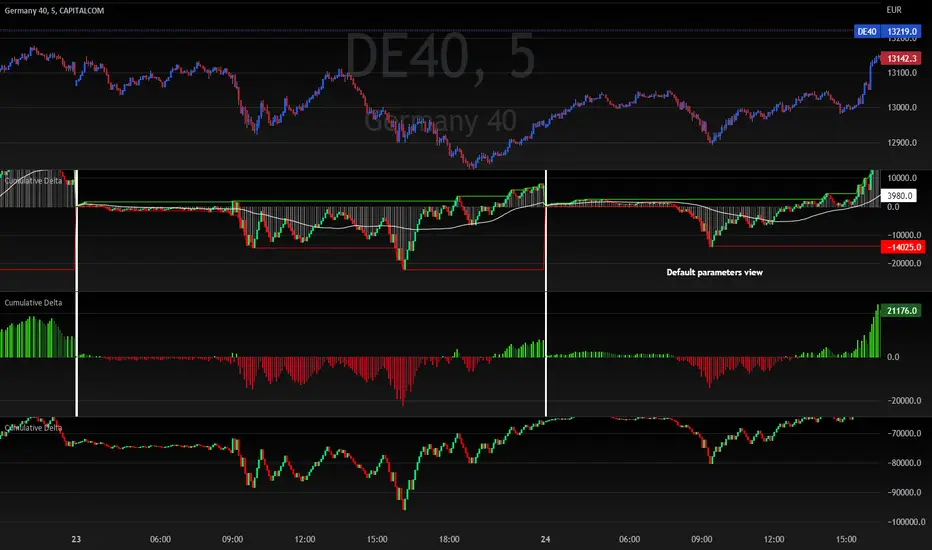
Cumulative DeltaThis scripts calculates the cumulative volume delta within the current day.
Options allow you to change the display type of this data (3 different configurations are given in the chart above)
The following options are available:
Colors selection
Reset cumulative delta everyday (can be disable to keep a continuous calculation of the delta over days)
Show histogram (used to display the delta as a positive/negative histogram)
Show daily High/Low levels (draw highest and lowest delta levels within the day)
Show candles (display the cumulative delta as candles)
Show Moving average (display a moving average which is reseted everyday at the same time as the cumulative delta itself)
Moving average length
This script will be updated if I feel the need to improve things or to add new features
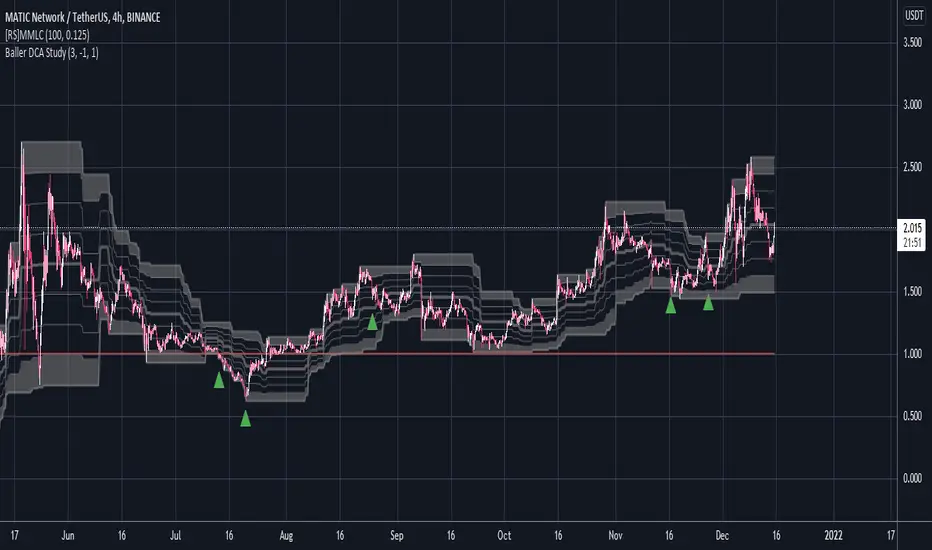
Baller DCA StudyFinds bottoms using CVI. Green arrow is the signal. Used for a DCA strategy in conjunction with MMLC
Baekdoo golden diamond signalHi forks,
I'm trader Baekdoosan who trading Equity from South Korea. This Baekdoo golden Diamond signal indicate good buying position to trade.
Here's the ideas
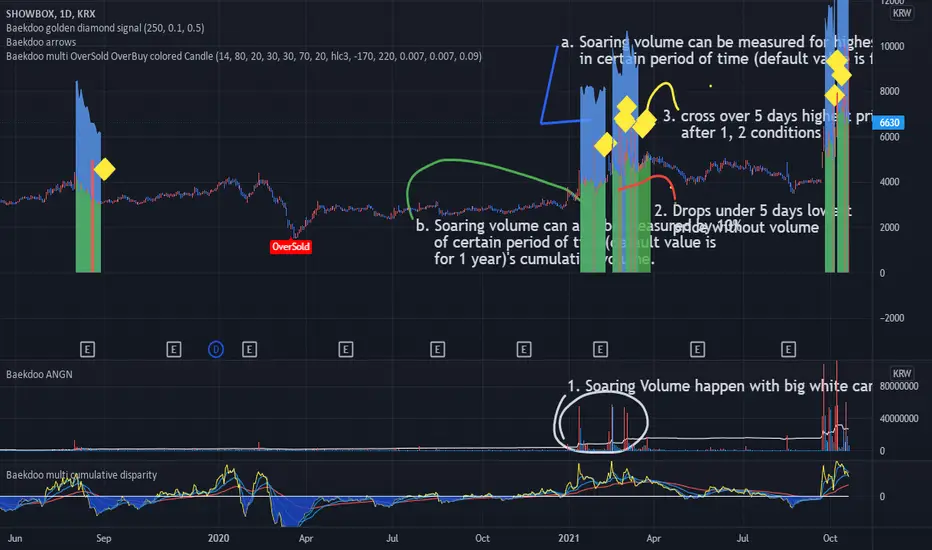
1. Soaring volume happen with big white candle.
a. Soaring volume can be measured for highest volume in certain period of time (default value is for 1 year). (blue area)
b. Soaring volume can also be measured by 10% of certain period of time(default value is for 1 year)'s cumulative volume . (green area) => you can adjust this ratio input. the higher value is the more likely to trail of whale
2. Drops under 5 days lowest price without volume . (red area) => I put half of average volume as default but you may can adjust it (the lower value is the more likely to soar again)
3. cross over 5 days highest price after 1, 2 conditions => Golden Diamond
underneath of this idea is, big chunk of the money comes and correction is on going but major whale's amount hold tight.
you can modify input values based on your investigation. It works well on day chart as well as minute chart. for the area with breaks plots are to checking the 1,2 conditions. so for final indicator will only be shown from this indicator but you can select plots if you think that is useful.
hope this will help your trading on equity as well as crypto. I didn't try it on futures . Best of luck all of you. Gazua~!
Baekdoo Golden Diamond signalHi forks,
I'm trader Baekdoosan who trading Equity from South Korea. This Baekdoo golden Diamond signal indicate good buying position to trade.
Here's the ideas
1. Soaring volume happen with big white candle.
a. Soaring volume can be measured for highest volume in certain period of time (default value is for 1 year). (blue area)
b. Soaring volume can also be measured by 10% of certain period of time(default value is for 1 year)'s cumulative volume. (green area) => you can adjust this ratio input. the higher value is the more likely to trail of whale
2. Drops under 5 days lowest price without volume. (red area) => I put half of average volume as default but you may can adjust it (the lower value is the more likely to soar again)
3. cross over 5 days highest price after 1, 2 conditions => Golden Diamond
underneath of this idea is, big chunk of the money comes and correction is on going but major whale's amount hold tight.
you can modify input values based on your investigation. It works well on day chart as well as minute chart. for the area with breaks plots are to checking the 1,2 conditions. so for final indicator will only be shown from this indicator but you can select plots if you think that is useful.
hope this will help your trading on equity as well as crypto. I didn't try it on futures . Best of luck all of you. Gazua~!

Market Breadth Indicator (percentage of US stocks above * SMA)This script is a revised version of jchang274's Multi-Sub script.
Add more feature from the original jchang274 script.
1.Compare 4 US STOCK INDEX ( Dowjones 30/NASDAQ100/RUSSELL2000/S&P500 ) in the same index of percentage of stocks above 20 /50/100/200 days simple moving average.
2. Use 4 index of percentage of stocks above 20 /50/100/200 days simple moving average,compare the same stock index ( Dowjones 30/NASDAQ100/RUSSELL2000/S&P500 )
How it begin?
Traders and investors use market breadth in order to assess the index’s overall health. Market breadth can be a reliable, if not an accurate, indicator of an upcoming price rise in the index. Similarly, it can also provide early warning signs for a future price decline.
What is it?
Market breadth indicators analyze the number of stocks advancing relative to those that are declining in a given index or on a stock exchange.
Market breadth refers to how many stocks are participating in a given move in an index or on a stock exchange. An index may be rising yet more than half the stocks in the index are falling because a small number of stocks have such large gains that they drag the whole index higher.
How it works?
Market breadth studies attempt to uncover strength or weakness in the movements of an index that are not visible simply by looking at a chart of the index.

U.S. Stocks & Options CVI to Bitcoin Correlation [NeoButane]Conceptual indicator based on trying to find an inverse correlation between bitcoin and traditional markets due to bitcoin's usefulness as a hedge against economic downturns.
How to use this script: you look at it and see if there is a correlation or not between bitcoin/Ethereum price and either U.S. stock CVi, buy volume, sell volume, calls, puts, or the call/put ratio.
