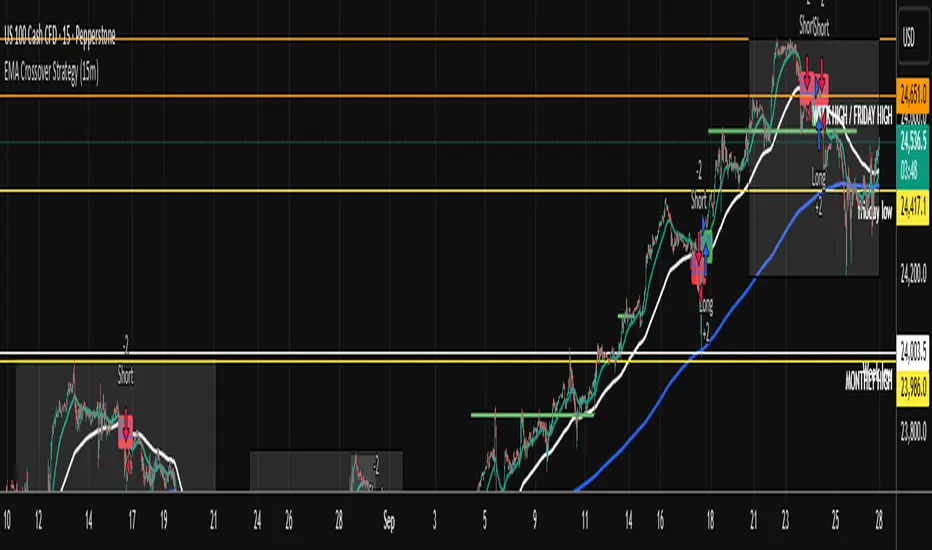
EMA Crossover Strategy (15m)50 and 200 ema crossing when leaving anchor. when 50 and 200 crosses will give you direction of where market is going. wait for a pull back and take trade. sl on highest or lowest point of apex tp open . when you see multiple equal ( low or High) get put of trade.
经济周期

MTF Regime + Breakout-Pullback by HarshMTF BTC regime filter + trend filter, Donchian breakout after a pullback, ATR‑based stop, 2 profit targets, trailing runner, and pyramiding into 3 tranches.

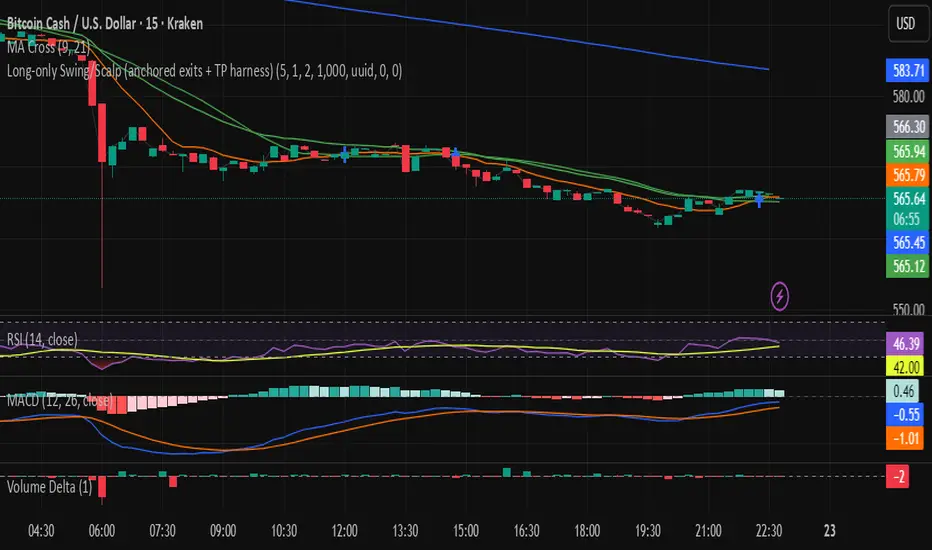
Long-only Swing/Scalp (anchored exits + TP harness) Traders PostThis is the Traders Post friendly drag and drop version of the swing/ scalp strategy for the algo traders out there. Let me know your thoughts, constructive criticism is always welcome.
Composite PR Signal (Trend↔Revert + ADX gate)Core Components
1. Dynamic Inputs
Max/PR windows (maxLen, prWin) – define historical lookbacks for oscillators and percentile ranks.
Smoothing (smooth) – applies an EMA filter to stabilize composite scores.
Threshold (th) – governs entry sensitivity.
Holding period (hBars) – maximum bars allowed in a trade.
Execution options – allow shorting, fast approximations for PR and CCI.
2. Custom Utility Functions
The script implements optimized versions of common TA operations:
Rolling sums, delays, and moving averages (EMA, RMA, SMA).
Lazy rolling extrema (efficient highest/lowest lookups).
Stateful arrays for tracking oscillator values across bars.
Fast approximations for percentile ranks and indicators.
3. Indicators Used
The system calculates a broad set of oscillators, including:
Trend/Momentum: ROC, TRIX, TSI, MACD histogram, OBV ROC, AO, CMF, BOP, UO, ADX.
Reversion/Oscillators: RSI, Stochastic K/D, MFI, Williams %R, CCI, CMO.
Each is converted into a percentile rank (PR) to normalize values between 0–100.
4. Composite Scoring
Two composite signals are built:
Trend Score – averages normalized outputs of momentum indicators.
Reversion Score – averages normalized outputs of oscillators prone to mean reversion.
ADX Gate – when ADX PR is high, the strategy favors trend score; when low, it favors reversion score.
Final score is smoothed and compared against entry thresholds.
5. Trade Logic
Entry:
Long: When composite score crosses above +th.
Short: When composite score crosses below -th (if enabled).
Exit:
Opposite crossover signal.
Or trade duration exceeds hBars.
6. Risk/Execution Parameters
Initial capital: 100,000
Commission: 0.01% per trade
Fixed order size: 100 units
No pyramiding
Intended Use
This script is designed for:
Swing trading across multiple assets (equities, forex, crypto).
Adapting to market regimes — capturing breakouts during strong trends, but fading moves when markets are choppy.
CoinGpt NQ策略# CoinGpt NQ 策略(MACD·多因子·可金字塔)
## 概述
**CoinGpt NQ策略**是一套面向 **纳指期货 NQ(建议:`CME_MINI:NQ1!`)30 分钟** 的可运行交易策略。
核心以 **MACD 趋势动量** 为骨架,叠加 **EMA 趋势过滤**、**可选金字塔加仓**、**三种出场模式(固定 TP/SL、追踪、追踪+TP)** 与 **风控上限**,提供三套一键预设(Balanced / Trend / Scalper),满足不同市场状态与风险偏好。
> 适配:期货/连续合约;仅做多(本脚本版本)。
> 时间框架:**30m**(可在“仅在 30m 生效”开关控制)。
---
## 进场逻辑
* **信号触发**:`MACD 上穿 Signal`(并要求直方图连续上升 2 根)。
* **趋势过滤**:价格位于 `EMA(p_emaLen)` 上方,且 `MACD>0 & Signal>0`(可关闭)。
* **时间框架限制**:默认仅在 30m 有效(可关闭)。
## 出场逻辑
* **固定 TP/SL**:按百分比计算限价止盈与止损。
* **追踪止盈**:默认以 **ATR 偏移** 跟踪;
* **追踪 + TP**:在拖尾的同时设置上沿 TP。
* **反向保护**:`MACD 下穿 Signal` 时市价平仓。
> 出场模式在输入项 **「出场模式」** 选择:
> `Auto(by preset) / Fixed TP/SL / Trailing / Trailing + TP`
---
## 金字塔加仓(可选)
* 仅在已有多单且不利回撤达到阈值时触发;
* 最多 `p_maxAdds` 层;每层在 **上次加仓价** 基础上按 `p_addStep%` 回撤触发;
* 目的:**拉低均价、提高持仓性价比**;采用小步长、有限层数控制回撤风险。
---
## 风险管理
* **当日最大亏损**:`strategy.risk.max_intraday_loss(p_maxDailyDD, %权益)`
* **单笔头寸上限**:`strategy.risk.max_position_size(p_posCapPct)`
* **订单量**(策略属性):默认 **90% 权益**。
* 实盘更建议:Balanced≈**40%**、Trend≈**35%**、Scalper≈**30%**(在“策略属性 → 订单大小”中调整)。
---
## 三套预设(参数一键生效)
| 预设 | MACD(fast/slow/signal) | 趋势EMA | 金字塔 | 加仓步长 | 固定TP/SL(%) | 追踪(ATR倍数) | 单笔上限 | 当日亏损 |
| ---------------- | ---------------------- | ----- | --- | ----- | ----------------- | --------- | ---- | ---- |
| **Balanced(默认)** | 8 / 21 / 5 | 233 | 2 层 | 0.12% | TP 0.22 / SL 0.15 | 1.2× | 50% | 1.5% |
| **Trend** | 10 / 24 / 7 | 200 | 3 层 | 0.10% | TP 0.25 / SL 0.18 | 1.6× | 45% | 1.2% |
| **Scalper** | 6 / 19 / 4 | 100 | 关闭 | —— | TP 0.18 / SL 0.12 | 1.3× | 35% | 1.0% |
> 说明:
>
> * Balanced:均衡型,适合多数时期;
> * Trend:顺势拉伸,持仓更久、盈亏比更高;
> * Scalper:快进快出、高胜率、不过度叠仓。
---
## 使用建议
1. **品种/周期**:`CME_MINI:NQ1!`(或当季主力合约),**30m**。
2. **手续费**:本策略默认 **1 USD/合约**(在“策略属性”可按实盘成本调整)。
3. **成交精度**:建议在“策略属性 → 高级设置”勾选 **Bar Magnifier**,提升限价/拖尾成交模拟精度。
4. **仓位**:策略默认 90% 仅为展示;回测与实盘更建议 **30%\~40% 权益**。
5. **风险**:金字塔仅做轻量、有限层数;若市场极端震荡,适当降低单笔上限与当日亏损阈值。
---
## 输入项(TradingView 右侧面板)
* **参数预设**:`Balanced / Trend / Scalper`
* **仅在 30m 周期生效**:开/关
* **出场模式**:`Auto(by preset) / Fixed TP/SL / Trailing / Trailing + TP`
> 其余细节参数由预设自动注入,无需手动繁杂调整,**开箱即用**。
---
## 注意事项
* 本脚本为研究与教育用途,不构成投资建议。期货与杠杆交易风险高,请在可承受范围内使用。
* 预设适配历史统计特征,未来表现不保证;建议结合自身风控与账户规模,先小仓/纸面验证。
* 仅做多版本;若需要双向(多空)或加入 RTH(美股盘中)/HTF(更高周期确认)等扩展,请在评论区留言。
---
**作者注**:
* 本策略在 Pine v6 编写,避免了常见的 v6 语法踩坑(如 `strategy.risk.max_position_size()` 仅 1 参、`plot` 标题需常量、追踪需成对参数 `trail_price + trail_offset` 等)。
* 欢迎在评论区反馈你的回测截图(区间、手续费、订单量),我会根据数据给出更贴合你的参数档。
# CoinGpt NQ Strategy (MACD · Multi-Factor · Optional Pyramiding)
## Overview
**CoinGpt NQ Strategy** is a ready-to-trade system for **Nasdaq-100 futures (NQ; recommended: `CME_MINI:NQ1!`) on the 30-minute timeframe**.
It uses **MACD momentum** as the backbone, adds an **EMA trend filter**, optional **pyramiding**, and **three exit modes** (Fixed TP/SL, Trailing, Trailing+TP) with built-in risk caps. Three one-click presets—**Balanced / Trend / Scalper**—cover different regimes and risk appetites.
> Instruments: futures / continuous contract
> Direction: **Long-only** (this script version)
> Timeframe: **30m** (toggleable)
---
## Entry
* **Trigger:** `MACD` line crossing **above** `Signal`.
* **Trend filter (optional):** price above `EMA(p_emaLen)` and `MACD > 0 & Signal > 0`.
* **Timeframe guard:** by default, signals are valid on **30m** only.
## Exit
* **Fixed TP/SL:** percentage-based limit and stop.
* **Trailing:** ATR-based trailing offset (or percent).
* **Trailing + TP:** trailing stop **and** a take-profit cap.
* **Protective flip:** when `MACD` crosses **below** `Signal`, close the long.
> Choose exit mode in **Inputs → “Exit Mode”**:
> `Auto(by preset) / Fixed TP/SL / Trailing / Trailing + TP`.
---
## Pyramiding (optional)
* Adds only **against adverse pullbacks** from the last add price.
* Up to `p_maxAdds` layers; each layer triggers at `p_addStep%` pullback from the **previous add**.
* Goal: **improve average price** with **small steps & limited layers** to keep drawdowns controlled.
---
## Risk Management
* **Daily loss cap:** `strategy.risk.max_intraday_loss(p_maxDailyDD, % of equity)`.
* **Per-trade size cap:** `strategy.risk.max_position_size(p_posCapPct)`.
* **Order size (strategy properties):** default **90% of equity** (for display).
* Practical suggestion: Balanced ≈ **40%**, Trend ≈ **35%**, Scalper ≈ **30%** (set in Strategy Properties → Order size).
---
## Presets (one-click)
| Preset | MACD (fast/slow/signal) | Trend EMA | Pyramiding | Add Step | Fixed TP/SL (%) | Trailing (ATR) | Pos Cap | Daily DD |
| ---------------------- | ----------------------- | --------- | ---------- | -------- | ------------------------- | -------------- | ------- | -------- |
| **Balanced (default)** | 8 / 21 / 5 | 233 | 2 layers | 0.12% | TP **0.22** / SL **0.15** | **1.2×** | **50%** | **1.5%** |
| **Trend** | 10 / 24 / 7 | 200 | 3 layers | 0.10% | TP **0.25** / SL **0.18** | **1.6×** | **45%** | **1.2%** |
| **Scalper** | 6 / 19 / 4 | 100 | Off | — | TP **0.18** / SL **0.12** | **1.3×** | **35%** | **1.0%** |
> **Balanced:** all-weather, stable.
> **Trend:** holds longer and targets higher R multiples.
> **Scalper:** quick in/out, higher hit-rate, no stacking.
---
## Usage Tips
1. **Symbol/TF:** `CME_MINI:NQ1!`, **30m**.
2. **Fees:** default **\$1 per contract** (adjust to your broker in Strategy Properties).
3. **Execution realism:** enable **Bar Magnifier** (Strategy Properties → Advanced) for more accurate limit/trailing fills.
4. **Sizing:** the script defaults to 90% only to showcase behavior—use **30–40%** in realistic tests.
5. **Pyramiding:** keep layers small & capped. In choppy regimes, reduce `p_posCapPct` and `p_maxDailyDD`.
---
## Inputs (right-panel)
* **Param Preset:** `Balanced / Trend / Scalper`
* **30m-only:** on/off
* **Exit Mode:** `Auto(by preset) / Fixed TP/SL / Trailing / Trailing + TP`
> All other parameters are pre-wired by the chosen preset for **plug-and-play** operation.
---
## Notes & Disclaimer
* Educational use only—**not** financial advice. Futures and leverage carry substantial risk.
* Presets reflect historical characteristics; **future performance is not guaranteed**. Start small or paper trade first.
* This version is **long-only**; if you need a two-sided (long & short) variant or extras (RTH/HTF filters), leave a comment.
---
**Author Notes**
* Written in **Pine v6** with common pitfalls avoided (e.g., `strategy.risk.max_position_size()` takes **one** arg, `plot` titles are **const strings**, trailing requires `trail_price + trail_offset`).
* Share your backtest screenshots (period, fees, order size) and I can suggest **tighter, data-driven knobs** for your setup.

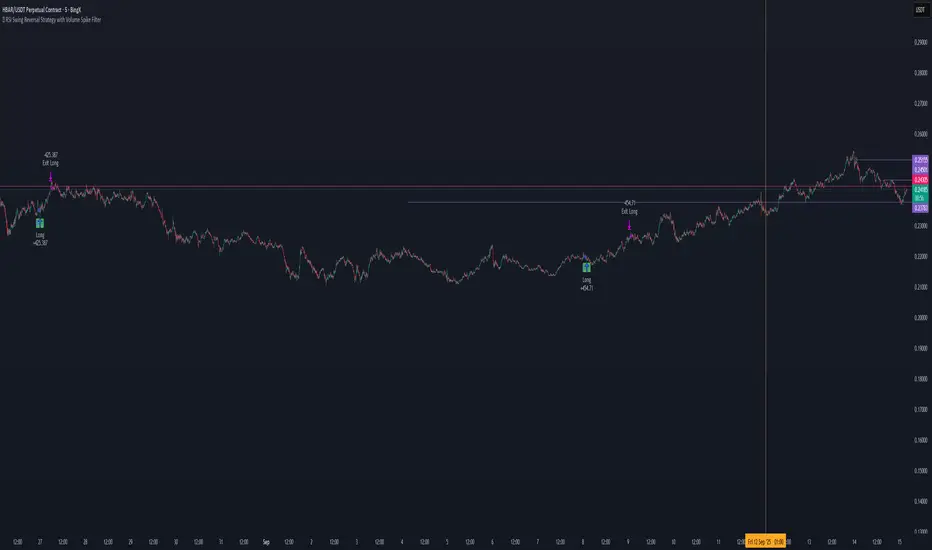
📊 RSI Swing Reversal Strategy with Volume Spike FilterHi , i did test that on Hbar time frame 5min. please let me know if i did miss something .85% win rate. please get back test.
What Will This Strategy Do?
Use RSI cross over/under its MA + Swing High/Low + optional Trend Filter.
Enter long on bullish signals.
Enter short on bearish signals.
Exit on opposite signals or optional take-profit/stop-loss.
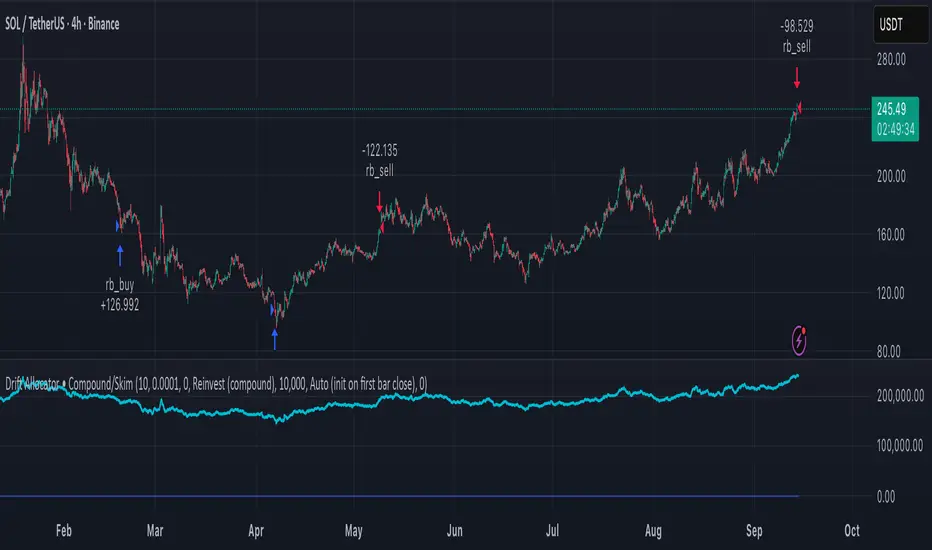
Delta Drift Allocator - StrategySummary
Bar-close, drift-based allocation alerts that keep exposure centered around a user-set base with full compounding by default. One alert per bar close. Non-repainting. Invite-Only.
Description
Delta Drift Allocator monitors how far current exposure drifts from a reference profile. When drift exceeds your threshold, it issues a single bar-close instruction (BUY/SELL with quantity) to nudge exposure back toward center. The emphasis is path discipline—rules that react to swings without predicting direction—plus a simple one-alert workflow.
A start-sync input lets you align the script with your actual initial fill so subsequent sizes match your account. Profit handling supports Reinvest (compound) or Skim to base (bookkeep excess).
How to use (overview)
Add to chart (recommended timeframe: 4h).
Set Inputs: drift threshold, min notional, start method (Auto or Manual sync at your bar-close time + filled units).
Create one alert: This strategy → Any alert() function call, Once per bar close. Leave Message empty.
Execute externally: place BUY/SELL for exactly the shown qty (manual or your own webhook executor outside TradingView).
Note: A detailled manual is provided after purchase.
Why traders choose it
Bar-close discipline (no intra-bar churn, non-repainting)
Drift-responsive adjustments that can harvest parts of oscillations
Full compounding by default; optional “skim to base” bookkeeping
Start-sync to match real fills; minimal panel plots you can hide
Access (Invite-Only)
To request access, send me a PM on TradingView. You’ll receive detailled information about the process.
Note: Requests for older strategies are no longer processed—please refer to this release only.
Compliance
Signals only; the script does not place orders or read balances. Backtests are approximations and are not indicative of future results. Markets involve risk, including possible loss. Extended one-way advances can lag all-in exposure; starting right after strong rallies may show initial drawdowns.
Killzones SMT + IFVG detectorKillzones SMT + IFVG Detector
Summary
This strategy implements a specific intraday workflow inspired by ICT-style concepts.
It combines:
Killzone session levels (recording untouched highs/lows)
SMT divergence between NQ and ES (exclusive sweep logic)
IFVG confirmation (3-bar imbalance + width filter + inversion guard)
and an optional smart exit engine
The components are not simply mashed together: they interact in sequence.
A setup only confirms if all conditions line up (time window → untouched level sweep → divergence → valid IFVG → confirmation candle → risk filter).
Workflow
Killzones & session levels
Tracks highs/lows inside default killzones (19:00–23:00, 01:00–04:00, 08:30–10:00, 11:00–12:00, 12:30–15:00, chart timezone).
Stores untouched levels forward; sweeps trigger candidate signals.
SMT divergence (exclusive sweep)
Bullish SMT : one index sweeps its low while the other remains above its session low.
Bearish SMT : one index sweeps its high while the other remains below its session high.
Detection supports “Sweep (Cross)” or “Exact Tick.”
Session IDs are tracked so once a side has fired, later re-touches can’t re-trigger .
IFVG confirmation
Locks the first valid 3-bar IFVG after SMT.
Confirmation requires a candle close beyond the IFVG boundary in the direction of the close.
IFVGs must meet a minimum width filter (default 1.0 point).
Inversion guard: ignores IFVGs already inverted before SMT.
Optional “re-lock” keeps tracking the latest IFVG until confirmation/expiry.
Smart exit engine
Initial stop from opposite wick (+ buffer).
Fixed TP (default 40 points).
Dynamic stop escalation at progress thresholds (BE → 50% → 80% of target).
Safety gates
Weekend lockout (Fri 16:40 → Sun 18:00).
Same-bar sweep of high & low cancels setups.
Max initial stop filter skips oversized setups.
Optional cooldown bars.
Alerts
SMT Bullish/Bearish : divergence detected this bar.
Confirm Long/Short : IFVG confirmation triggered.
Default Strategy Properties (used in screenshots/backtests)
Initial capital: $25,000
Order size: 1 contract
Commission: $1.25 per contract per side
Slippage: 2 ticks
Backtest window: Jun 16, 2025 – Sep 14, 2025
These settings are intentionally conservative. If you change them, your results will differ.
How to use
Apply on an NQ or ES futures chart (1–5 min).
Choose your killzones and detection mode.
Select confirmation symbol (NQ, ES, or “Sweeper”).
Enable/disable IFVG re-lock.
Review signals and use alerts for automation if desired.
Limitations
Strict filters reduce trade count; extend backtest window for more samples.
Works best on NQ/ES; not validated elsewhere.
Past performance is not indicative of future results.
This is an educational tool ; not financial advice.

Small-Cap — Sell Every Spike (Rendon1) Small-Cap — Sell Every Spike v6 — Strict, No Look-Ahead
Educational use only. This is not financial advice or a signal service.
This strategy targets low/ mid-float runners (≤ ~20M) that make parabolic spikes. It shorts qualified spikes and scales out into flushes. Logic is deliberately simple and transparent to avoid curve-fit.
What the strategy does
Detects a parabolic up move using:
Fast ROC over N bars
Big range vs ATR
Volume spike vs SMA
Fresh higher high (no stale spikes)
Enters short at bar close when conditions are met (no same-bar fills).
Manages exits with ATR targets and optional % covers.
Tracks float rotation intraday (manual float input) and blocks trades above a hard limit.
Draws daily spike-high resistance from confirmed daily bars (no repaint / no look-ahead).
Timeframes & market
Designed for 1–5 minute charts.
Intended for US small-caps; turn Premarket on.
Works intraday; avoid illiquid tickers or names with constant halts.
Entry, Exit, Risk (short side)
Entry: parabolic spike (ROC + Range≥ATR×K + Vol≥SMA×K, new HH).
Optional confirmations (OFF by default to “sell every spike”): upper-wick and VWAP cross-down.
Stop: ATR stop above entry (default 1.2× ATR).
Targets: TP1 = 1.0× ATR, TP2 = 2.0× ATR + optional 10/20/30% covers.
Safety: skip trades if RVOL is low or Float Rotation exceeds your limit (default warn 5×, hard 7×).
Inputs (Balanced defaults)
Price band: $2–$10
Float Shares: set per ticker (from Finviz).
RVOL(50) ≥ 1.5×
ROC(5) ≥ 1.0%, Range ≥ 1.6× ATR, Vol ≥ 1.8× SMA
Cooldown: 10 bars; Max trades/day: 6
Optional: Require wick (≥35%) and/or Require VWAP cross-down.
Presets suggestion:
• Balanced (defaults above)
• Safer: wick+VWAP ON, Range≥1.8×, trades/day 3–4
• Micro-float (<5M): ROC 1.4–1.8%, Range≥1.9–2.2×, Vol≥2.2×, RVOL≥2.0, wick 40–50%
No look-ahead / repaint notes
Daily spike-highs use request.security(..., lookahead_off) and shifted → only closed daily bars.
Orders arm next bar after entry; entries execute at bar close.
VWAP/ATR/ROC/Vol/RVOL are computed on the chart timeframe (no HTF peeking).
How to use
Build a watchlist: Float <20M, RelVol >2, Today +20% (Finviz).
Open 1–5m chart, enter Float Shares for the ticker.
Start with Balanced, flip to Safer on halty/SSR names or repeated VWAP reclaims.
Scale out into flushes; respect the stop and rotation guard.
Limitations & risk
Backtests on small-caps can be optimistic due to slippage, spreads, halts, SSR, and limited premarket data. Always use conservative sizing. Low-float stocks can squeeze violently.
Alerts
Parabolic UP (candidate short)
SHORT Armed (conditions met; entry at bar close)

Astro Trading Strategy by LansTitle:
Astro Trading Strategy + Planetary Dashboard + Future Forecast
Description:
This strategy combines astrology-inspired market timing with automated trade entries. It uses planetary cycles, moon phases, and zodiac transitions to generate Buy and Caution signals, helping traders align with key cosmic events.
🪐 Key Features
Planetary Dashboard – Displays current Zodiac sign, Moon phase, and planetary conditions in real-time.
Moon-Phase Trading – Generates Buy signals on New Moons and Caution signals on Full Moons (configurable).
Mercury Retrograde Filter – Optionally avoids trading during Mercury Retrograde periods.
Planetary Aspect Filter – Trades only when favorable Venus conjunctions align and Saturn squares are avoided.
Future Forecasting – Calculates and displays the next upcoming Buy and Caution days directly on the chart.
Fully Configurable – Enable/disable dashboard, aspect filters, and moon-phase logic to fit your trading style.
🎯 How It Works
Buy Signals appear during supportive cosmic alignments (e.g., Venus conjunct Sun + New Moon).
Caution Signals appear near Full Moons, Saturn squares, or Mercury retrogrades.
Automated Entries – When enabled, strategy takes trades based on signal conditions for backtesting.
⚠ Disclaimer
This is an experimental astro-financial strategy intended for educational purposes. Past planetary patterns do not guarantee future performance. Always combine with sound risk management and technical confirmation before trading live markets.
---
#astrotrading #planetarycycles #moonphases #strategy #astrology #swingtrading #backtest

Hilly 3.0 Advanced Crypto Scalping Strategy - 1 & 5 Min ChartsHow to Use
Copy the Code: Copy the script above.
Paste in TradingView: Open TradingView, go to the Pine Editor (bottom of the chart), paste the code, and click “Add to Chart.”
Check for Errors: Verify no errors appear in the Pine Editor console. The script uses Pine Script v5 (@version=5).
Select Timeframe:
1-Minute Chart: Use defaults (emaFastLen=7, emaSlowLen=14, rsiLen=10, rsiOverbought=80, rsiOversold=20, slPerc=0.5, tpPerc=1.0, useCandlePatterns=false, patternLookback=10).
5-Minute Chart: Adjust to emaFastLen=9, emaSlowLen=21, rsiLen=14, rsiOverbought=75, rsiOversold=25, slPerc=0.8, tpPerc=1.5, useCandlePatterns=true, patternLookback=10.
Apply to Chart: Use a liquid crypto pair (e.g., BTC/USDT, ETH/USDT on Binance or Coinbase).
Verify Signals:
Green “BUY” or “EMA BUY” labels and triangle-up arrows below candles for bullish signals (EMA crossovers, bullish engulfing, hammer, doji, morning star, three white soldiers, double bottom).
Red “SELL” or “EMA SELL” labels and triangle-down arrows above candles for bearish signals (EMA crossovers, bearish engulfing, shooting star, doji, evening star, three black crows, double top).
Green/red background highlights for signal candles.
Backtest: Use TradingView’s Strategy Tester to evaluate performance over 1–3 months, checking Net Profit, Win Rate, and Drawdown.
Demo Test: Run on a demo account to confirm signal visibility and performance before trading with real funds.

Continuous Accumulation Strategy [DCA] v9🇬🇧 English: Continuous Accumulation Strategy v9.4
This script is a full-featured strategy designed to backtest the "Buy the Dip" or "Dollar Cost Averaging" (DCA) philosophy. Its core feature is the Dynamic Peak Detection logic, which solves the "lock-in" problem of previous versions. Instead of getting stuck on an old high, the strategy constantly adapts to the market by referencing the most recent peak.
Key Features
* Dynamic Peak Detection: You define the "Peak Lookback Period." For example, on a Daily chart, setting it to `5` references the peak of the last business week.
* Stable Order Management: The strategy consistently uses a fixed cash amount (e.g., $100) for each entry, which prevents any runtime errors related to negative equity.
* Publishing-Ready: To meet TradingView's requirement for a backtest report, this strategy executes a symbolic, one-time "dummy trade" (one buy and one sell) at the very beginning of the test period. This first trade should be ignored when analyzing performance , as its only purpose is to enable publication.
How It Works
The main logic follows an adaptive cycle: Find Dynamic Peak -> Wait for a Drop -> Buy on Crossover -> Repeat.
1. Finds the Dynamic Peak: On every bar, it identifies the highest price within your defined lookback period.
2. Calculates the Drop: It constantly calculates the percentage drop from this moving peak.
3. Executes an Entry: The moment the price crosses below a target drop percentage, it executes a buy order.
4. Continuously Adapts: As the price moves, the dynamic peak is constantly updated, meaning the strategy never gets locked and is always ready for the next opportunity.
How to Use This Strategy
* Focus on the Strategy Tester: After adding it to the chart, analyze the Equity Curve, Net Profit, and Max Drawdown to see how this accumulation philosophy would have performed on your favorite asset.
* Optimize Parameters: Adjust the "Peak Lookback Period" and "Drop Percentages" to fit the volatility of the asset you are testing.
This is a tool for testing and analyzing a "buy and accumulate" philosophy. Its main logic does not generate sell signals.

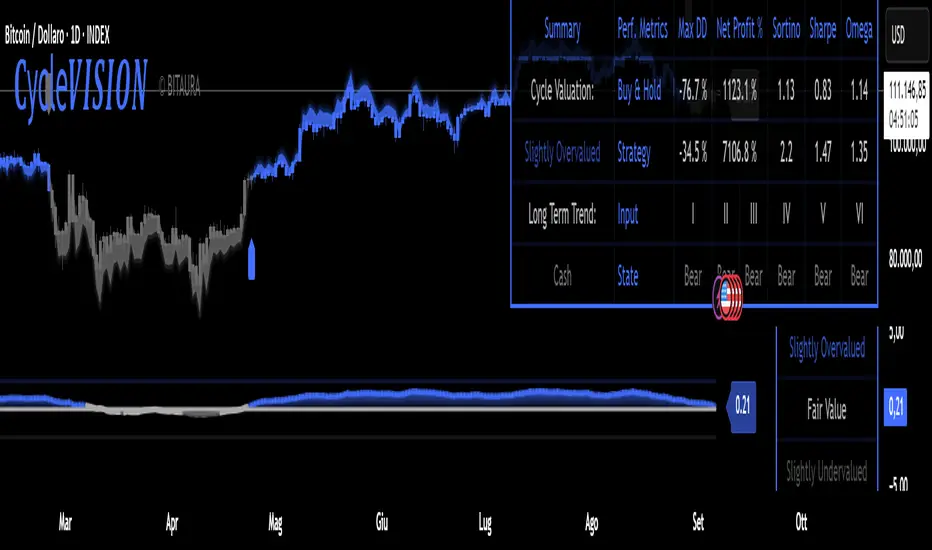
CycleVISION [BitAura]𝐂ycle𝑽𝑰𝑺𝑰𝑶𝑵
This Pine Script® indicator combines a long-term trend-following strategy with a cycle valuation Z-score analysis to generate a Trend Probability Indicator (TPI). The TPI aggregates signals from multiple trend and on-chain metrics to identify optimal entry and exit points for a single asset, with USD as a cash position. The system also calculates a comprehensive Z-score based on performance and valuation metrics to assess market cycles, aiming to enhance risk-adjusted returns for long-term investors.
Logic and Core Concepts
The 𝐂ycle𝑽𝑰𝑺𝑰𝑶𝑵 System uses two primary components to guide investing decisions:
1. Trend Probability Indicator (TPI)
Mechanism : Aggregates five proprietary, universal, trend signals and three on-chain metrics into a composite TPI score, normalized between -1 and 1.
Thresholds : Enters a long position when the TPI score exceeds a user-defined long threshold (default: 0.0) and exits to cash when it falls below a short threshold (default: -0.5).
Execution : Trades are executed only on confirmed bars within a user-specified backtest date range, ensuring robust signal reliability.
2. Cycle Valuation Z-Score
Mechanism : Computes an average Z-score from six metrics: Sharpe Ratio, Sortino Ratio, Omega Ratio, Weekly RSI, Crosby Ratio, and Price Z-Score, using a 1200-bar lookback period.
Purpose : Identifies overvalued or undervalued market conditions to complement TPI signals, with thresholds at ±1.8 for extreme valuations.
Visualization : Displays the average Z-score and individual components, with gradient-based bar coloring to reflect valuation strength.
Features
Dynamic Trend Signals : Combines trend and on-chain data into a single TPI score for clear long/cash decisions.
Comprehensive Valuation : Calculates Z-scores for multiple performance and price metrics to assess market cycles.
Customizable Inputs : Allows users to adjust TPI thresholds, backtest date ranges, and valuation metrics visibility.
Visual Outputs :
Valuation Table : Displays TPI score, Z-scores, and performance metrics (Sharpe, Sortino, Omega, Max Drawdown, Net Profit) in a configurable table (Lite, Medium, Full).
Equity Curve : Plots the system’s equity curve compared to buy-and-hold performance.
Price and TPI Plot : Overlays TPI-adjusted price bands with glow effects and filled gaps for trend visualization on the price chart.
Valuation Coloring : Applies backgrounds based on Z-score ranges (e.g., strong buy above 1.8, strong sell below -1.8).
Configurable Alerts : Notifies users of TPI signal changes (Long to Cash or Cash to Long) with detailed messages.
Color Presets : Offers five color themes (e.g., Arctic Blast, Fire vs. Ice) or custom color options for long/short signals.
Pine Script v6 : Leverages matrices, tables, and gradient coloring for enhanced usability.
How to Use
Add to Chart : Apply the indicator to any chart (the chart’s ticker is used for calculations, e.g., INDEX:BTCUSD ).
Configure Settings : Adjust TPI thresholds, backtest start date (default: 01 Feb 2018), and valuation metrics visibility in the Inputs menu.
Select Color Theme : Choose a preset color mode (e.g., Arctic Blast) or enable custom colors in the Colors group.
Monitor Outputs : Check the Valuation Table for TPI and Z-score data, and view the Price and TPI Plot for trend signals.
Analyze Performance : Enable the equity curve and performance metrics in the Backtesting Options group to compare results.
Set Alerts : Right-click a plot, select "Add alert," and choose "Trend Change: Long to Cash" or "Trend Change: Cash to Long" for notifications.
The system is optimized for daily timeframe and tested across various assets to ensure robustness.
Notes
The script is closed-source.
Use a standard price series (not Heikin Ashi or other non-standard types) for accurate results.
The script avoids lookahead bias by using barmerge.lookahead_off in request.security() calls.
A minimum 1200-bar lookback is mandatory for Z-score calculations to avoid errors, with warnings displayed if insufficient price history is available.
The BitAura watermark can be toggled in the Table Settings group.
Disclaimer : This script is for educational and analytical purposes only and does not constitute financial advice. Trading involves significant risk, and past performance is not indicative of future results. Always conduct your own research and apply proper risk management.
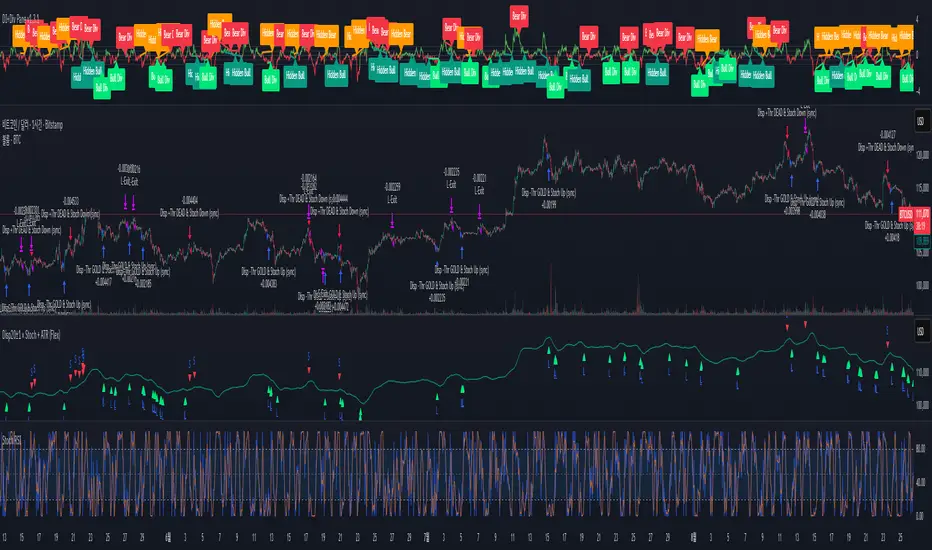
Disparity(20MA) ±1 × Stochastic 80/20 + ATR SL/TP[by Irum]Disparity(20MA) ±1 × Stochastic 80/20 + ATR SL/TP
사용 설명서 (KR/EN Bilingual Manual)
1) 목적 & 정의 / Purpose & Definition
KR — 목적 & 정의
이 스크립트는 이격도(Disparity) 와 스토캐스틱(80/20) 의 동시 신호를 활용해 추세 전환/지속 구간의 고확률 진입 시점을 포착하고, ATR 기반 손절/익절(고정 또는 트레일링)로 리스크를 정량화하여 운용 효율을 높이기 위해 설계되었습니다.
핵심 아이디어:
가격이 20MA 대비 ±임계값을 크로스(과열/침체 해소 신호)하고,
스토캐스틱이 80/20을 돌파/이탈(모멘텀 전환 신호)할 때,
두 신호가 동일봉 또는 N봉 내 동기화되면 진입.
청산: ATR×배수를 이용한 고정 TP/SL 또는 ATR 트레일링.
EN — Purpose & Definition
This strategy combines Disparity (price vs. 20MA) and Stochastic (80/20) to identify high-probability entries when momentum confirms mean-reversion/continuation, while ATR-based stops/take-profits (fixed or trailing) provide quantified risk control.
Core Idea:
Disparity crosses ±threshold (overbought/oversold release),
Stochastic crosses 80/20 (momentum shift),
Both conditions sync on the same bar or within N bars → entry.
Exits: Fixed ATR TP/SL or ATR trailing.
2) 신호 로직 요약 / Signal Logic Overview
KR
롱 진입: Disparity가 −임계값 상향 돌파 & Stochastic 20 상향 돌파가 syncBars 이내에 동시 충족.
숏 진입: Disparity가 +임계값 하향 돌파 & Stochastic 80 하향 돌파가 syncBars 이내에 동시 충족.
완화 옵션(useRelaxStoch): 최근 relaxLookback 내 20/80 터치 이력 + 현재 방향성만으로도 모멘텀 전환을 인정(교차 미충족 보완).
EN
Long: Disparity crosses up −threshold & Stochastic crosses up 20 within syncBars.
Short: Disparity crosses down +threshold & Stochastic crosses down 80 within syncBars.
Relaxed option (useRelaxStoch): Accepts momentum shift if 20/80 was touched in the last relaxLookback bars and the current slope confirms, even without a strict cross.
3) 설정 메뉴 안내 / Settings Menu Guide
A. 기본 / Core
기준가격 / Source (source)
설명: Disparity 계산에 쓰는 가격 소스.
입력: close, hl2, ohlc4 등.
기본값: close.
팁: 변동성 큰 종목은 hlc3/ohlc4가 노이즈를 줄이기도 함.
이격도 기준 MA 길이 / MA Length (for Disparity) (int ≥1)
설명: Disparity의 기준선이 되는 단순이동평균 길이.
기본값: 20.
영향: 길이↑ → 신호 빈도↓, 안정성↑.
이격도 임계값(±%) / Disparity Threshold (±%) (float ≥0.1, step 0.1)
설명: Disparity가 +임계값 아래로 하향 크로스(숏) 또는 −임계값 위로 상향 크로스(롱)할 때 신호.
기본값: 1.0%.
팁: 너무 크면 신호 드뭄, 너무 작으면 과다.
B. 스토캐스틱 / Stochastic
%K Length / K 길이 (int ≥1, 기본 14)
%K Smoothing / K 스무딩 (int ≥1, 기본 1)
%D Length / D 길이 (int ≥1, 기본 3)
설명: ta.stoch의 K를 스무딩한 kSlow와, 추가 스무딩한 dSlow(참조용)를 구성.
Buy Level (↑20) / 매수 기준선 (0~100, 기본 20)
Sell Level (↓80) / 매도 기준선 (0~100, 기본 80)
C. 신호 로직 / Signal Logic
Signal Sync Window (bars) / 신호 동기화 윈도우 (0~10, 기본 0)
설명: 0=두 신호가 같은 봉에서 모두 충족해야 함. N>0=최근 N봉 내에서 각각 한 번 발생하면 인정.
팁: 1~3은 현실적 체결/지연을 반영하며 과최적화 방지에 도움.
Relaxed Stochastic? (교차 완화) (bool, 기본 false)
설명: 교차 대신 최근 20/80 터치 + 현재 기울기만으로도 모멘텀 전환을 인정. 신호 빈도↑.
Relax lookback bars (int ≥1, 기본 5)
설명: 완화판정에 쓰는 최근 봉 수.
D. 리스크 / Risk (ATR)
ATR Length / ATR 길이 (int ≥1, 기본 14)
ATR Mult for Stop / 손절 ATR 배수 (float ≥0.1, 기본 1.5)
ATR Mult for Take-Profit / 익절 ATR 배수 (float ≥0.1, 기본 2.0)
설명: 진입가 ± ATR×배수로 SL/TP 설정.
팁: 변동성 큰 자산은 SL 배수↑, TP 배수도 함께 조정 권장.
Use ATR Trailing Stop? / ATR 트레일링 사용 (bool, 기본 false)
ATR Mult for Trailing / 트레일링 ATR 배수 (float ≥0.1, 기본 2.0)
설명: 고정 TP/SL 대신 추적 손절을 사용(수익 추적에 유리).
E. 시각화 / Visualization
Plot 20MA / 20MA 표시 (bool, 기본 true)
Show Entry Markers / 진입 마커 표시 (bool, 기본 true)
4) 진입·청산 규칙 / Entry & Exit Rules
KR
진입: 위 “신호 로직” 충족 시 strategy.entry("L"/"S").
청산 (고정형):
롱: Stop = 진입 − ATR×SL, TP = 진입 + ATR×TP
숏: Stop = 진입 + ATR×SL, TP = 진입 − ATR×TP
청산 (트레일링형):
ATR×trailMult로 산출한 trail_points/offset으로 추적 손절.
EN
Entry: Place strategy.entry("L"/"S") when sync conditions are met.
Exit (Fixed):
Long: Stop = Entry − ATR×SL, TP = Entry + ATR×TP
Short: Stop = Entry + ATR×SL, TP = Entry − ATR×TP
Exit (Trailing):
Use ATR×trailMult as trailing distance & offset.
5) 알림 / Alerts
조건
Long Entry (Disp −Thr & Stoch Up, sync) → longSignal
Short Entry (Disp +Thr & Stoch Down, sync) → shortSignal
메시지 포맷 / Message format
{"signal":"long|short","symbol":"{{ticker}}","price":{{close}}}
Webhook(예: 거래소·봇)에서 signal/symbol/price를 활용해 체결 로직과 연동하십시오.
6) 빠른 시작 & 권장 프리셋 / Quick Start & Suggested Presets
KR — BTC/USDT (15분봉) 제안
maLen=20, thrPct=1.0~1.5, kLen=14, kS=1, dLen=3, stBuyLv=20, stSellLv=80
syncBars=1~3 (동시성 여유), useRelaxStoch=true, relaxLookback=5
고정형: atrLen=14, atrMultSL=1.5~2.0, atrMultTP=2.0~3.0
트레일링형: useTrail=true, trailMult=2.0~3.0
EN — BTC/USDT (15-min) suggestion
Above defaults, with syncBars=1~3, useRelaxStoch=true to improve fill realism.
Increase atrMultSL on high-volatility days to reduce whipsaws.
7) 운용 팁 & 점검 / Tips & Troubleshooting
KR
신호가 안 나와요: thrPct가 지나치게 크거나 syncBars=0으로 너무 엄격할 수 있음. thrPct↓, syncBars↑ 조정.
휩쏘 과다: useRelaxStoch를 끄거나 thrPct↑, atrMultSL↑.
TP 도달 전에 청산: 트레일링 사용 시 변동성 확대로 SL이 따라붙다 체결될 수 있음 → trailMult↑ 또는 고정형 전환.
과최적화 방지: 한 구간에 과특화된 튜닝(특히 syncBars, thrPct)은 다른 시장에서 성능 저하. Walk-forward 권장.
EN
No signals: Lower thrPct and/or increase syncBars.
Too many whipsaws: Disable relaxed mode, raise thrPct and/or atrMultSL.
Stopped before TP (trailing): Increase trailMult or switch to fixed exits.
Robustness: Avoid over-tuning; validate via walk-forward testing.
Consolidated 9-Indicator Buy/Sell Zones & TriggersALL important inductors combined for long term position holders and short term guys...use it to enter trade and exit ...backgroud colour will give you the indication of the market mood..

swapstrategy-Reversal StrategyGenerate buy and sell signals and reverses position when chart turn buy or sell side

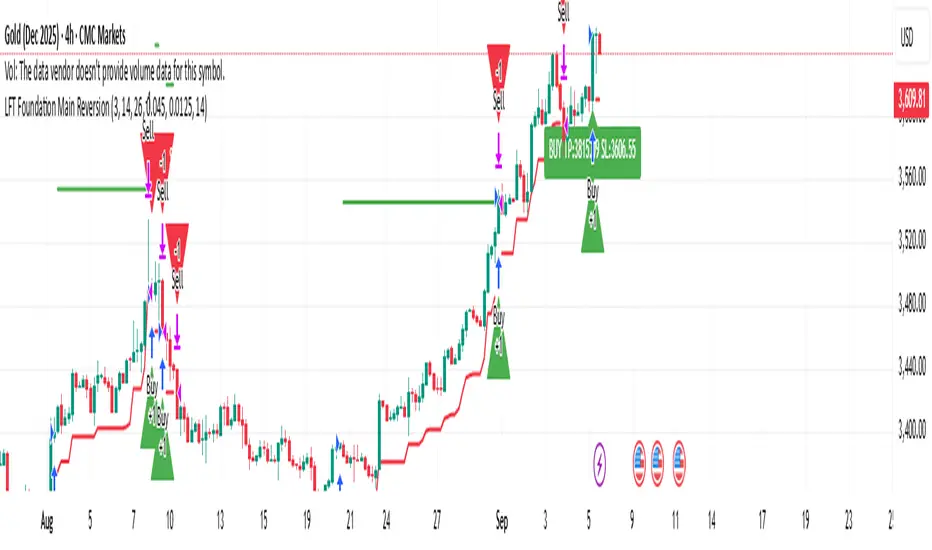
LFT strategy Main Reversion
this script will tell exactly when to buy and sell with TP and SL, used the latest LLM to tone the model with a profit ratio of 2.05 in 6 years and profit ratio of 4.02 in past 6 month and have been back tested with Monte Carlo simulation, with profit ratio 1+ for 99% of the time with 1000 iterations with 500 steps, for 100 times
please contact LFT Foundation for access

LFT Foundation Main ReversionLFT Foundation Main Reversion
this script will tell exactly when to buy and sell with TP and SL, used the latest LLM to tone the model with a profit ratio of 1.82 in 6 years and profit ratio of 4.02 in past 6 month and have been back tested with Monte Carlo simulation, with profit ratio 1+ for 99% of the time with 1000 iterations with 500 steps, for 100 times
please contact LFT Foundation for access
ENAUSDT.P Strategy – Alerts Ready (JSON)Ena/usdt trend trading strategy.
Backtesting results:
Starting date: 2 September 2025
7 days:
PnL: +13.91 (+1.39%)
Max drawdown: -17.68 (-1.73%)
Total trades: 22
Win rate: 63.64%
Profit factor: 1.82
30 days:
PnL: +81.16 (+8.12%)
Max drawdown: -26.38 (-2.51%)
Total trades: 89
Win rate: 68.54%
Profit factor: 2.52
90 days:
PnL: +270.64 (+27.06%)
Max drawdown: -36.29 (-3.34%)
Total trades: 273
Win rate: 67.09%
Profit factor: 2.72
365 day:
PnL: +702.89 (+70.29%)
Max drawdown: -130.40 (-10.16%)
Total trades: 986
Win rate: 65.42%
Profit factor: 1.67

MTF FVG Confluence v6 — JSON Alerts via alert()This strategy combines multi-timeframe confluence with candlestick analysis and fair value gaps (FVGs) to generate structured long/short entries. It aligns Daily and 4H EMA trends with 1H MACD momentum, then confirms with engulfing candles and FVG zones for precision entries. Risk management is built-in, featuring stop-loss, 3R take-profit targets, and optional break-even logic, with dynamic JSON alerts for webhook automation.
Categories:
Candlestick analysis
Chart patterns
Cycles

dabilThe strategy is probably to go short or long with the trend depending on the case, but if all time units 1 minute then 3 minutes then 5 minutes then 15 minutes then 1 hour all show the same direction, but first the 1 hour must be bullish in which the 1 hour candle closes above the previous one, for example if the trend is bearish then the market wants to change direction, then a 1 hour bullish close must then be followed by a 1 hour bearish close below the bullish candle, then another bullish candle must shoot above the previous bullish candle, then 15 minutes also shoot above the previous 15 bullish candles, then 1 and 2...3.5. Then I can rise with the market by only covering the last 15 bullish candles with my stop loss, if my SL is 50 pips then I want 100 pips and then I'm out.

Rev Smart Pivot V5.0 by SJKimRev Smart Pivot V5.0 by SJKim
Rev Smart Pivot V5.0 by SJKim
Rev Smart Pivot V5.0 by SJKim
