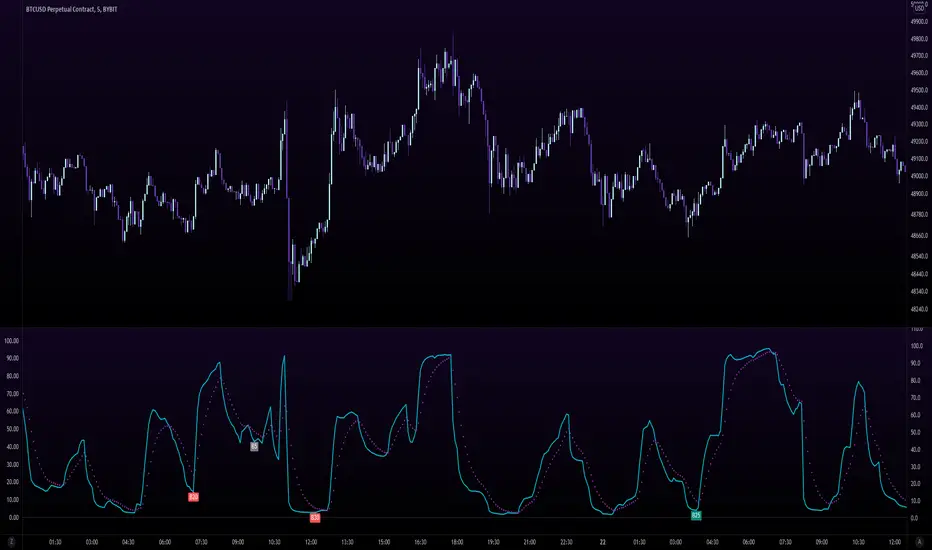
MTF DPO-RSI IndicatorThis indicator uses the principle of taking the RSI of DPO readings across multiple time frames in order to provide trade signals and an overarching view of market conditions to the trader. My hope with creating this indicator was to present more divergence based signals than your typical indicator, while still keeping those signals at a high quality.
In the settings menu, you may specify:
Indicator Timeframe - the chart resolution that is used to calculate values.
Source DPO Length - the number of bars used to calculate the Detrended Price Oscillator value. The DPO value is the source for the RSI calculations.
DPO Hull Smoothing - how much smoothing is applied to the DPO . Smoothing is accomplished by taking a Hull Moving Average of the closing price, and using this to calculate the DPO value.
RSI Length - the number of bars used to calculate the RSI of the DPO value.
Time Multipliers 1 through 6 - use this to define what resolution each plot will represent. A value of 1 will represent the current Indicator Timeframe. A value of 3 will represent 3 times the current Indicator Timeframe, etc.
Show Plot 1 through 6 - toggles the display of plots.
How I trade with this indicator:
A value of under 30 represents an over sold state for that particular plot. A value of over 70 represents an overbought state for that plot.
Identify divergences on a lower timeframe plot which are apparent in overbought or oversold conditions, and confirm the signal with an overbought or oversold condition, or a divergence on a higher timeframe plot. Divergences which begin in oversold or overbought territory and end inside the 30-70 range tend to be more reliable signals, in my experience. Like all indicators, this is best when used in conjunction with other indicators. Trend indicators, such as double EMA's and Supertrend are my favorite pairing, and a stochastic RSI is a good tool to have as well.
This is my first published indicator! If you find unique ways to use it, drop me a message. I'd love to know what you find. :)
背离

Ultimate Bullish Divergence for RSI OBV RVSI MFI w/ Buy AlertsThis Indicator detects Divergence based on multiple Pivot points instead of just one.
- You can detect divergence on these Oscillators:
- RSI, RVSI, MFI, TRIX RSI, OBV and more soon
You can detect bullish and hidden bullish divergence:
- bullish divergence: Oscillator makes a higher low while price is making a lower low
- hidden bullish divergence: Oscillator makes a lower low while price is making a higher low
ranges where it should look for Divergence:
- To reduce false positives you are able to define and combine the following ranges:
- Manual Ranges: you’re able to type in the ranges that you came up with your manual technical analysis
- Auto Fib Ranges: option to only look for divergence below/above/within multiple Fibonacci levels
- Oversold limit: option to only look for divergence below a certain Oscillator Level
- EMA Ranges: Only look for divergence if below/above/within certain EMA's
- VWAP Ranges: option to only look for divergence below/above/within VWAP levels
Multiple options of waiting for confirmation:
- Waiting for X candle closes
- Wait for a price bounce
- Wait for an Oscillator to Oscillator EMA cross
- Wait for EMA cross (coming soon)
Divergence-Support/ResistenceAnother script based on zigzag, divergence, and to yield support and resistence levels.
This idea started with below two concepts:
▶ Support and resistence are simply levels where price has rejected to go further down or up. Usually, we can derive this based on pivots. But, if we start looking at every pivot, there will be many of them and may be confusing to understand which one to consider.
▶ Lot of people asked about one of my previous script on divergence detector on how to use it. I believe divergence should be considered as area of support and resistence because, they only amount to temporary weakness in momentum and nothing more. As per my understanding
Trend > Hidden Divergence > Divergence > Oscillator Levels of Overbought and Oversold
⬜ Process
▶ Now combining the above two concepts - what we are trying to do here is draw support resistence lines only on pivots which has observed either divergence or hidden divergence. Continuation and indecision pivots are ignored.
▶ Input requires only few parameters.
Zigzag lengths and oscillator to be used. Oscillator periods are automatically calculated based on zigzag length. Hence no other information required. You can also chose custom oscillator via external source.
▶ Display include horizontal lines of support/resistence which are drawn from the candle from where divergence or hidden divergence is detected.
▶ Support resistence lines are colored based on divergence. Green shades for bullish divergence and bullish hidden divergence whereas red shades for bearish divervence and bearish hidden divergence. Please note, red and green lines does not mean they only provide resistence or support. Any lines which are below the price should be treated as support and any line which are above the price should be treated as resistence.
▶ Divergence symbols are also printed on the bar from where divergence/hidden divergence is detected.
↗ - Bullish Hidden Divergence
↘ - Bearish Hidden Divergence
⤴ - Bullish Divergence
⤵ - Bearish Divergence
▶ Script also demonstrates usage of libraries effectively. I have used following libraries in this code.
import HeWhoMustNotBeNamed/ zigzag /2 as zg
import HeWhoMustNotBeNamed/enhanced_ta/8 as eta
import HeWhoMustNotBeNamed/ supertrend /4 as st
Can be good combination to use it with harmonic patterns.

Volume Price Trend with Divergence and Pivot Points The volume price trend indicator is used to determine the balance between a security’s demand and supply. The percentage change in the share price trend shows the relative supply or demand of a particular security, while volume indicates the force behind the trend. The VPT indicator is similar to the on-balance volume (OBV) indicator in that it measures cumulative volume and provides traders with information about a security’s money flow.
This is Volume Price Trend or VPT recalculated to be an Oscillator, a Divergence hunter was added, also Pivot Points and Alerts.
VPT is considered a "leading indicator" - in contrast to a "lagging indicator" just as Moving Averages it does not show a confirmation what already happened, but it shows what can happen in the future. For example: The chart is climbing while the VPT oscillator is slowly declining, gets weaker and weaker, maybe even prints bearish divergences? That means that a reversal might be occurring soon. Leading indicators are best paired with Stop and Resistance Lines, general Trendlines , Fib Retracements etc...Your chart is approaching a very important Resistance Trendline but the VPT shows a very positive signal? That means there is a high probability that the Resistance is going to be pushed though and becomes Support in the future.
What are those circles?
-These are Divergences. Red for Regular-Bearish. Orange for Hidden-Bearish. Green for Regular-Bullish. Aqua for Hidden-Bullish.
What are those triangles?
- These are Pivots . They show when the VPT oscillator might reverse, this is important to know because many times the price action follows this move.
Please keep in mind that this indicator is a tool and not a strategy, do not blindly trade signals, do your own research first! Use this indicator in conjunction with other indicators to get multiple confirmations.

Multi Indicator DivergenceSpotting Divergences using multiple indicators.
This multi divergence indicator does not repaint until the bar closes.
It does not use offset as well.
I might create another private version of this indicator including the option to make an alert if there are interested.
Enjoy and trade at your own risk!
Happy Trading!!!
CDC DivergencesA handy little indicator to help identify different kinds of convergences/divergences
The indicator compares price movements with the momentum and volume movements, Hidden divergences are left out, at least in the first version, because I wanted this indicator to be as simple as possible.
The divergences are shown with labels, user can change the momentum/volume indicator used to identify divergences in the settings.

Vision Essentials - MACDVision Essentials - MACD is the second indicator in our Essentials pack. It's a fully customizable MACD indicator with some extra perks the Vision team feels provides helpful & simplified insight when studying a chart.
What makes this indicator different?
Under the Standard mode you'll feel right at home compared to a standard macd indicator. Our Advanced mode is where things change a bit more. Under Advanced mode outside of the visual customization we provide visual outputs identifying bullish/bearish crossovers of the macd & signal, and track the high and low points of the macd with a second set of colors which users can customize. We also plot text in these areas so there's a clear indication of what the changing colors mean.
How do I use this indicator?
To start, it's best you have an understanding of what MACD (moving average convergence divergence) is. There are lots of great educational ideas here on TradingView which we recommend absorbing. We highly recommend you start with this article directly from the TradingView Help Center
Settings
MACD Mode - Standard provides you with a closer to traditional style MACD whereas Advanced at a glance highlights areas such as crossover points, highs, lows, and current direction relative to histogram movement.
MACD Settings - Select the source & values used for the macd calculations. close is the most commonly used source, and 12/26/9 are the most common length values. Adjust these to see how the indicator behaves. Lowering the fast and slow values will result in more activity, but be aware that doesn't = more accuracy.
Standard Visual Settings - STANDARD MODE: These settings will adjust the color you want to use as an indication of bullish & bearish movement.
Advanced Visual Settings - ADVANCED MODE: Use these settings to adjust the color you want to use as an indication of bullish, bearish, recent macd highs, recent macd lows, and text color.
High/Low Distance - ADVANCED MODE: This setting defines how far back the indicator looks to find the most recent highs/lows of macd.
Enable Crossover Bars - ADVANCED MODE: This settings enables the vertical bars that connect the center of the histogram to the macd/signal "wave" to indicate where crossovers are happening.

RSI Overbought Divergence Indicator with AlertsThis indicator alerts you only if there are divergences after price was oversold or overbought

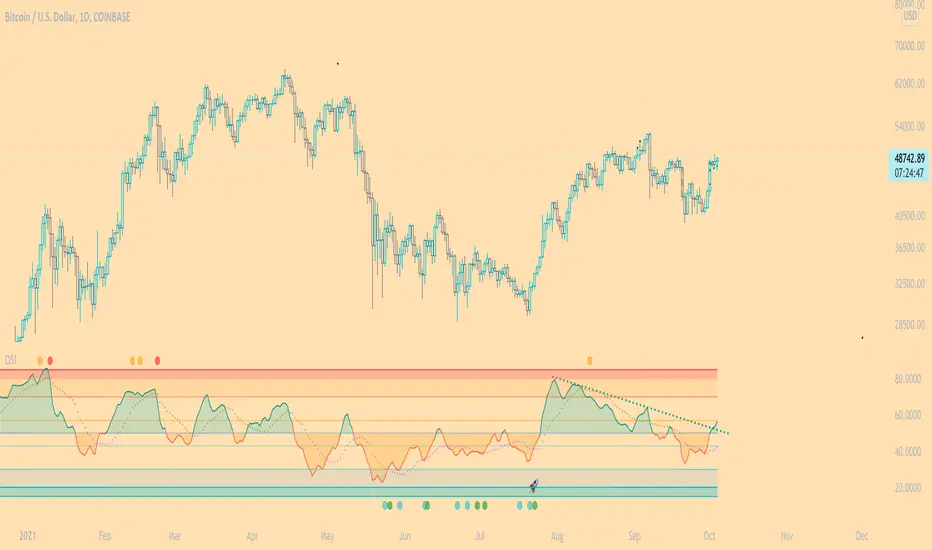
DSI - Dynamic Strength Index The DSI is a volume weighted momentum indicator similar but superior to the traditional RSI.
The DSI algorithm takes values for RSI, MFI, OBV and stochastics, then gives them each a different weighting depending on their historic reliability in different market conditions, and then averages out the values.
This results in a very reliable, noise-free momentum indicator, especially reliable on high timeframes.
Further features include:
Auto Trendlines - Up-downtrend lines to show support, resistance and breakouts
Supertrend- A momentum (ATR based) version of the Supertrend.
Divergences - Bullish and bearish momentum divergences, with confirmation signals.
General Rules:
Bullish above 50
Bearish below 50
Enjoy!
MM
True Strength Index Histogram [Futures Market]This is a modified version of True Strength Index to fit the scalping trading style in futures market

RSI OBLIVION This is a powerful tool if combined with other parameters. It's an advanced version of an RSI .
It shows OB and OS conditions and price direction or shift of the trend.
This indicator can be used in various ways with all markets.
The current settings are designed to work with futures market.
Combined with our TSI and Price action, RSI OBLIVION is the most reliable KPI out there.
Reached out to us for assistance.

On-chart Wavetrend Divergence with PivotsThis is an OnChart WaveTrend Divergence Indicator with Pivots and Alerts
LazyBears WaveTrend Indicator or also known as "Market Cipher" is an Indicator that is based on Moving Averages, therefore its an "lagging indicator". Lagging indicators are best used in combination with leading indicators. In this script the "leading indicator" component are Daily, Weekly or Monthly Pivots. These Pivots can be used as dynamic Support and Resistance, Stoploss, Take Profit etc.
This indicator combination is best used in larger timeframes. For lower timeframes you might need to change settings to your liking.
What are those circles?
-These are the WaveTrend Divergences. Red for Regular-Bearish. Orange for Hidden-Bearish. Green for Regular-Bullish. Aqua for Hidden-Bullish.
Please keep in mind that this indicator is a tool and not a strategy, do not blindly trade signals, do your own research first! Use this indicator in conjunction with other indicators to get multiple confirmations.

Divergence HunterThis script searches multiple divergences based on the wave trend indicator
You could combine support and resistance to identify with the bearish divergence a Potential Top.
Bullish divergence on the other hand could indicate that the market found its bottom and you should keep your eye open for an long entry.
If you are already short and took some profit the hidden bearish divergence could indicate a continuation of the downtrend. Could also be used together with Fib-Retracement to find a reentry or an add for your current entry.
Hidden bull divs could be used to find a reentry in the current up trending move or of course could be used as and add for your current position.
If you want to try it or have questions leave me a message.
DISCLAIMER: No sharing, copying, reselling, modifying, or any other forms of use are authorized for the documents, script / strategy, and the information published with them. This informational planning script / strategy is strictly for individual use and educational purposes only. This is not financial or investment advice. Investments are always made at your own risk and are based on your personal judgement. I am not responsible for any losses you may incur. Please invest wisely.
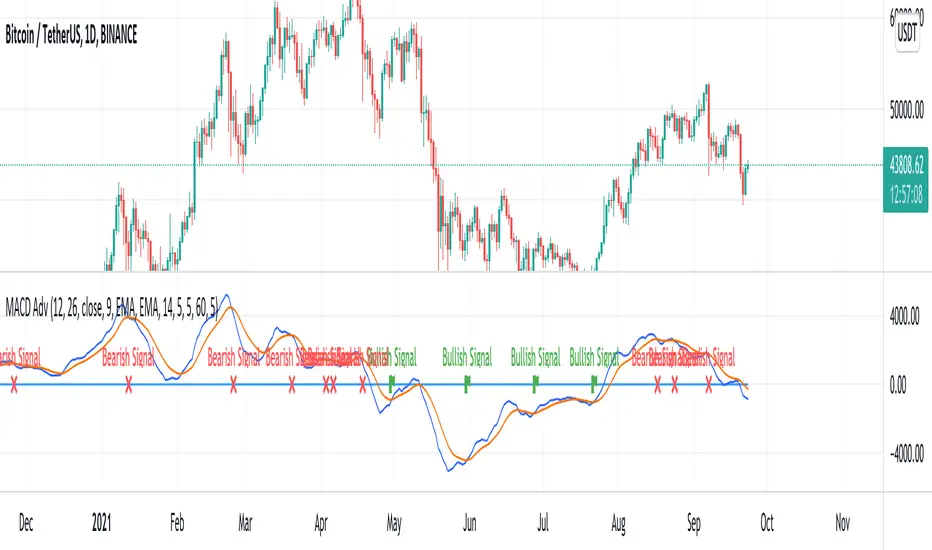
MACD AdvancedHello traders!
As you know, MACD is one of the oldest and the most popular indicators for trading. It seems to be a «Hello world indicator» of most technical analysis beginners. It’s easy to interpret and rather useful for many styles of trading. There are many arguments about its accuracy but in my opinion, this indicator can show very good results. However, you should squeeze every drop of its opportunities and we'll help you with it. We invented this script to make the lives of both professionals and freshmen easier.
Our new indicator uses all the opportunities that MACD gives. It takes into consideration divergencies, crossovers, the MACD, and signal line location. It seems to be rather difficult to take into consideration all MACD signals when you don’t use algorithmic trading, but it’ll be trivial using our script. We have integrated some innovations that’ll make traders’ staff easier. As you know, the crossover is considered to be a false signal in conjunction with hidden divergence which predicts another movement. Thus, we catch all types of divergencies and if it’s hidden of another «value» we skip it. However, if there's a crossover with bullish divergence or cross under with bearish, the signal seems to be strong and accurate. In this case, divergence is playing for us and makes the point of entrance more trustable. Our script takes into consideration this case and the innovative divergence chaser doesn’t give any mistakes. Moreover, if crossover takes place above zero line and crosses under bellow it, these signals are considered to be false too. It’s a trivial task comparing with the previous, thus it’s extremely simple for our script. We called it MACD Advanced cause it uses all the power of MACD with the power of invasive divergence chasers. The usage of it is trivial. Just add it to the chart, tune the parameters like MACD and tune the divergence chaser and get very accurate signals. We decided not to draw the bars to make signals more visible. It seems to be very nice!
I hope guys you'll enjoy it and it'll become a part of your trading staff.
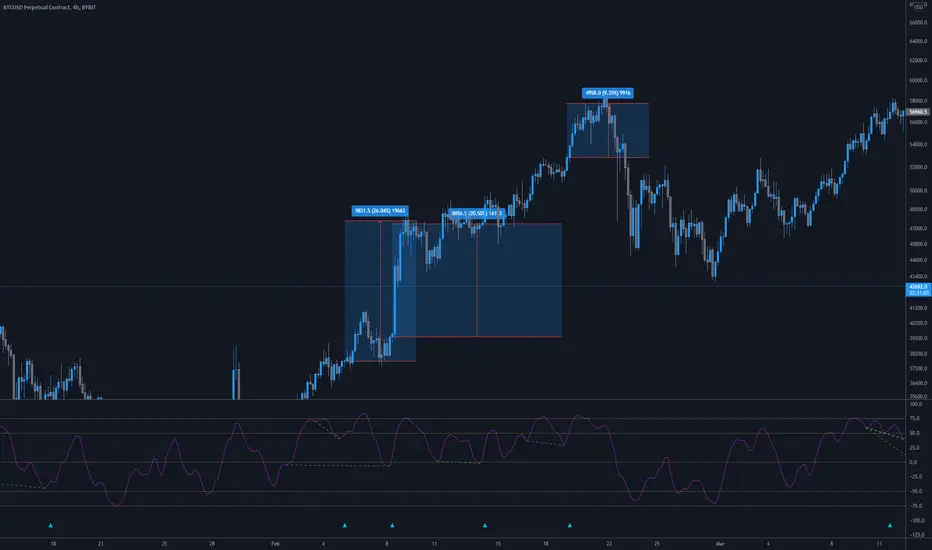
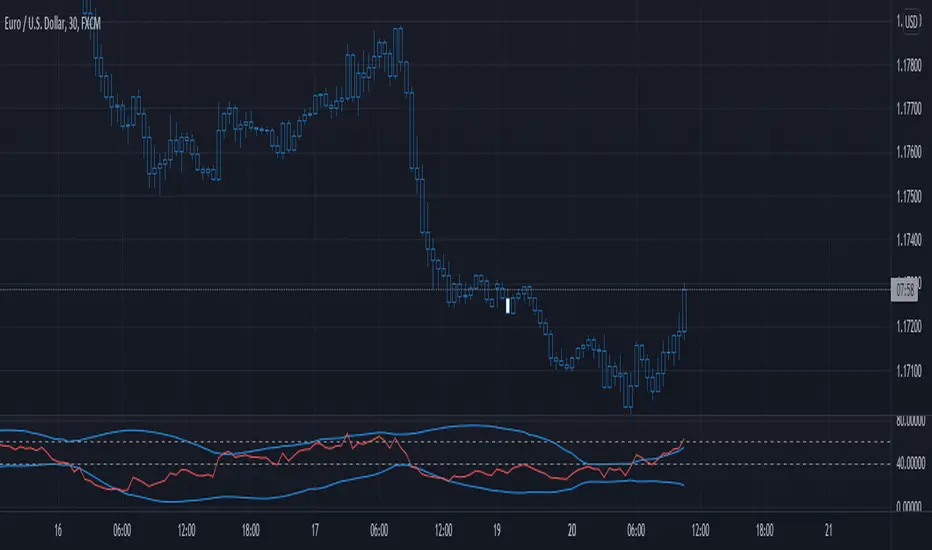
Divergence, RSI+Bollinger Band breachHi everyone, I have developed a divergence system using RSI and Bollinger Bands. It contains a series of filters which are fine tuned to generate razer sharp entries. It works by first identifying divergence between peak 1 and peak 2. Peak 1 must have enough momentum and strength to Breach the Bollinger bands. Once these criteria are met, a white candle will signal an entry to go long or short. The take profits for this trading system are most accurate when set at about 50-70% retracement of the bottom/top of the valley, to the trade entry. Stop loss's can be set 1:1 or up to the discretion of the trader if they so choose to grid/martingale their way out of a loosing trade. Signals are best taken on the 30M timeframes, and using upper time frames to determine market structure ( support, resistance, fibs, ) or what ever you may use to provide confidence of a reversal.
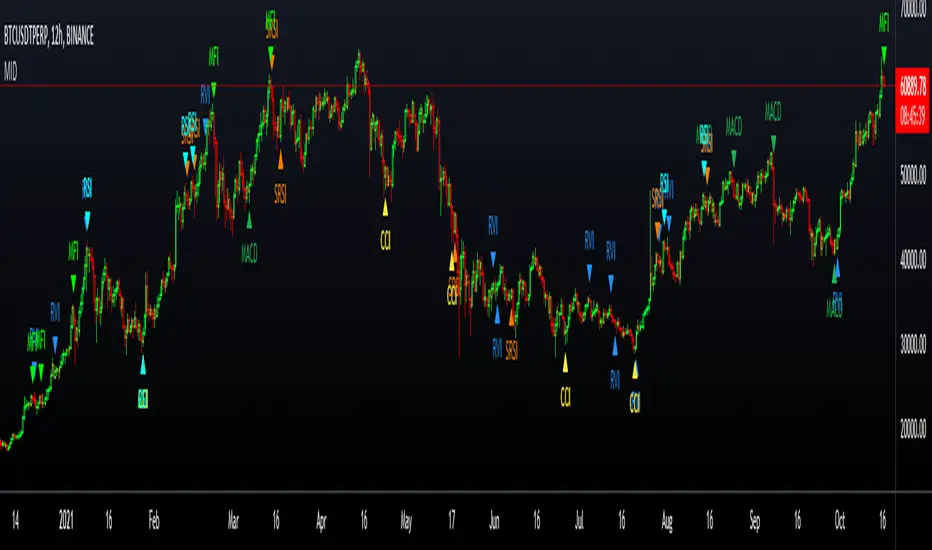
Multi-ZigZag Multi-Oscillator Trend DetectorThis table is intended to give you snapshot of how price and oscillators are moving along with zigzag pivots.
This is done in the same lines of Zigzag-Trend-Divergence-Detector
But, here are the differences
Table shows multiple oscillator movements at a same time instead of one selected oscillator
Divergence is not calculated and also supertrend based trend. Trend can be calculated based on zigzag movements. However, lets keep this for future enhancements.
This system also uses multiple zigzags instead of just one.
⬜ Process
▶ Derive multiple zigzags - Code is taken from Multi-ZigZag
▶ Along with zigzags - also calculate different oscillators and attach it to zigzag pivot.
▶ Calculate directions of zigzag pivots and corresponding oscillators.
▶ Plot everything in the table on last bar.
⬜ Table components
Table contains following data:
Directional legends are:
⇈ - Higher High (Green)
⇊ - Lower Low (Red)
⭡- Lower High (Orange)
⭣ - Higher Low (Lime)
⬜ Input Parameters
▶ Source : Default is close. If Unchecked - uses high/low data for calculating pivots. Can also use external input such as OBV
▶ Stats : Gives option to select the depth of output (History) and also lets you chose text size and table position.
▶ Oscillators : Oscillator length is derived by multiplying multiplier to zigzag length. For example, for zigzag 5, with 4 as multiplier, all oscillators are calculated with length 20. But, same for zigzag 8 will be 32 and so on.
▶ Available oscillators :
CCI - Commodity Channel Index
CMO - Chande Momentum Oscillator
COG - Center Of Gravity
MFI - Money Flow Index (Shows only if volume is present)
MOM - Momentum oscillator
ROC - Rate Of Change
RSI - Relative Strength Index
TSI - Total Strength Index
WPR - William Percent R
BB - Bollinger Percent B
KC - Keltner Channel Percent K
DC - Donchian Channel Percent D
ADC - Adoptive Donchian Channel Percent D ( Adoptive-Donchian-Channel )
⬜ Challenges
There are 12 oscillators and each zigzag has different length. Which means, there are 48 combinations of the ocillators.
First challenge was generating these values without creating lots of static initialization. Also, note, if the functions are not called on each bar, then they will not yield correct result. This is achieved through initializer function which runs on every bar and stores the oscillator values in an array which emulates multi dimensional array oscillator X zigzag length.
Next challenge was getting these values within function when we need it. While doing so I realized that values stored in array also have historical series and calling array.get will actully get you the entire series and not just the value. This is an important takeaway for me and this can be used for further complex implementations.
Thanks to @LonesomeTheBlue and @LucF for some timely suggestions and interesting technical discussions :)

Moving Average Oscillator by [DM]Greetings colleagues
Today I share an indicator that I had been thinking about for a long time. Its a easy idea but not easy to exploit"
The signals are generated the same as a MACD but the signal lengths are different.
In its standard form, the average signal of all signals is shown.
It has been designed for all those who use moving stockings in a conventional way and do not want to see the moving stockings in the price.
The options are endless on the indicator.
Show or hide all signals
Show or hide fill color of the signals
Show or hide fill gradient color of the signals
Show or hide horizontal lines
Graduation of horizontal lines with only one parameter
Show or hide fill color of horizontal lines
Show or hide fill gradient color of the horizontal lines
Alarms can be configured with any crossover
All sign lengths can be adjusted
You can change the color of each horizontal line and / or hide

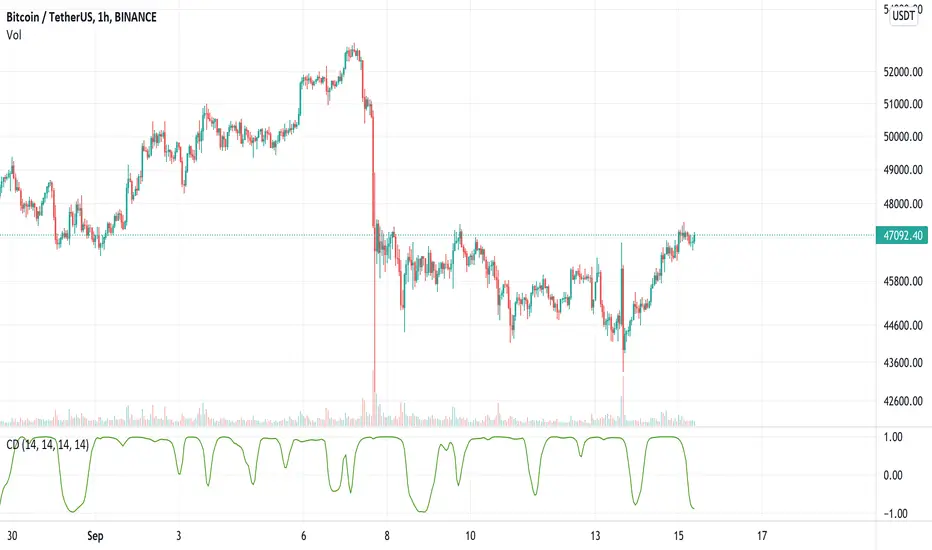
Continuous DivergenceDivergence is generally measured on the RSI and limited to finding either:
1. higher highs on the price and lower highs on the RSI (bearish divergence)
2. lower lows on the price and higher lows on the RSI (bullish divergence)
Continuous Divergence (CD) does two things differently. Firstly, it uses the MFI as its primary source of data, due to its volume component giving it higher accuracy. Secondly, it doesn't measure discrete divergence - i.e. between peaks and troughs - but rather a continuous divergence measurement.
Essentially it is measuring at any given time, the correlation between the price and the MFI. This is smoothed with a moving average (configurable) to get cleaner lines.
CD is used to detect both a slowing down of momentum on the current trend, and a reversal of trend due to changing momentum.
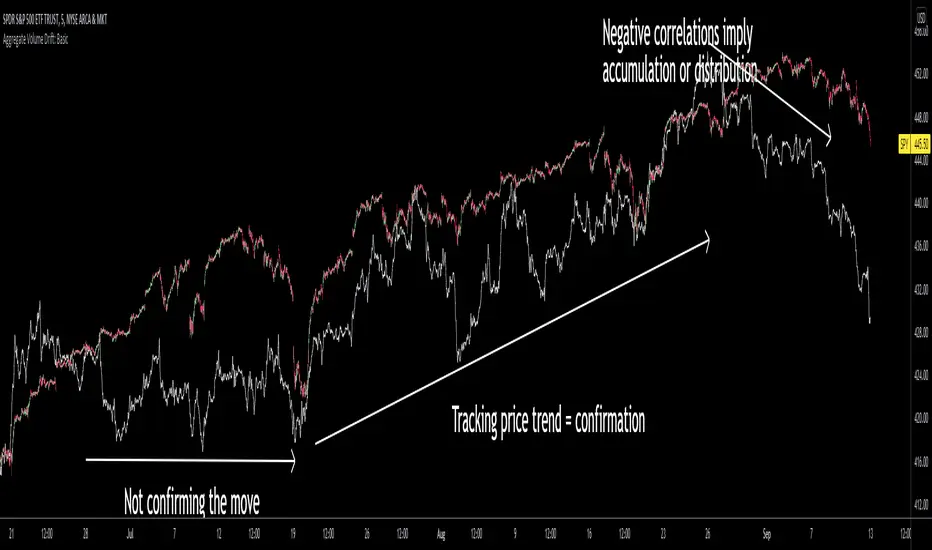
Aggregate Volume Drift: BasicIt's finally time to release this beast!
This is a leading indicator that uses price and volume to visualize the significance of money flow over a period of time.
I personally use this script to identify scenarios where low volume is exploited to easily move price for accumulation and distribution. Because this is a cumulative indicator, I generally suggest zooming out as far as possible to get the most out it's signals.
Day traders, consider trying this script on sub 1-minute timeframes. Look for trends which divergence or confirm.
Never use this script alone. It's not perfect. Price action is king and USE STOPS!
If you like this indicator and would like to use it's full functionality with many more settings including timeframe configurations, signal manipulation, accumulation settings etc, or just have any questions, feel free to send me a message.
Love you all and good luck.
Zigzag Trend/Divergence DetectorPullbacks are always hardest part of the trade and when it happen, we struggle to make decision on whether to continue the trade and wait for recovery or cut losses. Similarly, when an instrument is trending well, it is often difficult decision to make if we want to take some profit off the table. This indicator is aimed to make these decisions easier by providing a combined opinion of sentiment based on trend and possible divergence.
⬜ Process
▶ Use any indicator to find trend bias. Here we are using simple supertrend
▶ Use any oscillator. I have added few inbuilt oscillators as option. Default used is RSI.
▶ Find divergence by using zigzag to detect pivot high/low of price and observing indicator movement difference between subsequent pivots in the same direction.
▶ Combine divregence type, divergence bias and trend bias to derive overall sentiment.
Complete details of all the possible combinations are present here along with table legend
⬜Chart Legend
C - Continuation
D - Divergence
H - Hidden Divergence
I - Indeterminate
⬜ Settings
▶ Zigzag parameters : These let you chose zigzag properties. If you check "Use confirmed pivots", then unconfirmed pivot will be ignored in the table and in the chart
▶ Oscillator parameters : Lets you select different oscillators and settings. Available oscillators involve
CCI - Commodity Channel Index
CMO - Chande Momentum Oscillator
COG - Center Of Gravity
DMI - Directional Movement Index (Only ADX is used here)
MACD - Moving average convergence divergence (Can chose either histogram or MACD line)
MFI - Money Flow Index
MOM - Momentum oscillator
ROC - Rate Of Change
RSI - Relative Strength Index
TSI - Total Strength Index
WPR - William Percent R
BB - Bollinger Percent B
KC - Keltner Channel Percent K
DC - Donchian Channel Percent D
ADC - Adoptive Donchian Channel Percent D ( Adoptive-Donchian-Channel )
▶ Trend bias : Supertrend is used for trend bias. Coloring option color candles in the direction of supertrend. More option for trend bias can be added in future.
▶ Stats : Enables you to display history in tabular format.
Overview of settings present here:
⬜ Notes
Trend detection is done only with respect to previous pivot in the same direction. Hence, if chart has too many zigzags in short period, try increasing the zigzag length or chart timeframe. Similarly, if there is a steep trend, use lower timeframe charts to dig further.
Oscillators does not always make pivots at same bar as price. Due to this some the divergence calculation may not be correct. Hence visual inspection is always recommended.
⬜ Possible future enhancements
More options for trend bias
Enhance divergence calculation. Possible options include using oscillator based zigzag as primary or using close prices based zigzag instead of high/low.
Multi level zigzag option - Can be messy to include more than one zigzag. Option can be added to chose either Level1 or Level2 zigzags.
Alerts - Alerts can only be added for confirmed pivots - otherwise it will generate too many unwanted alerts. Will think about it :)
If I get time, I will try to make a video.

Smart Oscillator PremiumThe Smart Oscillator Premium indicator is a clever oscillator that helps you estimate the direction of trends. It is adaptive to a variety of markets and timeframes and provides rich and colorful visuals using a vibrant color scheme. Aiming to keep things simple, the oscillator only needs one parameter, the length of your base moving average, which defaults to 32.
Overview
As seen in the image above we provide key metrics to assist in choosing smart entry and exit points.
Key Features:
Get a better idea of the trend direction.
Spot divergences in price movements from your chosen moving average.
Using our Smart Candle technology better estimate tops and bottoms.
Using our Whale Sonar technology spot opportunities to enter and exit.
Smart Bollinger Bands using custom Fibonacci levels.
While we believe our default theme is attractive, we expose all style settings to the user to meet their preferences.
Alerts for divergences, with more coming soon.
Road Map:
While we believe this indicator should currently be used in a discretionary manner, we are currently working towards providing you with automated entry/exit signals. We also believe user feedback is a big part of the development process. You can leave us any suggestions or features you may want implemented via our Discord server.
Disclaimer:
By using this script you acknowledge past performance is not necessarily indicative of future results and there are many more factors that go into being a profitable trader.
Access:
See the authors instructions below to get access to our Premium Indicator suite.

On Balance VolumeEnhanced the original OBV (On Balance Volume) indicator:
- Draw max lines of OBV in the last 30 candles so that we can notice the trend, as well as divergences easier.
- If you use fiat as base currency (USDT in cryptocurrency for example), we can display the OBV in fiat, so that we can compare total trading volume across a list of symbols to find healthy symbols to trade easier.

On-Balance Volume Oscillator with Divergence and PivotsThis is On-Balance Volume recalculated to be an Oscillator, a Divergence hunter was added, also Pivot Points and Alerts.
On-Balance Volume, or OBV is considered a "leading indicator" - in contrast to a "lagging indicator" just as Moving Averages it does not show a confirmation what already happened, but it shows what can happen in the future. For example: The chart is climbing while the OBV oscillator is slowly declining, gets weaker and weaker, maybe even prints bearish divergences? That means that a reversal might be occurring soon. Leading indicators are best paired with Stop and Resistance Lines, general Trendlines, Fib Retracements etc...Your chart is approaching a very important Resistance Trendline but the OBV shows a very positive signal? That means there is a high probability that the Resistance is going to be pushed though and becomes Support in the future.
What are those circles?
-These are Divergences. Red for Regular-Bearish. Orange for Hidden-Bearish. Green for Regular-Bullish. Aqua for Hidden-Bullish.
What are those triangles?
- These are Pivots. They show when the OBV oscillator might reverse, this is important to know because many times the price action follows this move.
Please keep in mind that this indicator is a tool and not a strategy, do not blindly trade signals, do your own research first! Use this indicator in conjunction with other indicators to get multiple confirmations.
