Logistic RSI, STOCH, ROC, AO, ... by DGTExperimental attemt of applying Logistic Map Equation for some of widly used indicators.
With this study "Awesome Oscillator (AO)", "Rate of Change (ROC)", "Relative Strength Index (RSI)", "Stochastic (STOCH)" and a custom interpretation of Logistic Map Equation is presented
Calculations with Logistic Map Equation makes sense when the calculated results are iterated many times within the same equation.
Here is the Logistic Map Equation : Xn+1 = r * Xn * (1 - Xn)
Where, the value of r is the key for this equation which changes amazingly the behaviour of the Logistic Map.
The value we have asigned for r is less then 1 and greater than 0 ( 0 < r < 1) and in this case the iterations performed with the maximum number of output series allowed by Pine is quite enough for our purpose and thanks to arrays we can easiliy store them for further processing
What we have as output:
Each iteration result is then plotted (excluding plotting the first iteration), as circles or line based on user preference
Values above and below zero level (0) are coloured differently to emphasis bull and bear power
Finally Standard Deviation of Array's Elements is ploted as line. Users may choose to display this line only
So where it comes the indicators "Awesome Oscillator (AO)", "Rate of Change (ROC)", "Relative Strength Index (RSI)", "Stochastic (STOCH)".
Those are the indicators whose values are assigned to our key varaiable in the Logistic Map equation forulma which is r
Further details regarding Logistic Map can found under the description of “Logistic EMA w/ Signals by DGT” study
Disclaimer:
Trading success is all about following your trading strategy and the indicators should fit within your trading strategy, and not to be traded upon solely
The script is for informational and educational purposes only. Use of the script does not constitute professional and/or financial advice. You alone have the sole responsibility of evaluating the script output and risks associated with the use of the script. In exchange for using the script, you agree not to hold dgtrd TradingView user liable for any possible claim for damages arising from any decision you make based on use of the script
指标和策略

[JRL] MM FibonacciThis is a new indicator that uses Murrey Math formulas to find the tops and bottoms, then uses those tops and bottoms to draw long-term fibonacci retracement levels. The genius of Murrey was his geometric formulas to calculate the right place to start plotting the lines, but I think the fibonacci ratios typically seem more accurate than the MM line ratios. So in this script I attempt to take the best of each and combine them into a new, superior indicator.
Let me know in the comments if you find this useful. Cheers!

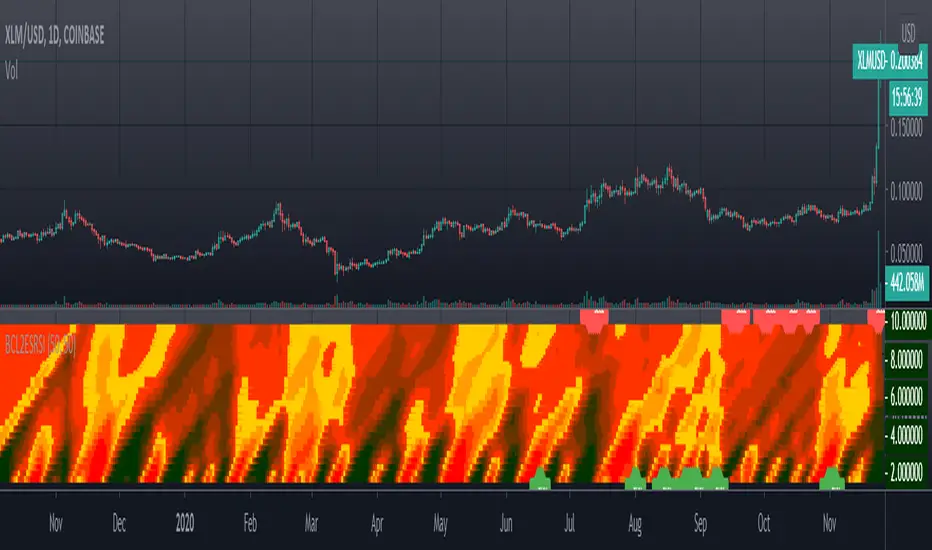
[blackcat] L2 Ehlers SwamiCharts RSILevel: 2
Background
John F. Ehlers introuced SwamiCharts RSI in his "Cycle Analytics for Traders" chapter 16 on 2013.
Function
SwamiCharts retain the core functionality of the technical indicators with which you're already familiar, while packing much more information into an easy-to interpret heat map chart. With SwamiCharts, you now visualize each indicator over a range of lookback periods
to reveal a better view of the indicator's truer meaning in context. SwamiCharts provide a better solution because you can now visualize context over a wide range of lookback periods. Trends and cycles emerge more succinctly, while continuation patterns and reversals become
easier to identify. SwamiCharts solves the data lookback problem by enabling you to view market conditions at a glance, a feature that will dramatically facilitate your trading.
Since the MyRSI is computed for all values over the range of lookback periods, it must be an array in Pine v4.0 rather than a variable. The RSI is computed relative to the output of the roofing filter rather than price closes to eliminate the effects of Spectral Dilation. After the computation of the ratio, the indicator is smoothed in a SuperSmoother filter, so we must create the three most recent instances ourselves in the code. This is because Pine v4.0 retains historical values for variables but not for arrays. In fact, ratio must be an array also for the same reasons. The coefficients for the 10-bar SuperSmoother filter are computed and are the same for all lookback periods, and so can be outside the lookback loop to make the calculations a little more efficient.
Key Signal
MyRSI1 --> Modified RSI by John Ehlers
Pros and Cons
100% John F. Ehlers definition translation, even variable names are the same. This help readers who would like to use pine to read his book.
Remarks
The 62th script for Blackcat1402 John F. Ehlers Week publication.
Readme
In real life, I am a prolific inventor. I have successfully applied for more than 60 international and regional patents in the past 12 years. But in the past two years or so, I have tried to transfer my creativity to the development of trading strategies. Tradingview is the ideal platform for me. I am selecting and contributing some of the hundreds of scripts to publish in Tradingview community. Welcome everyone to interact with me to discuss these interesting pine scripts.
The scripts posted are categorized into 5 levels according to my efforts or manhours put into these works.
Level 1 : interesting script snippets or distinctive improvement from classic indicators or strategy. Level 1 scripts can usually appear in more complex indicators as a function module or element.
Level 2 : composite indicator/strategy. By selecting or combining several independent or dependent functions or sub indicators in proper way, the composite script exhibits a resonance phenomenon which can filter out noise or fake trading signal to enhance trading confidence level.
Level 3 : comprehensive indicator/strategy. They are simple trading systems based on my strategies. They are commonly containing several or all of entry signal, close signal, stop loss, take profit, re-entry, risk management, and position sizing techniques. Even some interesting fundamental and mass psychological aspects are incorporated.
Level 4 : script snippets or functions that do not disclose source code. Interesting element that can reveal market laws and work as raw material for indicators and strategies. If you find Level 1~2 scripts are helpful, Level 4 is a private version that took me far more efforts to develop.
Level 5 : indicator/strategy that do not disclose source code. private version of Level 3 script with my accumulated script processing skills or a large number of custom functions. I had a private function library built in past two years. Level 5 scripts use many of them to achieve private trading strategy.
A Useful MA Weighting Function For Controlling Lag & SmoothnessSo far the most widely used moving average with an adjustable weighting function is the Arnaud Legoux moving average (ALMA), who uses a Gaussian function as weighting function. Adjustable weighting functions are useful since they allow us to control characteristics of the moving average such as lag and smoothness.
The following moving average has a simple adjustable weighting function that allows the user to have control over the lag and smoothness of the moving average, we will see that it can also be used to get both an SMA and WMA.
A high-resolution gradient is also used to color the moving average, makes it fun to watch, the plot transition between 200 colors, would be tedious to make but everything was made possible using a custom R script, I only needed to copy and paste the R console output in the Pine editor.
Settings
length : Period of the moving average
-Lag : Setting decreasing the lag of the moving average
+Lag : Setting increasing the lag of the moving average
Estimating Existing Moving Averages
The weighting function of this moving average is derived from the calculation of the beta distribution, advantages of such distribution is that unlike a lot of PDF, the beta distribution is defined within a specific range of values (0,1). Parameters alpha and beta controls the shape of the distribution, with alpha introducing negative skewness and beta introducing positive skewness, while higher values of alpha and beta increase kurtosis.
Here -Lag is directly associated to beta while +Lag is associated with alpha . When alpha = beta = 1 the distribution is uniform, and as such can be used to compute a simple moving average.
Moving average with -Lag = +Lag = 1 , its impulse response is shown below.
It is also possible to get a WMA by increasing -Lag , thus having -Lag = 2 and +Lag = 1 .
Using values of -Lag and +Lag equal to each other allows us to get a symmetrical impulse response, increasing these two values controls the heaviness of the tails of the impulse response.
Here -Lag = +Lag = 3 , note that when the impulse response of a moving average is symmetrical its lag is equal to (length-1)/2 .
As for the gradient, the color is determined by the value of an RSI using the moving average as input.
I don't promise anything but I will try to respond to your comments

Graham NumberGraham Number is named after the “father of value investing,” Benjamin Graham, who was a mentor of Warren Buffett. The figure takes into account earnings per share and book value per share to measure a stock's maximum fair market value. In other words, it is the upper end of the price range that a defensive investor should pay for the stock.
The Graham Number = Square Root of (22.5) x (tmm EPS) x (mrq Book Value per Share).
The 22.5 is included in the formula as a rule of thumb to account for Graham's assumption that the price-to-earnings ratio should not be over 15 and the price to book ratio should not be over 1.5 for an undervalued stock. So, the number is generated as (P/E of 15) x (P/B of 1.5) = 22.5.
So the script generates a Graham number plot.

Equivolume BarsEquivolume bars. Width is determined by volume. Please note that equivolume bars are rendered independently of the time scale.
Makes use of @LonesomeTheBlue's "Start the Script on Last Nth Bar" in order to prevent time out. As such you are only able to view the most recent bars and no bar replay beyond that range.
Pixel ArtHaving Fun with Arrays.
I couldn't load all of the images into their respective arrays without getting an "Internal Pine error" So I commented out some of them. You can pop them back in, but make sure to disable another in its place.
Vader
Pine Logo
&hearts
Bitcoin
pAulse

RSI buy sell force ver 1 Very simple script with no security MTF that show RSI buy and sell force
blue above red =bullish period
red above blue =bearish period
or you can try above 0 or bellow 0 as signal
if you want i will add signal after to this one

Aggregate BTC CandlesThis script creates candles based on an aggregated Index price from various BTC exchange tickers. Since the early years in particular have a lot of exchange specific flash crash wicks, missing data, erraticness compared to other exchanges particularly in their first few months, this is an attempt to clean up the price history, be it for TA (trendlines, S/R etc.) or use in algos or other indicators, without reliance on one exchange. It uses the new Array functionality to generate median and averages, and is entirely original work.

Bitcoin Bullish Percent IndexHello Traders,
This is Bitcoin Bullish Percent Index script. First lets talk about what the Bullish Percent Index and how it is calculated:
"The Bullish Percent Index (BPI) is a breadth indicator based on the number of securities on Point & Figure Buy Signals, Developed by Abe Cohen in the mid-1950s. Because a security is either on a P&F Buy or Sell Signal, there is no ambiguity when it comes to P&F charts. This makes BPI a straightforward indicator with clearly defined signals."
The calculation is straightforward and simple: (Number of securities on P&F Buy signals) / (Total number of securities)
Here you can see what the P&F buy signal is:
In this script I choose 40 cryptos that is correlated ( as I see ) with BTC (including BtcUsdt). in the first part the script creates P&F chart for each security and check if there is Buy or Sell signal and sum the buy signals if there is. in the second part it creates P&F chart by using the P&F buy/sell signals coming from the securities P&F chart. because of complicated calculation the script may need a few seconds to load.
in the first part reversal value is 3 by default but you can set different values as reversal. sometimes I got better results with reversal = 5.
in BPI part reversal = 3 is used. so each box represents 2% (each X or O is a box). And this means it takes at least a 6% move in BPI for a reversal. the Bullish Percent Index favors the bulls when above 50% and the bears when below 50%. The bulls have the edge when over 50% of stocks are on a P&F Buy Signal. BPI is also considered overbought when above 70% and oversold when below 30%. BPI can move between 0 and 100.
Because of 40 securities are used in the script and all different prices, it uses Percentage scaling only. it can calculate the Percentage automatically by using the time frame of the chart or you can set it as you wish.
The Signals coming from BPI:
Bull Alert: BPI is below 30% and then forms a new column of X's (rises)
Bear Alert: BPI is above 70% and then forms a new column of O's that decline below 70%.
Bull Confirmed: BPI is on a P&F buy signal and in a column of X's (rising).
Bear Confirmed: BPI is on a P&F sell signal and in a column of O's (falling).
Bull Correction: BPI is on a P&F buy signal, but currently falling (column of O's).
Bear Correction: BPI is on a P&F sell signal, but currently rising (column of X's).
If you are not familiar with Bullish Percent Index you better search it on the net to get more info, you can find a lot of articles and web sites about BPI.
as I remember I developed the script 6-7 months ago and today I had chance to publish it as it was
Enjoy!

Probability of ATR Index [racer8]Deriving the indicator:
PAI is an indicator I created that tells you the probability of current price moving a specified ATR distance over a specified number of periods into the future. It takes into account 4 variables: the ATR & the standard deviation of price, and the 2 parameters: ATR distance and # bars (time).
The formula is very complex so I will not be able to explain it without confusion arising.
What I can say is that I used integral calculus & the Taylor series to derive a formula that calculates the area under half of the normal distribution function. Thus, the formula was repeated twice in the code to derive the full probability (half + half = whole). If you can read the code, you might be wondering why the formula is so long...
The reason for this is because in Pine Script, the erf function doesn't exist. You see, the formula for normal distribution is: f(x) = (1/sqrt(2pi))*e^(-xx/2), assuming of course that the standard deviation = 1 and mu (mean) = 1. The next step is to take the integral of this formula in order to find the area under f(x). The problem is that I found the integral, F(x), of the normal distribution formula to be equal to F(x) = erf(x/sqrt(2))/2...and the erf function cannot be directly computed into Pinescript.
So I developed a solution...why not estimate the integral function? So that's exactly what I did using a technique involving the Taylor series. The Taylor series is an algebraic function that allows you to create a new function that can estimate the existing function. On a graph, the new function has the same values as the existing one, the only difference is that it uses a differnt formula, in this case, a formula that makes it possible to compute the integral. The disadvantage of using this new formula is that it is super long and if you want it to better represent the original integral over a wider range of x-values, you have to make it longer.
Signal Interpretion:
The hotter the colour, the more likely price will reach your specified distance.
The 2 values of PAI in the bottom window represent probability & average probability of your specifed distance geting hit.
Applications:
Stop loss placement---
This indicator is useful because it gives you an idea of the likelihood that a stop loss at a particular distance away from price (in ATRs) will be hit over a period of time specified. This is helpful in placing stop losses.
Options trading---
PAI can also be used in options trading. For example, you are using a strangle options strategy, and you want to make sure that price stays within the Strangle's profit range. So you only trade when PAI presents a low probability value of moving at a particular distance in ATRs over n periods.
Anyhow, I hope you guys like it. Enjoy! and hit that like button for me :)

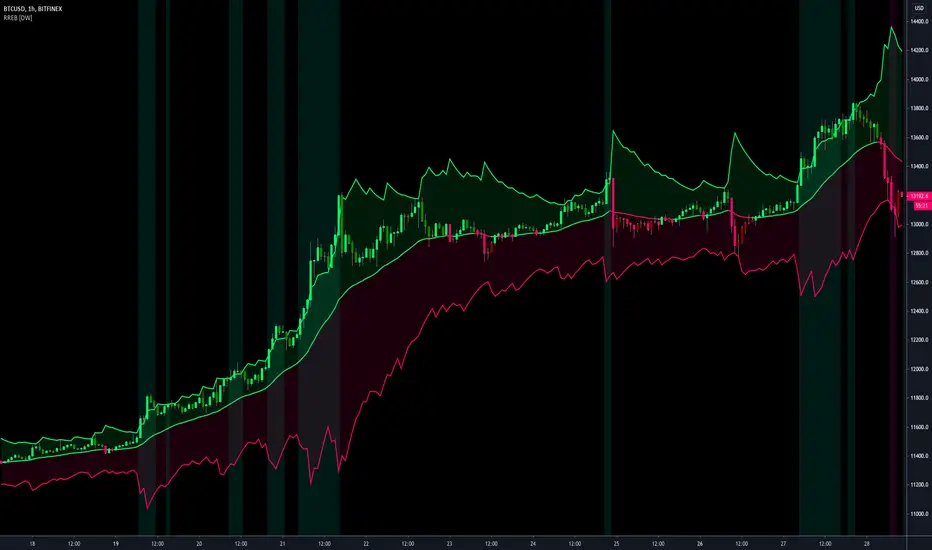
Resampling Reverse Engineering Bands [DW]This is an experimental study designed to reverse engineer price levels from centered oscillators at user defined sample rates.
This study aims to educate users on the process of oscillator reverse engineering, and to give users an alternative perspective on some of the most commonly used oscillators in the trading game.
Reverse engineering price levels from an oscillator is actually a rather simple, straightforward process.
Rather than plugging price values into a function to solve for oscillator values, we rearrange the function using some basic algebraic operations and plug in a specified oscillator value to solve for price values instead.
This process tells us what price value is needed in order for the oscillator to equal a certain value.
For example, if you wanted to know what price value would be considered “overbought” or “oversold” according to your oscillator, you can do that using this process.
In this study, the reverse engineering functions are used to calculate the price values of user defined high and low oscillator thresholds, and the price values for the oscillator center.
This allows you to visualize what prices will trigger thresholds as a sort of confidence interval, which is information that isn't inherently available when simply analyzing the oscillator directly.
This script is equipped with three reverse engineering functions to choose from for calculating the band values:
-> Reverse Relative Strength Index (RRSI)
-> Reverse Stochastic Oscillator (RStoch)
-> Reverse Commodity Channel Index (RCCI)
You can easily select the function you want to utilize from the "Band Calculation Type" dropdown tab.
These functions are specially designed to calculate at any sample rate (up to 1 bar per sample) utilizing the process of downsampling that I introduced in my Resampling Filter Pack.
The sample rate can be determined with any of these three methods:
-> BPS - Resamples based on the number of bars.
-> Interval - Resamples based on time in multiples of current charting timeframe.
-> PA - Resamples based on changes in price action by a specified size. The PA algorithm in this script is derived from my Range Filter algorithm.
The range for PA method can be sized in points, pips, ticks, % of price, ATR, average change, and absolute quantity.
Utilizing downsampled rates allows you to visualize the reverse engineered values of an oscillator calculated at larger sample scales.
This can be rather beneficial for trend analysis since lower sample rates completely remove certain levels of noise.
By default, the sample rate is set to 1 BPS, which is the same as bar-to-bar calculation. Feel free to experiment with the sample rate parameters and configure them how you like.
Custom bar colors are included as well. The color scheme is based on disparity between sources and the reverse engineered center level.
In addition, background highlights are included to indicate when price is outside the bands, thus indicating "overbought" and "oversold" conditions according to the thresholds you set.
I also included four external output variables for easy integration of signals with other scripts:
-> Trend Signals (Current Resolution Prices) - Outputs 1 for bullish and -1 for bearish based on disparity between current resolution source and the central level output.
-> Trend Signals (Resampled Prices) - Outputs 1 for bullish and -1 for bearish based on disparity between resampled source and the central level output.
-> Outside Band Signal (Current Resolution Prices) - Outputs 1 for overbought and -1 for oversold based on current resolution source being outside the bands. Returns 0 otherwise.
-> Outside Band Signal (Resampled Prices) - Outputs 1 for overbought and -1 for oversold based on resampled source being outside the bands. Returns 0 otherwise.
To use these signals with another script, simply select the corresponding external output you want to use from your script's source input dropdown tab.
Reverse engineering oscillators is a simple, yet powerful approach to incorporate into your momentum or trend analysis setup.
By incorporating projected price levels from oscillators into our analysis setups, we are able to gain valuable insights, make (potentially) smarter trading decisions, and visualize the oscillators we know and love in a totally different way.
I hope you all find this script useful and enjoyable!
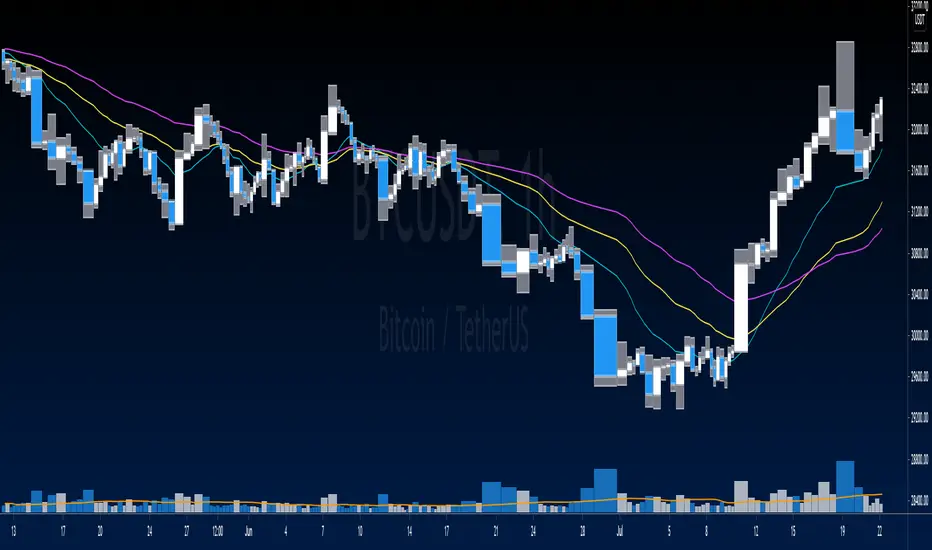
72s: Adaptive Hull Moving Average+One challenging issue for beginner traders is to differentiate market conditions, whether or not the current market is giving best possibility to stack profits, as earliest, in shortest time possible, or not.
On intraday, we've seen some big actions by big banks are somewhat can be defined --or circling around-- by HMA 200 . I've been thinking on to make the visuals more conform to price dynamics (separating major movement and minor noise) to get clearer signs of when it starts to happen. So it will be easier to see in a glance when the strength starts really taken place, with less cluttered chart.
This Adaptive HMA is using the new Pine Script's feature which now support Dynamic Length arguments for several Pine functions. ( read: www.tradingview.com). It hasn't support the built-in HMA() directly, but thankfully we can use its wma() formula to construct. (Note: I tweaked a bit HMA formula already popular here by using plain int() instead of round() on its wma's length, since I find it precisely match tradingview's built-in HMA).
You can choose which aspect the Adaptive HMA period will adapt to.
In this study I present it with two options: Volume and Volatility . It will "moves" faster or slower depends on which situation the aspect is currently into. ie: When volume is generally low or volatile readings is not there, price won't move very much, so the adapting MA will slow down by dynamically lengthen the lookback period, and vice versa, and so on.
Colour-markings in the Adaptive resembles which situation explained above. In addition, I also combine it with slope calculation of the MA to help measuring trend-strength or sideway/choppy conditions.
This way when we use it as dynamic support/resistance it will be more visually-reliable.
Secondly, and more important, it might help us traders with better probability info of whether or not a trade should even worth to be made . ie: If in the mean time market won't give much movement, any profit would also only as much. In most cases, we might better save our dime for later or place it somewhere else.
HOW TO USE:
Aside from better dynamic support/resistance and clearer breakout confirmation, MA is coloured as follow:
YELLOW:
Market is in consolidation or flat. Be it sideways, choppy, or in relatively small movements. If it shows up in a trending market, it may be an earlier sign that current trend might about to change its direction, or confirming a price broke-out to another side.
LIGHT GREEN or LIGHT RED:
Tells if a trend is forming but still relatively weak (or getting weaker), as it doesn't have volume or volatility to support.
DARKER GREEN ot DARKER RED:
This is where we can expect some good and strong price movement to ride. If it's strong enough, many times it marks a start of new long-lasting major trend.
SETTINGS:
Charger:
Choose which aspect your HMA should plug itself into, thus it will adapt to it.
Minimum Period, Maximum Period:
172 - 233 is just my own setting to outmatch the static HMA 200 for intraday. I find it --in my style of trading-- best in 15m tf in almost any pair, and 15m to 1H for some stocks. It also works nicely with conventional EMA 200, sometimes as if they somewhat work hand-in-hand in defining where the price should go. But you can, ofcourse, experiment with other ranges, broader or narrower. Especially if you already have an established strategy to follow to. As you might do with:
Consolidation area threshold:
This has to do with slope calculation. The bigger the number means your MA needs bigger degree to define the market is out of flat (yellow) area. This can be useful if needed to lighten up the filter or vice-versa.
Background colouring:
Just another colouring to help highlighting the difference in market conditions.
ALERTS:
There are two alerts:
Volume Break: when volume is breaking up above average, and
Volatility Meter: when the market more likely is about to have its moment of the big wiggling brush.
USAGE:
Very very nice BUY entry to catch big up-movement if:
1. Price is above MA. (It is best when price is also not to far distance from the MA, or you can also use distance oscillator to help out too)
2. HMA's color is in darker green. Means it's on the charging plug with your chosen aspect.
3. RSI is above 50. This is to help as additional confirmation.
Clear SELL entry signal is same as above, just the opposite.
-------------------------------------------------------
Note:
Lower timeframe of course means more noise to be filtered. Depends on the instrument, you might need to tweak the settings a bit till it conform nicely and shows lots of good trades in history. Here's another example on GBPUSD 5m timeframe:
For exit/take-profit point, you can use a second faster period static HMA. Or you can also use RSI. Here's an example:
Don't get me wrong, on few occasions I found it's still best using static MA to spot fakeouts, breakouts, etc, especially ones that's been already use widely. If that's the case or price actions seems suspicious, simply put the same value for minimum and maximum period settings, and there you have the original HMA with extra features.
For developer, check in the code if you need to customise your own charger.
-------------------------------------------------------
That's it. Hopefully this Adaptive HMA+ could at least be a good sidekick to your own strategy, as it does mine. ;)

PMax Explorer STRATEGY & SCREENERProfit Maximizer - PMax Explorer STRATEGY & SCREENER screens the BUY and SELL signals (trend reversals) for 20 user defined different tickers in Tradingview charts.
Simply input the name of the ticker in Tradingview that you want to screen.
Terminology explanation:
Confirmed Reversal: PMax reversal that happened in the last bar and cannot be repainted.
Potential Reversal: PMax reversal that might happen in the current bar but can also not happen depending upon the timeframe closing price.
Downtrend: Tickers that are currently in the sell zone
Uptrend: Tickers that are currently in the buy zone
Screener has also got a built in PMax indicator which users can confirm the reversals on graphs.
Screener explores the 20 tickers in current graph's time frame and also in desired parameters of the SuperTrend indicator.
Also you can optimize the parameters manually with the built in STRATEGY version.
PMax indicator :
Profit Maximizer - PMax is a brand new indicator developed by me.
It's a combination of two trailing stop loss indicators;
One is Anıl Özekşi's MOST (Moving Stop Loss) Indicator
and the other one is well known ATR based SuperTrend
Profit Maximizer - PMax tries to solve this problem. PMax combines the powerful sides of MOST (Moving Average Trend Changer) and SuperTrend (ATR price detection) in one indicator.
Backtest and optimization results of PMax are far better when compared to its ancestors MOST and SuperTrend. It reduces the number of false signals in sideways and give more reliable trade signals.
PMax is easy to determine the trend and can be used in any type of markets and instruments. It does not repaint.
The first parameter in the PMax indicator set by the three parameters is the period/length of ATR.
The second Parameter is the Multiplier of ATR which would be useful to set the value of distance from the built in Moving Average.
I personally think the most important parameter is the Moving Average Length and type.
PMax will be much sensitive to trend movements if Moving Average Length is smaller. And vice versa, will be less sensitive when it is longer.
As the period increases it will become less sensitive to little trends and price actions.
In this way, your choice of period, will be closely related to which of the sort of trends you are interested in.
We are under the effect of the uptrend in cases where the Moving Average is above PMax;
conversely under the influence of a downward trend, when the Moving Average is below PMax.
Built in Moving Average type defaultly set as EMA but users can choose from 8 different Moving Average types like:
SMA : Simple Moving Average
EMA : Exponential Movin Average
WMA : Weighted Moving Average
TMA : Triangular Moving Average
VAR : Variable Index Dynamic Moving Average aka VIDYA
WWMA : Welles Wilder's Moving Average
ZLEMA : Zero Lag Exponential Moving Average
TSF : True Strength Force
Tip: In sideways VAR would be a good choice
You can use PMax default alarms and Buy Sell signals like:
1-
BUY when Moving Average crosses above PMax
SELL when Moving Average crosses under PMax
2-
BUY when prices jumps over PMax line.
SELL when prices go under PMax line.

Responsive Linear Regression ChannelsThis is a linear trend indicator that can:
- automagically adjust to different chart resolutions
- snap to day/session boundaries on intraday
- totally not do the above and use ye olde good fixed lookback window
- show the regression trend and its RMSE channels
- disregard the trend and just show the period average and standard deviation lines (often acting as support and resistance)
The main idea was to allow you to quickly view linear trends for different time periods without having to calculate the required amount of bars.
By default, you will be able to quickly switch between 1-3 months, 6 months, 1 year, 2 years and 5 years of data, as well as various daily lookback periods.
Please adjust resolution settings to your liking.
Caveats:
- More data means more noise and slower calculations.
- HLC3 source is recommended, especially at resolutions above hourly.
- Trend will be slightly different if you use extended hours.
- If you use extended hours and don't have a data subscription, trend will be SUBSTANTIALLY different, especially at smaller resolutions like 1m.
- You might want to use 3.5 days per week for crypto (it's 7 days by default).
Known problems:
- If you can't see the trendlines, scroll to the left or zoom out - the origin could be outside of your viewport.
- Futures' sessions start on the previous day. We currently snap only to day boundaries, not session breaks.
- UVXY and the like that have extremely high price datapoints. The calculations will be wrong on some resolutions.
- Replay can freeze circa bar_index 244 — disable smart lookback and keep your window under 240 bars if you encounter this.
ACKNOWLEDGEMENTS:
Many thanks to alexgrover for his extremely efficient functions (used with permission)

Voss Predictor (A Peek Into the Future) - Dr. John EhlersI have been sitting on this for over a year, but I now present this "Voss Predictive Filter" multicator employing PSv4.0 upon initial release, originally formulated by the great and empowering Dr. John Ehlers for TASC - August 2019 Traders Tips. This is a slightly modified version of the original indicator John Ehlers designed. My improved implementation is an all-in-one combination of three indicators, consisting of Ehlers' 2-pole bandpass filter, fed into the Voss predictor, and my Correlation Color. I also purposefully attempted to make this indicator work on both "Light" and "Dark" charts equally well.
You can search for this indicator's white paper, entitled "A PEEK INTO THE FUTURE By John Ehlers", on his site in the educational reference section. It's VERY important that you fully grasp how this indicator works and when it doesn't during trending price movements. According to "TV House Rules", I can't link directly to his white paper on his web site. Technically he's a vendor, even though it has been divulged to me, that he is intending to retire after his last and final wØℾk$#Øp, where he is publicly disseminating the bulk of his unpublished proprietary code that drives his other website VERY SOON.
I love John Ehlers in a respectfully appreciative manner and he is my hero in life! I simply don't revel about pretended celebrities and supposed rock stars. I will never be able to adequately explain to you how much he has influenced me AND this website as it currently exists AND what is in store for the future of the ever evolving "Power of Pine". His inspiring legacy of code poetry shall forever be immortally enshrined here on TV and influence it.
Back to the topic of interest, this script originating from John Ehlers' mind... This indicator helps to anticipate cyclic turning points via negative group delay. It is NOT a predictive crystal ball. Do not become cluelessly disillusioned by it's title. I need to explain.
For example, this indicator could not have anticipated that the bold faced lie of "15 Days to Slow the Spread" of the CHImeravirus "plandemic" in the USA, would turn into our factual reality of multi state mandated orders demanding months of unconstitutional prison cell styled lockdowns with closures and the absurd criminalization of not wearing a mouth mask made from underwear while not being evidently ill, additionally combined with 24/7 black magick mass hypnosis spoon feeding non-scientific fear based psychological propaganda from the world's "finest" epidemiological data analysts and misleaders, eventually decimating the world's markets into zombie economies with abhorrent results of long term massive unemployment and financial hardship on a chart scale never before witnessed. Yep, it's NOT capable of predetermining any of that. I just wanted to make that very clear by example in a metaphorical manner many people can relate to concerning Voss' ability to anticipate.
The indicator consists of a bandpass filter coupled to the Voss predictor. Also, one thing about the Voss predictor, it can catch minute turning points or even false ones as explained in the white paper. So... I included my Correlation Color as a fitting companion to aid you in filtering out false signals during trending price movements. The Voss Predictive Filter should never be used alone, be forewarned!
Features List Includes:
Dark Background - Easily disabled in indicator Settings->Style for "Light" charts or with Pine commenting
AND a few more... Why list them, when you have the source code to explore!
When available time provides itself, I will consider your inquiries, thoughts, and concepts presented below in the comments section, should you have any questions or comments regarding this indicator. When my indicators achieve more prevalent use by TV members , I may implement more ideas when they present themselves as worthy additions. Have a profitable future everyone!

Multi-Sub by jchang274How it begin?
Traders and investors use market breadth in order to assess the index’s overall health. Market breadth can be a reliable, if not an accurate, indicator of an upcoming price rise in the index. Similarly, it can also provide early warning signs for a future price decline.
What is it?
Market breadth indicators analyze the number of stocks advancing relative to those that are declining in a given index or on a stock exchange.
Market breadth refers to how many stocks are participating in a given move in an index or on a stock exchange. An index may be rising yet more than half the stocks in the index are falling because a small number of stocks have such large gains that they drag the whole index higher.
How it works?
Market breadth studies attempt to uncover strength or weakness in the movements of an index that are not visible simply by looking at a chart of the index.
Divergence Indicator (any oscillator)A modification of the TV builtin "Divergence indicator" (Version 10) that can be applied to any indicator, and can be plotted on price as well.
Usage:
Add your favorite oscillator, RSI, Klinger, TSI, CMF, or anything else to a chart.
Click the little ... (More) on the oscillator.
Then add this indicator "Divergence Indicator (any oscillator)" on your oscillator of choice.
Click the settings on this indicator and make sure the source is set to the right plot from your oscillator.
Watch for it to plot divergences...
Add this indicator a second time on the price chart (and select the same oscillator plot), but check the box "plot on price (rather than on indicator)""
See you divergence plotted on price (as well as on the oscillator)

Dynamic Dots Dashboard (a Cloud/ZLEMA Composite)The purpose of this indicator is to provide an easy-to-read binary dashboard of where the current price is relative to key dynamic supports and resistances. The concept is simple, if a dynamic s/r is currently acting as a resistance, the indicator plots a dot above the histogram in the red box. If a dynamic s/r is acting as support, a dot is plotted in the green box below.
There are some additional features, but the dot graphs are king.
_______________________________________________________________________________________________________________
KEY:
_______________________________________________________________________________________________________________
Currently the dynamic s/r's being used in the dot plots are:
Ichimoku Cloud:
Tenkan (blue)
Kijun (pink)
Senkou A (red)
Senkou B (green)
ZLEMA (Zero Lag Exponential Moving Average)
99 ZLEMA (lavender)
200 ZLEMA (salmon)
You'll see a dashed line through the middle of the resistances section (red) and supports section (green). Cloud indicators are plotted above the dashed line, and ZLEMA's are below.
_______________________________________________________________________________________________________________
How it Works - Visual
_______________________________________________________________________________________________________________
As stated in the intro - if a dynamic s/r is currently above the current price and acting as a resistance, the indicator plots a dot above the histogram in the red box. If a dynamic s/r is acting as support, a dot is plotted in the green box below. Additionally, there is an optional histogram (default is on) that will further visualize this relationship. The histogram is a simple summation of the resistances above and the supports below.
Here's a visual to assist with what that means. This chart includes all of those dynamic s/r's in the dynamic dot dashboard (the on-chart parts are individually added, not part of this tool).
You can see that as a dynamic support is lost, the corresponding dot is moved from the supports section at the bottom (green), to the resistances section at the top (red). The opposite being true as resistances are being overtaken (broken resistances are moved to the support section (red)). You can see that the raw chart is just... a mess. Which kinda of accentuates one of the key goals of this indicator: to get all that dynamic support info without a mess of a chart like that.
_______________________________________________________________________________________________________________
How To Use It
_______________________________________________________________________________________________________________
There are a lot of ways to use this information, but the most notable of which is to detect shifts in the market cycle.
For this example, take a look at the dynamic s/r dots in the resistances category (red background). You can see clearly that there are distinctive blocks of high density dots that have clear beginnings and ends. When we transition from a high density of dots to none in resistances, that means we are flipping them as support and entering a bull cycle. On the other hand, when we go from low density of dots as resistances to high density, we're pivoting to a bear cycle. Easy as that, you can quickly detect when market cycles are beginning or ending.
Alternatively, you can add your preferred linear SR's, fibs, etc. to the chart and quickly glance at the dashboard to gauge how dynamic SR's may be contributing to the risk of your trade.
_______________________________________________________________________________________________________________
Who It's For
_______________________________________________________________________________________________________________
New traders: by looking at dot density alone, you can use Dot Dynamics to spot transitionary phases in market cycles.
Experienced traders: keep your charts clean and the information easy to digest.
Developers: I created this originally as a starting point for more complex algos I'm working on. One algo is reading this dot dashboard and taking a position size relative to the s/r's above and below. Another cloud algo is using the results as inputs to spot good setups.
Colored Bars
There is an option (off by default, shown in the headline image above) to fill the bar colors based on how many dynamic s/r's are above or below the current price. This can make things easier for some users, confusing for others. I defaulted them to off as I don't want colors to confuse the primary value proposition of the indicators, which is the dot heat map. You can turn on colored bars in the settings.
One thing to note with the colored bars: they plot the color purely by the dot densities. Random spikes in the gradient colors (i.e. red to lime or green) can be a useful thing to notice, as they commonly occur at places where the price is bouncing between dynamic s/r's and can indicate a paradigm shift in the market cycle.
_______________________________________________________________________________________________________________
Timeframes and Assets
_______________________________________________________________________________________________________________
This can be used effectively on all assets (stocks, crypto, forex, etc) and all time frames. As always with any indicator, the higher TF's are generally respected more than lower TF's.
Thanks for checking it out! I've been trading crypto for years and am just now beginning to publish my ideas, secret-sauce scripts and handy tools (like this one). If you enjoyed this indicator and would like to see more, a like and a follow is greatly appreciated 😁.

Multi Time Frame CandlesHello Traders,
This script can show (upto) 3 candles of another time frames without changing chart time frame realtime . You can choose the time frame and number of candles in the options. You have option to change body and wick colors as well.
in this example number of candles is 2:
You can set body and wick colors:
In this example, weekly candles are shown on 1h chart:
Enjoy!

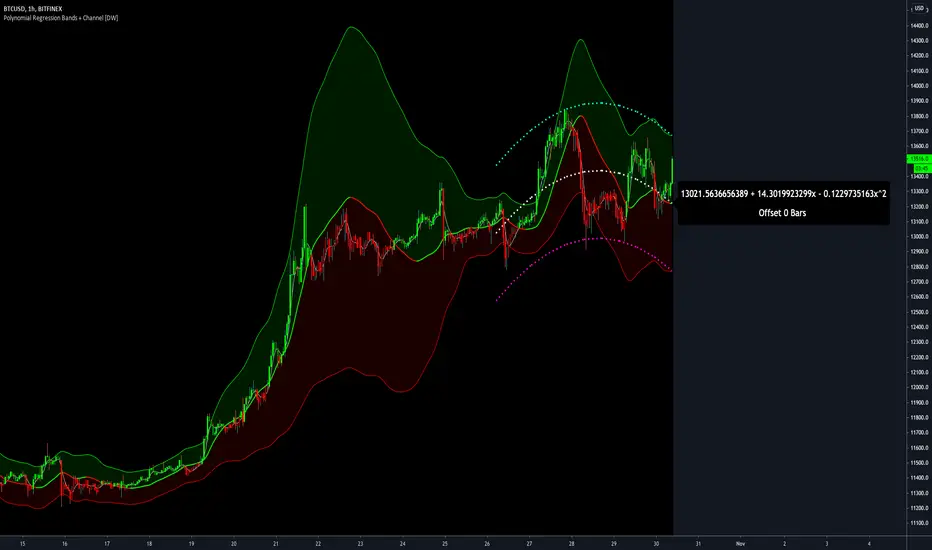
Polynomial Regression Bands + Channel [DW]This is an experimental study designed to calculate polynomial regression for any order polynomial that TV is able to support.
This study aims to educate users on polynomial curve fitting, and the derivation process of Least Squares Moving Averages (LSMAs).
I also designed this study with the intent of showcasing some of the capabilities and potential applications of TV's fantastic new array functions.
Polynomial regression is a form of regression analysis in which the relationship between the independent variable x and the dependent variable y is modeled as a polynomial of nth degree (order).
For clarification, linear regression can also be described as a first order polynomial regression. The process of deriving linear, quadratic, cubic, and higher order polynomial relationships is all the same.
In addition, although deriving a polynomial regression equation results in a nonlinear output, the process of solving for polynomials by least squares is actually a special case of multiple linear regression.
So, just like in multiple linear regression, polynomial regression can be solved in essentially the same way through a system of linear equations.
In this study, you are first given the option to smooth the input data using the 2 pole Super Smoother Filter from John Ehlers.
I chose this specific filter because I find it provides superior smoothing with low lag and fairly clean cutoff. You can, of course, implement your own filter functions to see how they compare if you feel like experimenting.
Filtering noise prior to regression calculation can be useful for providing a more stable estimation since least squares regression can be rather sensitive to noise.
This is especially true on lower sampling lengths and higher degree polynomials since the regression output becomes more "overfit" to the sample data.
Next, data arrays are populated for the x-axis and y-axis values. These are the main datasets utilized in the rest of the calculations.
To keep the calculations more numerically stable for higher periods and orders, the x array is filled with integers 1 through the sampling period rather than using current bar numbers.
This process can be thought of as shifting the origin of the x-axis as new data emerges.
This keeps the axis values significantly lower than the 10k+ bar values, thus maintaining more numerical stability at higher orders and sample lengths.
The data arrays are then used to create a pseudo 2D matrix of x power sums, and a vector of x power*y sums.
These matrices are a representation the system of equations that need to be solved in order to find the regression coefficients.
Below, you'll see some examples of the pattern of equations used to solve for our coefficients represented in augmented matrix form.
For example, the augmented matrix for the system equations required to solve a second order (quadratic) polynomial regression by least squares is formed like this:
(∑x^0 ∑x^1 ∑x^2 | ∑(x^0)y)
(∑x^1 ∑x^2 ∑x^3 | ∑(x^1)y)
(∑x^2 ∑x^3 ∑x^4 | ∑(x^2)y)
The augmented matrix for the third order (cubic) system is formed like this:
(∑x^0 ∑x^1 ∑x^2 ∑x^3 | ∑(x^0)y)
(∑x^1 ∑x^2 ∑x^3 ∑x^4 | ∑(x^1)y)
(∑x^2 ∑x^3 ∑x^4 ∑x^5 | ∑(x^2)y)
(∑x^3 ∑x^4 ∑x^5 ∑x^6 | ∑(x^3)y)
This pattern continues for any n ordered polynomial regression, in which the coefficient matrix is a n + 1 wide square matrix with the last term being ∑x^2n, and the last term of the result vector being ∑(x^n)y.
Thanks to this pattern, it's rather convenient to solve the for our regression coefficients of any nth degree polynomial by a number of different methods.
In this script, I utilize a process known as LU Decomposition to solve for the regression coefficients.
Lower-upper (LU) Decomposition is a neat form of matrix manipulation that expresses a 2D matrix as the product of lower and upper triangular matrices.
This decomposition method is incredibly handy for solving systems of equations, calculating determinants, and inverting matrices.
For a linear system Ax=b, where A is our coefficient matrix, x is our vector of unknowns, and b is our vector of results, LU Decomposition turns our system into LUx=b.
We can then factor this into two separate matrix equations and solve the system using these two simple steps:
1. Solve Ly=b for y, where y is a new vector of unknowns that satisfies the equation, using forward substitution.
2. Solve Ux=y for x using backward substitution. This gives us the values of our original unknowns - in this case, the coefficients for our regression equation.
After solving for the regression coefficients, the values are then plugged into our regression equation:
Y = a0 + a1*x + a1*x^2 + ... + an*x^n, where a() is the ()th coefficient in ascending order and n is the polynomial degree.
From here, an array of curve values for the period based on the current equation is populated, and standard deviation is added to and subtracted from the equation to calculate the channel high and low levels.
The calculated curve values can also be shifted to the left or right using the "Regression Offset" input
Changing the offset parameter will move the curve left for negative values, and right for positive values.
This offset parameter shifts the curve points within our window while using the same equation, allowing you to use offset datapoints on the regression curve to calculate the LSMA and bands.
The curve and channel's appearance is optionally approximated using Pine's v4 line tools to draw segments.
Since there is a limitation on how many lines can be displayed per script, each curve consists of 10 segments with lengths determined by a user defined step size. In total, there are 30 lines displayed at once when active.
By default, the step size is 10, meaning each segment is 10 bars long. This is because the default sampling period is 100, so this step size will show the approximate curve for the entire period.
When adjusting your sampling period, be sure to adjust your step size accordingly when curve drawing is active if you want to see the full approximate curve for the period.
Note that when you have a larger step size, you will see more seemingly "sharp" turning points on the polynomial curve, especially on higher degree polynomials.
The polynomial functions that are calculated are continuous and differentiable across all points. The perceived sharpness is simply due to our limitation on available lines to draw them.
The approximate channel drawings also come equipped with style inputs, so you can control the type, color, and width of the regression, channel high, and channel low curves.
I also included an input to determine if the curves are updated continuously, or only upon the closing of a bar for reduced runtime demands. More about why this is important in the notes below.
For additional reference, I also included the option to display the current regression equation.
This allows you to easily track the polynomial function you're using, and to confirm that the polynomial is properly supported within Pine.
There are some cases that aren't supported properly due to Pine's limitations. More about this in the notes on the bottom.
In addition, I included a line of text beneath the equation to indicate how many bars left or right the calculated curve data is currently shifted.
The display label comes equipped with style editing inputs, so you can control the size, background color, and text color of the equation display.
The Polynomial LSMA, high band, and low band in this script are generated by tracking the current endpoints of the regression, channel high, and channel low curves respectively.
The output of these bands is similar in nature to Bollinger Bands, but with an obviously different derivation process.
By displaying the LSMA and bands in tandem with the polynomial channel, it's easy to visualize how LSMAs are derived, and how the process that goes into them is drastically different from a typical moving average.
The main difference between LSMA and other MAs is that LSMA is showing the value of the regression curve on the current bar, which is the result of a modelled relationship between x and the expected value of y.
With other MA / filter types, they are typically just averaging or frequency filtering the samples. This is an important distinction in interpretation. However, both can be applied similarly when trading.
An important distinction with the LSMA in this script is that since we can model higher degree polynomial relationships, the LSMA here is not limited to only linear as it is in TV's built in LSMA.
Bar colors are also included in this script. The color scheme is based on disparity between source and the LSMA.
This script is a great study for educating yourself on the process that goes into polynomial regression, as well as one of the many processes computers utilize to solve systems of equations.
Also, the Polynomial LSMA and bands are great components to try implementing into your own analysis setup.
I hope you all enjoy it!
--------------------------------------------------------
NOTES:
- Even though the algorithm used in this script can be implemented to find any order polynomial relationship, TV has a limit on the significant figures for its floating point outputs.
This means that as you increase your sampling period and / or polynomial order, some higher order coefficients will be output as 0 due to floating point round-off.
There is currently no viable workaround for this issue since there isn't a way to calculate more significant figures than the limit.
However, in my humble opinion, fitting a polynomial higher than cubic to most time series data is "overkill" due to bias-variance tradeoff.
Although, this tradeoff is also dependent on the sampling period. Keep that in mind. A good rule of thumb is to aim for a nice "middle ground" between bias and variance.
If TV ever chooses to expand its significant figure limits, then it will be possible to accurately calculate even higher order polynomials and periods if you feel the desire to do so.
To test if your polynomial is properly supported within Pine's constraints, check the equation label.
If you see a coefficient value of 0 in front of any of the x values, reduce your period and / or polynomial order.
- Although this algorithm has less computational complexity than most other linear system solving methods, this script itself can still be rather demanding on runtime resources - especially when drawing the curves.
In the event you find your current configuration is throwing back an error saying that the calculation takes too long, there are a few things you can try:
-> Refresh your chart or hide and unhide the indicator.
The runtime environment on TV is very dynamic and the allocation of available memory varies with collective server usage.
By refreshing, you can often get it to process since you're basically just waiting for your allotment to increase. This method works well in a lot of cases.
-> Change the curve update frequency to "Close Only".
If you've tried refreshing multiple times and still have the error, your configuration may simply be too demanding of resources.
v4 drawing objects, most notably lines, can be highly taxing on the servers. That's why Pine has a limit on how many can be displayed in the first place.
By limiting the curve updates to only bar closes, this will significantly reduce the runtime needs of the lines since they will only be calculated once per bar.
Note that doing this will only limit the visual output of the curve segments. It has no impact on regression calculation, equation display, or LSMA and band displays.
-> Uncheck the display boxes for the drawing objects.
If you still have troubles after trying the above options, then simply stop displaying the curve - unless it's important to you.
As I mentioned, v4 drawing objects can be rather resource intensive. So a simple fix that often works when other things fail is to just stop them from being displayed.
-> Reduce sampling period, polynomial order, or curve drawing step size.
If you're having runtime errors and don't want to sacrifice the curve drawings, then you'll need to reduce the calculation complexity.
If you're using a large sampling period, or high order polynomial, the operational complexity becomes significantly higher than lower periods and orders.
When you have larger step sizes, more historical referencing is used for x-axis locations, which does have an impact as well.
By reducing these parameters, the runtime issue will often be solved.
Another important detail to note with this is that you may have configurations that work just fine in real time, but struggle to load properly in replay mode.
This is because the replay framework also requires its own allotment of runtime, so that must be taken into consideration as well.
- Please note that the line and label objects are reprinted as new data emerges. That's simply the nature of drawing objects vs standard plots.
I do not recommend or endorse basing your trading decisions based on the drawn curve. That component is merely to serve as a visual reference of the current polynomial relationship.
No repainting occurs with the Polynomial LSMA and bands though. Once the bar is closed, that bar's calculated values are set.
So when using the LSMA and bands for trading purposes, you can rest easy knowing that history won't change on you when you come back to view them.
- For those who intend on utilizing or modifying the functions and calculations in this script for their own scripts, I included debug dialogues in the script for all of the arrays to make the process easier.
To use the debugs, see the "Debugs" section at the bottom. All dialogues are commented out by default.
The debugs are displayed using label objects. By default, I have them all located to the right of current price.
If you wish to display multiple debugs at once, it will be up to you to decide on display locations at your leisure.
When using the debugs, I recommend commenting out the other drawing objects (or even all plots) in the script to prevent runtime issues and overlapping displays.
Relative Currency StrengthThis indicator shows the relative strength of the majors and crosses compared to each other. So, if you are taking a EURUSD long, are you taking it because the Euro is strong or the USD is weak or both? How do you know? This indicator will show you how strong a current is compared to the other majors and crosses. So in the EURUSD example, you will know how strong the EUR is compared to NZD, AUD, JPY, CHF, GBP, CAD and USD and how strong the USD is compared to the NZD, AUD, JPY, CHF, EUR, GBP and CAD. You can then make an informed choice as to whether the trade makes sense.
Notice in the examples below how the indicator clearly shows how CHF was weak all day and GBP was strong in the morning but then collapsed in the afternoon.
The indicator functions by taking a set point in the day and comparing how price compares to it for the rest of the day. I set it to Europe open and then take context of how a currency is comparing to that price (verses the other currencies) over the course of the day.
You can use the indicator in 2 ways - you set a currency as a baseline and see how other currencies fluctuate about it or you can see how all the currencies strengths compare to each other.
If you have the full tradingview membership you can have 8 screens and see how each currency compares. if you set the indicator to automatic it will automatically default to the base currency that you compare to OANDA gold.
The general strength is useful as a general overview as to where strength and weakness is in the charts. It works by using gold as the baseline which is a reliable way to compare strengths.
REMEMBER, THIS GIVES SUMMARY DATA. USE IT TO GET MARKET CONTEXT IN ORDER TO IDENTIFY WHERE STRENGTH AND WEAKNESS IS - YOU CANT JUST TRADE FROM IT. It's extremely useful in fast moving markets to easily stay aware of what is happening.
