[RS]Support Resistance and FractureEXPERIMENTAL: Inverted slope of SR pivots to mark the fracture point of slope.Pine Script®指标由RicardoSantos提供已更新 1111598
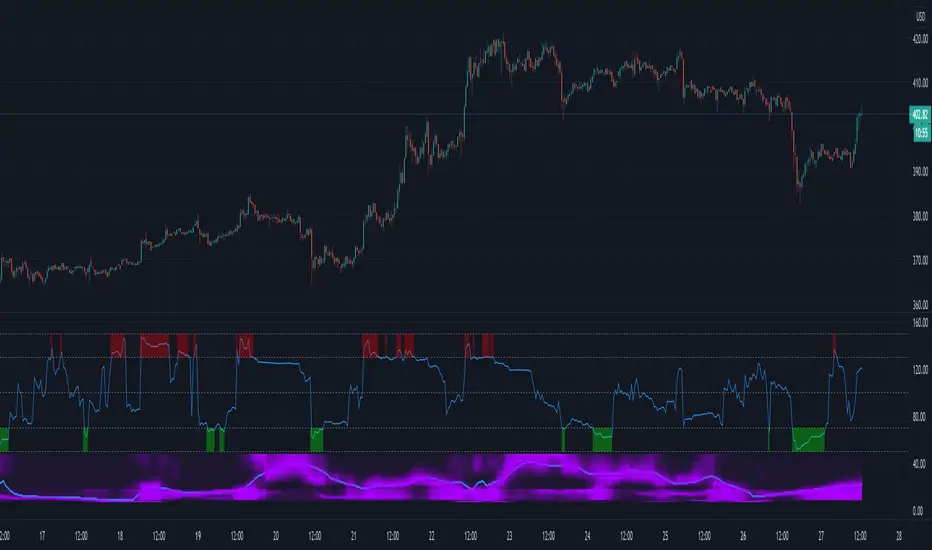
[RS]Short vs. Long VolatilityExperimental: Short term vs long term volatility percentPine Script®指标由RicardoSantos提供22248
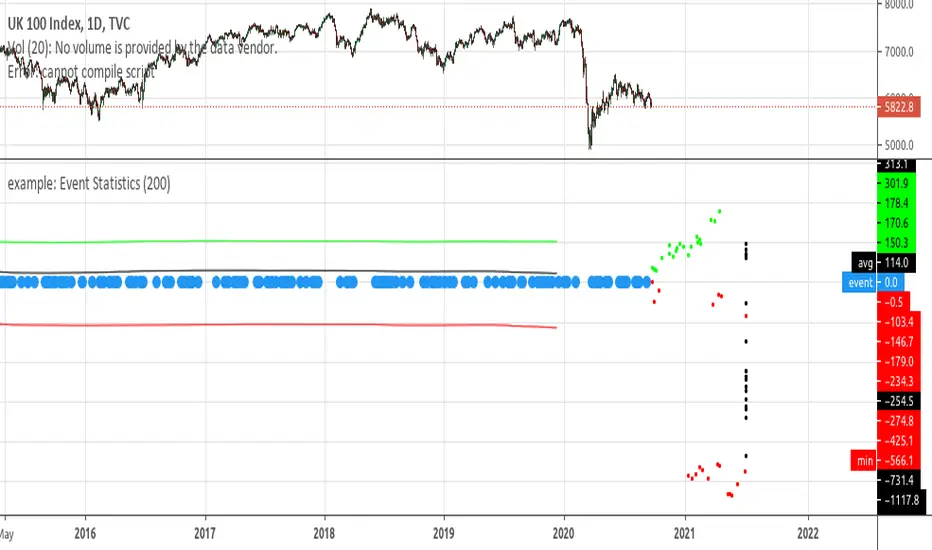
example: Event StatisticsEXPERIMENTAL: A example on how to retrieve statistics from a recurring event. Can be used to optimized strategy's, trade parameters, etc..Pine Script®指标由RicardoSantos提供44113
Ehler's Autocorrelation Periodogram - RSI/MFIWarning! Frequently hits the execution time limit for scripts. Especially on initially adding to your chart. Often requires toggling show/hide indicator to get it to complete script execution within the time limit. YMMV! From TASC Sept 2016 this is Ehler's Autocorrelation periodogram. A means of determining the dominant cycle ("ideal" indicator length / dynamic length). As an example it's applied here to RSI or MFI. Lower indicator segment displays the autocorrelation spectrum and the computed dominant cycle. Upper segment is RSI/MFI.Pine Script®指标由rumpypumpydumpy提供已更新 1111286
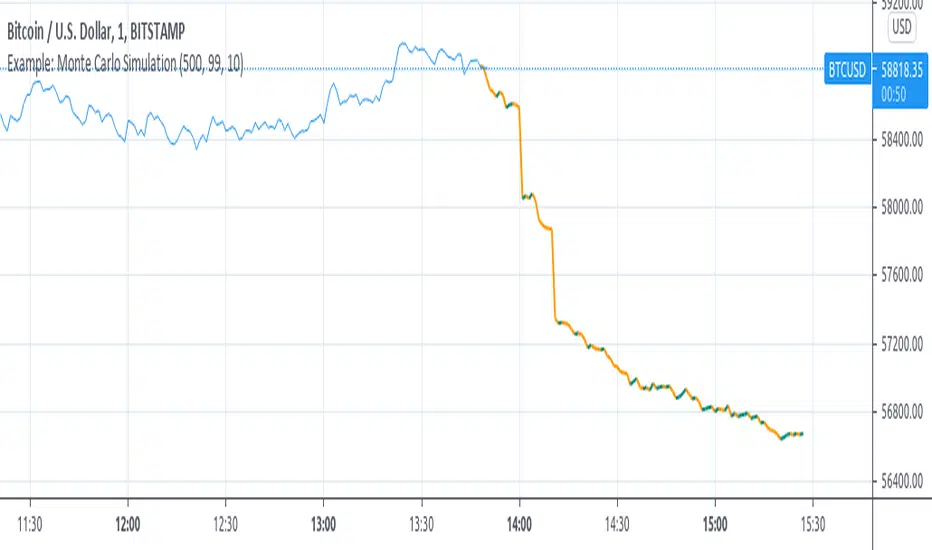
Example: Monte Carlo SimulationExperimental: Example execution of Monte Carlo Simulation applied to the markets(this is my interpretation of the algo so inconsistencys may appear). note: the algorithm is very demanding so performance is limited. Pine Script®指标由RicardoSantos提供已更新 4141 1.3 K
Function Polynomial RegressionDescription: A function that returns a polynomial regression and deviation information for a data set. Inputs: _X: Array containing x data points. _Y: Array containing y data points. Outputs: _predictions: Array with adjusted _Y values. _max_dev: Max deviation from the mean. _min_dev: Min deviation from the mean. _stdev/_sizeX: Average deviation from the mean. Resources: en.wikipedia.org rosettacode.orgPine Script®指标由RicardoSantos提供已更新 5959 2.8 K
Function - Linear RegressionDescription: A Function that returns a linear regression channel using (X,Y) vector points. Inputs: _X: Array containing x data points.¹ _Y: Array containing y data points.¹ Note: ¹: _X and _Y size must match. Outputs: _predictions: Array with adjusted _Y values at _X. _max_dev: Max deviation from the mean. _min_dev: Min deviation from the mean. _stdev/_sizeX: Average deviation from the mean. Resources: www.statisticshowto.com en.wikipedia.orgPine Script®指标由RicardoSantos提供已更新 88744
Function K-Means ClusteringDescription: A Function that returns cluster centers for given data (X,Y) vector points. Inputs: _X: Array containing x data points.¹ _Y: Array containing y data points.¹ _number_of_clusters: number of clusters. Note: ¹: _X and _Y size must match. Outputs: _centers_x: Array containing x data points. _centers_y: Array containing y data points. Resources: rosettacode.org en.wikipedia.orgPine Script®指标由RicardoSantos提供已更新 1515173
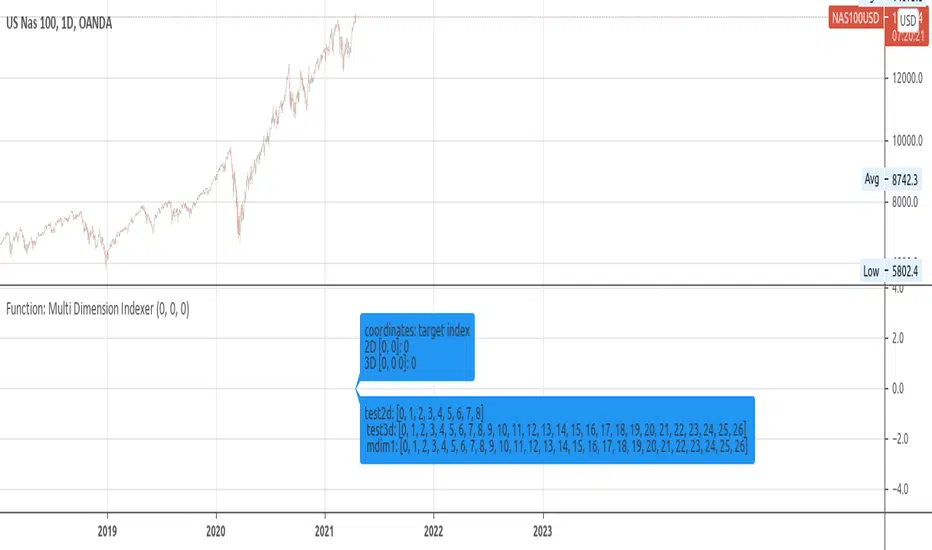
Function: Multi Dimension IndexerDescription: A Function that returns the flat index of a N dimensions array. Inputs: _indices: Array containing dimension indices.¹ _limits: Array containing dimension size.¹ Note: ¹: _indices and _limits size must match. indices must be within dimension size. Outputs: _offset: the flat 1D index. Resources: eli.thegreenplace.netPine Script®指标由RicardoSantos提供已更新 28
Example: Graph style - 4th Dimension RSIEXPERIMENTAL: Drawing RSI in the 4th dimension(time). It shows the fluctuations of the RSI and price change over a period of time(10) in a scatter like graph. there is a inversion of axis to make possible graphing the 2 properties.Pine Script®指标由RicardoSantos提供1919483
Anchored Exponential VWAP & DeviationsExponential version of my anchored VWAP found here : Pine Script®指标由rumpypumpydumpy提供33311
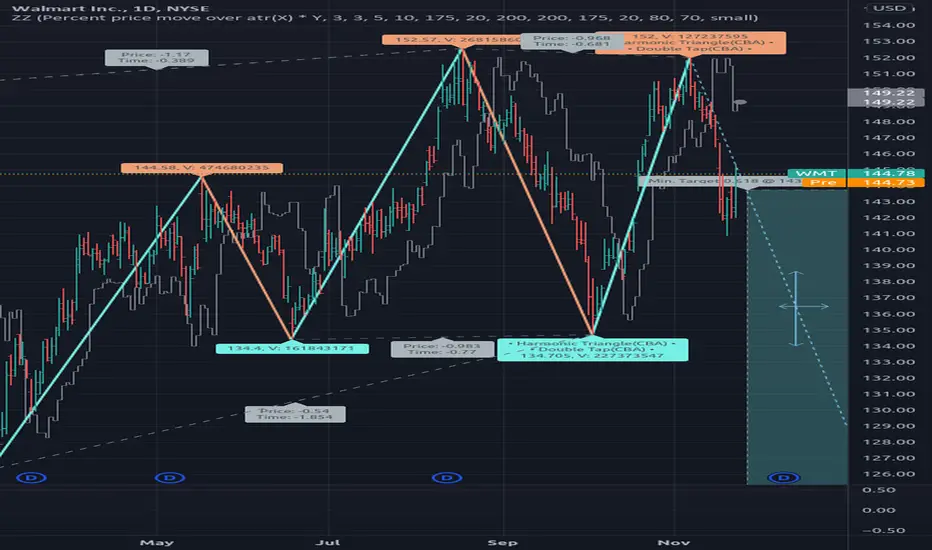
[RS]ZigZag Multiple Methods - Forecast - patterns - labelsexperimental: zigzag indicator with all the zigzag methods that im aware of(that matter atleast), theres something for all tastes there :P this will be the basis for zigzag tools i make in the future. note: some zigzags REPAINT.Pine Script®指标由RicardoSantos提供已更新 6666 6.5 K
[RS]JMA Modified RSI RSI modified with Jurik's ma as a center point of difference. -added optional calculation to simulate rsi with x length at certain timeframes. -added optional barcolor. Pine Script®指标由RicardoSantos提供已更新 1212917
Momentum Acceleration by DGTItalian physicist Galileo Galilei is usually credited with being the first to measure speed by considering the distance covered and the time it takes. Galileo defined speed as the distance covered during a period of time. In equation form, that is v = Δd / Δt where v is speed, Δd is change in distance, and Δt is change in time. The Greek symbol for delta, a triangle (Δ), means change. Is the speed getting faster or slower? Acceleration will be the answer, acceleration is defined as the rate of change of speed over a set period of time, meaning something is getting faster or slower. Mathematically expressed, acceleration denoted as a is a = Δv / Δt , where Δv is the change in speed and Δt is the change in time. How to apply in trading Lets think about Momentum, Rate of Return, Rate of Change all are calculated in almost same approach with Speed Momentum measures change in price over a specified time period, Rate of Change measures percent change in price over a specified time period, Rate of Return measures the net gain or loss over a specified time period, And Speed measures change in distance over a specified time period So we may state that measuring the change in distance is also measuring the change in price over a specified time period which is length, hence speed can be calculated as (source – source )/length and acceleration becomes (speed – speed )/length In this study acceleration is used as signal line and result plotted as arrows demonstrating bull or bear direction where direction changes can be considered as trading setups Just a little fun, since we deal with speed the short name of the study is named after famous cartoon character Speedy Gonzales Trading success is all about following your trading strategy and the indicators should fit within your trading strategy, and not to be traded upon solely Disclaimer: The script is for informational and educational purposes only. Use of the script does not constitutes professional and/or financial advice. You alone the sole responsibility of evaluating the script output and risks associated with the use of the script. In exchange for using the script, you agree not to hold dgtrd TradingView user liable for any possible claim for damages arising from any decision you make based on use of the script Pine Script®指标由dgtrd提供已更新 133133 5.4 K
[RS]Simple Forecast - Keltner WormsEXPERIMENTAL: Using keltner channels with automatic multiplier finding, offsets and show_last cutoffs to generate a forecast area. video showing why its named keltner worms :p.. streamable.comPine Script®指标由RicardoSantos提供1010898
[RS]Detrended Percent Price Over Average on RangeExperimental: Detrended Price oscillator from price against the average inside the range.Pine Script®指标由RicardoSantos提供已更新 33301
[RS]predict player directionExperimental: adapted from classical game movement prediction algo and how a crude recursive error classifier can be applied..Pine Script®指标由RicardoSantos提供66340
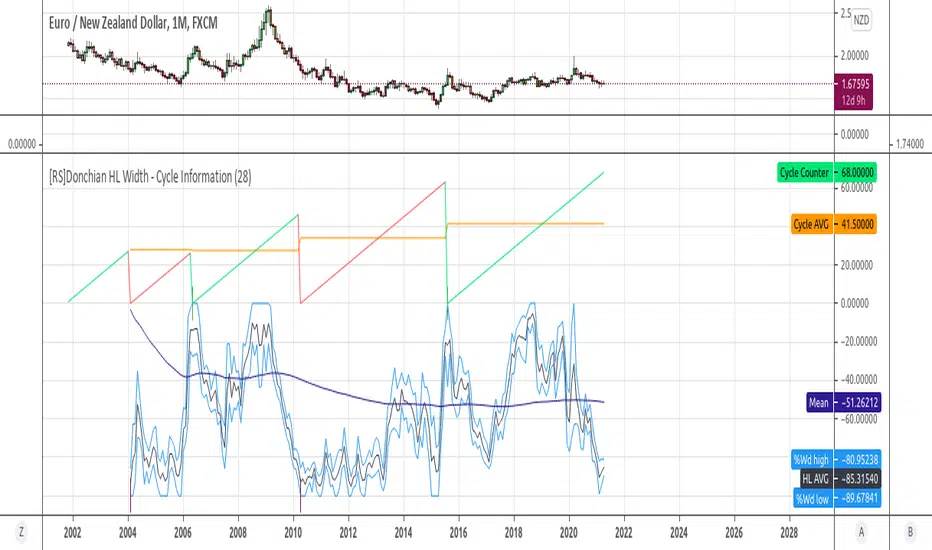
[RS]Donchian HL Width - Cycle InformationExperimental: some information on cyclical new peaks using Donchian Channel % Widths.Pine Script®指标由RicardoSantos提供已更新 1919798
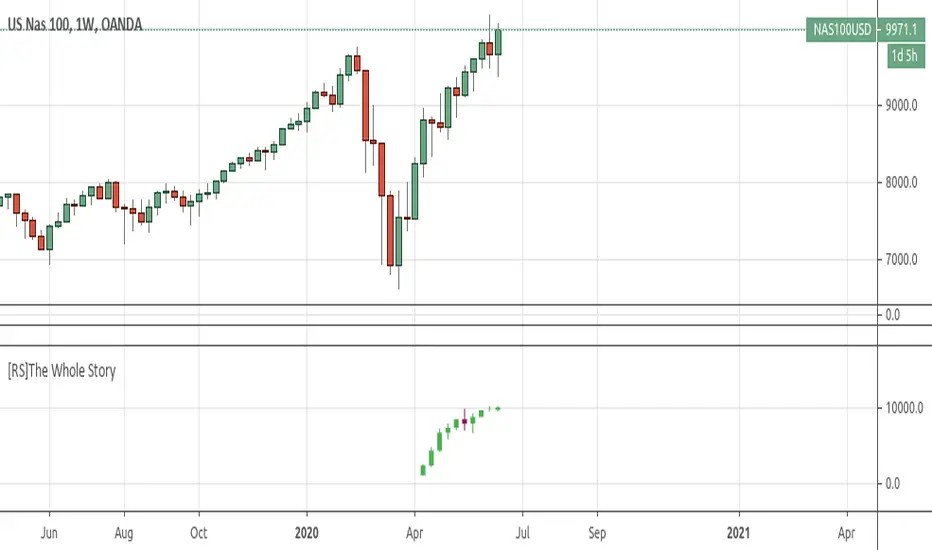
[RS]The Whole StoryEXPERIMENTAL: creates 10 candles to represent the whole historical action by spliting it in segments with close at 1/2, 3/4, 7/8 ... of bar count. optional label for stats. issues: -> if N of bars in history is too long you may need to load it through the replay function. -> if N of bars in history is too short last candles may repeat, or show bad data.Pine Script®指标由RicardoSantos提供99254
[RS]Cyclic Interval Average PriceEXPERIMENTAL: Cyclic interval price averaging at every x bars. Lines for trend line and intra trend slope(not working as intended).Pine Script®指标由RicardoSantos提供已更新 99375
[RS]Shotgun ForecastsExperimental: its a play at linear forecasting. use replay feature to see it in action: streamable.comPine Script®指标由RicardoSantos提供已更新 88644
Function - Logistic EquationEXPERIMENTAL: the logistic equation and the market.. :)..Pine Script®指标由RicardoSantos提供1414777
Example - How to create multiple level gridsExample on how to create custom grids with variable N lines/labels:Pine Script®指标由RicardoSantos提供已更新 88356