Shaded Tripple MAsThree moving averages that have shaded area between its sma and ema versions. Default lengths are 50, 100 and 200.
Exponentialmovingaverages

Custom Multi-Timeframe Screener with AlertsThis is a multi-timeframe screener with alerts. Use this way you can create a screener on indicators using 2 or more timeframes.
In TradingView there is a limit of 40 security function calls. Every timeframe requires another security call so you can screen fewer symbols with any additional timeframe.
In this example, I use 2 timeframes, so the maximum amount of symbols you can scan is 40/2 = 20.
For 3 timeframes - 13, 4tfs - 10, 5tfs - 8 symbols and so on.
In this simplistic example, I require a cross of EMAs on the current timeframe and confirmation that one EMA above/below another from the second timeframe.
Of course, you can create much more complicated functions for this screener.
Params
- higher timeframe
- ema params
- 20 symbol inputs for instruments you want to use in this screener
Alerts
You can create an alert from it easily by selecting the screener name from the list and then selecting "Any alert() function call".
No additional configuration is required, message and alert on close is generated in the code.
You should better change the default name for your alert. Sometimes because of big amount of inputs you might receive an error.
Disclaimer
Please remember that past performance may not be indicative of future results.
Due to various factors, including changing market conditions, the strategy may no longer perform as good as in historical backtesting.
This post and the script don’t provide any financial advice.

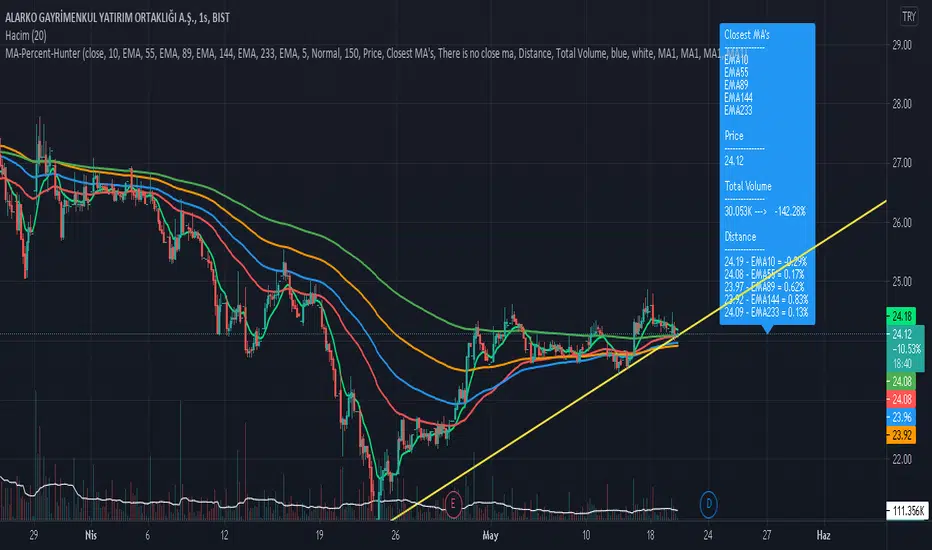
Moving Average Percentage Hunter by HassonyaIn this indicator study, we aim to capture the moving averages to which the bar close is closest. The indicator shows the moving averages, which are closest to the percentage value we selected, on the label. It indicates the names of the closest averages at the top of the label with a (near) note next to them. If none of the averages are close to the specified percentage value, there will be a no nearness warning. The indicator supports the heikin ashi candles. For this setting, check the I'm using heikin ashi candles box.
Thanks to this feature of the indicator, you will be able to see bar proximity to the moving averages you use continuously. You can make purchases and sales by using this feature to your advantage. This way you can easily catch reaction turns.
If you want, you can turn off moving averages in the settings section. You can open it whenever you need. You can do this in the show moving averages box. Appears if you check it, disappears if you uncheck it.
There are 5 moving average options. SMA, EMA, WMA, TMA and HullMA moving averages. Moving average names and values in the list are dynamically adjusted. When you change the settings, the moving average names and values in the list will change automatically. At the bottom of the settings, you can determine the lengths of the moving averages yourself. In the next update, each moving average will have a different average option.
You can enter percentage values, fractional figures. for example (3.5, 5.2 vb.) The indicator will show you the value you give and the proximity of the value below that value. You can adjust this setting in MA Percentage Nearness.
More detailed options will be available in the next update. Range of values, options below, above, and so on.
In the settings section, there is a Show distance option. If you check this option, you can continuously see the percentage values of the distance to the moving averages on the label. For this feature, you have to check the show distance box.
The alarm feature will come in the next update.
Thanks for support. Good Luck.
MA-SS ( EMA SSL ) Indicator StudyThe MA-SS Indicator is a simple yet effective indicator using a combination of EMAs and SSL channel, utilising higher time frame data to help confirm trend/ price direction.
How does it work?
The Indicator consists of;
- 3 x EMAs – The 3rd EMA being a filter EMA
- Multi Time Frame EMA (This is an additional filter EMA which can be switched on and off)
- Multi Time Frame SSL Channel (This acts as a filter and can also be switched on and off)
The concept initially began as a simple EMA crossing indicator, but adding an MTF EMA plus a MTF SSL channel for additional filtering, helped to give a better indication of trend and ultimately filter out several bad trades.
- EXAMPLE: If price is …
o below the MTF EMA filter
o The MTF SSL Channel is red
o White and blue EMAs cross below the yellow (filter) EMA in the red SSL channel
> …a short is fired!
- (Opposite scenario for longs)
- Your stop loss would ideally be the top/ bottom of the SSL channel (either the MTF SSL channel or a standard SSL channel added manually to the chart), or, go for a clear pivot point or support/ resistance level.
- Take profit is yours to decide but I opt for a 1:1.5 risk/reward ratio. You could also use the MTF SSL channel to gauge when you should exit your trade (i.e. if you're in a long, wait for the SSL channel to flip red).
I will also have a strategy script available for this indicator.
Any questions please fire away in the comments.

Custom WaterMark + 4EMA [SilentKreator]4 Ema + Custom Watermark, you can customize everything, in the watermark you can write your name, is a tool to visually protect your work, mainly for streamers and analysts.

Bank Heist ( Matrix 5 EMA With Delorean Indicator Alerts )Bank Heist ( Market Maker / Matrix 5 EMA With Delorean Indicator Alerts )
Welcome to the "Bank Heist" Indicator
This indicator is based on one strategy that many many individuals and companies have tried to label as their own, brand it, and resell it. The names of these companies will be listed below as to not "steal" the strategy from the people trying to brand EMA's and also to help those using keyword searches (based on the many hot terms coined over the years) to find this indicator. I personally have decided to add to the confusion and call it the "Bank Heist" so as to not appear to be "stealing" someone elses name for free indicators 😊
The Strategy
Simple:
The EMA's are below price, look for buys. EMA's above price, look for sells.
The 50 EMA is ALWAYS market equilibrium
Intermediate:
5 EMA Crossing Up 13 EMA With The 50 EMA Under everything = Buy
5 EMA Crossing Down 13 EMA with 50 EMA Above everything = Sell
The 50 EMA is ALWAYS market equilibrium
Advanced:
Simple+Intermediate
The higher period the EMA , the Longer the trend.
All time frames must pull back to ALL EMA's at some point during the trend
🤯 Each EMA is one period different, one time frame up or down (Example: The 13 EMA on the 15m chart is the same as the 5 EMA on the 1hr Chart)
🔑 If you don't understand this and/or want to study it further then mark each EMA on the 15m chart, then move up one time frame at a time all the way to the daily chart.
🧙♂️ After it "clicks" , just remember that price must always pull back to all EMA's on all time frames, The 50 EMA is ALWAYS market equilibrium
Delorean Indicator Alerts:
Set alarms on TradingView with this indicator!
For those who don't know what this is:
Two candles cutting through the 13 ema, second candle bigger, trade in the direction of the trend.
Special Notes:
The 50 EMA is ALWAYS market equilibrium
The Highly Skilled Will See How To Get The Worlds Tightest Stop Loss
THIS WORKS ON ALL TIME FRAMES (Yes, 1 minute throught 1 year)
THIS WORKS ON ANY FINANCIAL INSTRUMENT
You Can Also Set Alerts For The EMA's Crossing ( 5 EMA Crossing 13 EMA , ETC.)
🔮 Study These, You Cant Make This Up 🔮
Famous Trading System Names That Got You Here
Ordered from true original to most recent "creators" in chronological order
FXPX
Matrix
Matrix Trading System
Matrix 5 EMA
5 EMA
5 EMA's
Market Maker
MarketMaker
Delorean
Delorean Indicator
Delorean Strategy
IM Academy
Bank Heist (Free & Condensed TradingView Indicator)
DISCLAIMER
THIS IS NOT FINANCIAL OR INVESTMENT ADVICE AND SHOULD NOT BE INTERPRETED AS SUCH.
Trading foreign exchange on margin carries a high level of risk, and may not be suitable for all investors. Past performance is not indicative of future results. The high degree of leverage can work against you as well as for you. Before deciding to invest in foreign exchange you should carefully consider your investment objectives, level of experience, and risk appetite. The possibility exists that you could sustain a loss of some or all of your initial investment and therefore you should not invest money that you cannot afford to lose. You should be aware of all the risks associated with foreign exchange trading, and seek advice from an independent financial advisor if you have any doubts.

Background Color Based on EMAHello Traders,
this is a very simple script. It paints the background color based on the close price in reference to an exponential moving average.
If the close is above the EMA the background color will be green.
If the close is under the EMA the background color will be red.
You can adjust colors and the EMA period by yourself.
This little indicator script is just to get a better overview, for example in combination with other indicators.
Hope you guys like this script. Wish you a great trading week.

RR 3Software signal with a combination of Moving Average, Exponential Average, Hull Average, Volume weighted best combined with RR 1 & 2
NOTE: RR 3 is in beta Stage will update it once it is Final
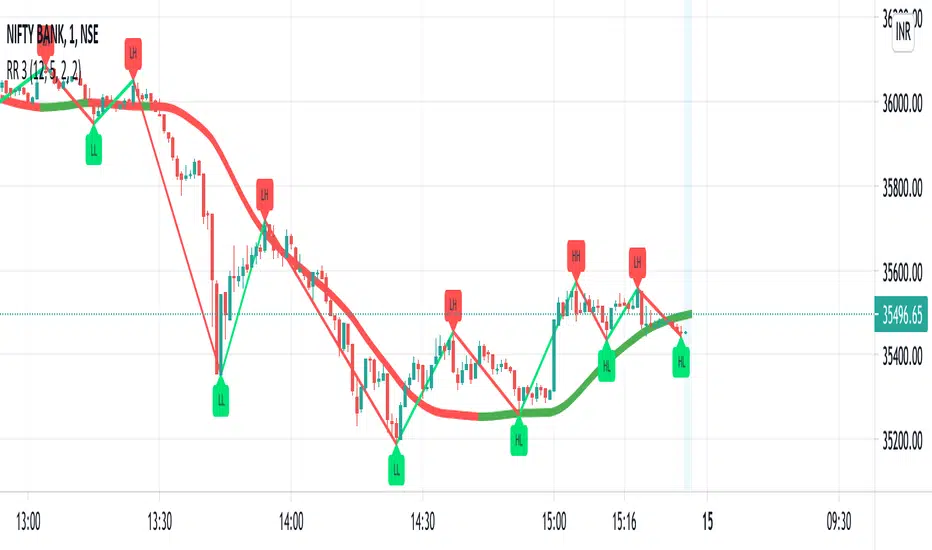
Buy/Sell/Hold/Away? This script based on Simple Moving Average and Exponential Moving Average.
The Red Line is an exponential moving average with small length. It act as a main line.
The Black Line is an average of some past data of exponential moving average. Act as Trend Line
The green circles is an exponential moving average with medium length. It act as a signal line.
The Idea is, when the price move higher from it past,past,past, repeatedly in some duration, it will gain enough energy to fly to the highest.
Buy signal when red line cross down green circle. strong buy when red line cross down black line.
Sell signal when red line cross down green circle. strong buy when red line cross down black line.
Additional 1:
Triangle up(blue) indicate Buy Signal. it happen when the price break resistant with some condition and volume>1m
Triangle down(maroon) indicate Sell Signal. it happen when the price break support with some condition and volume>1m
The more triangle show in series, the strong the trend to move accordingly.
Additional 2:
Support and Resistance line.
Hope Benefit To You All.

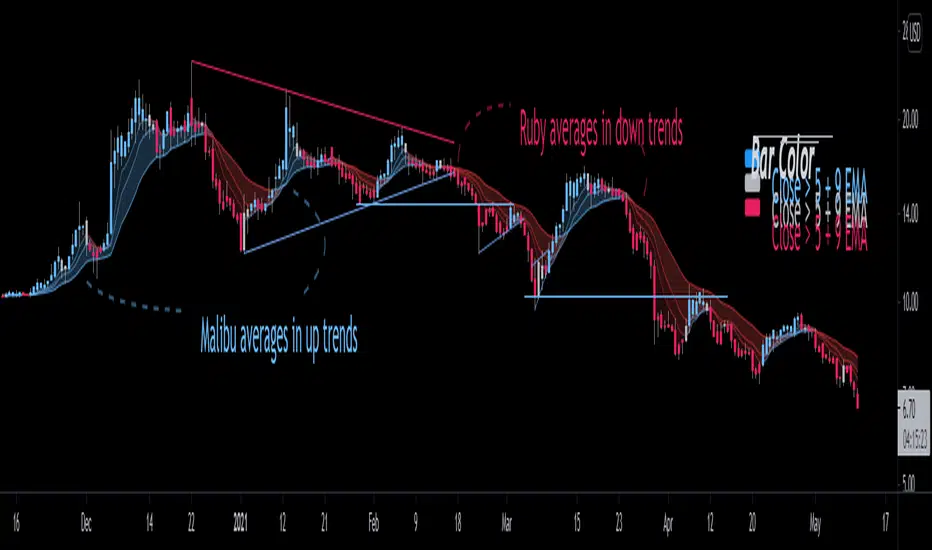
Bjorgum EMAThis is an answer back to repeated requests for a simple version of Bjorgum Triple EMA Strat, which is not recommended for use with Heiken Ashi candles as it results in "double smoothing" of the averages and can give late signals as a result.
The inputs are raw and super basic. At its core its really just 3 EMAs that you can customize the source and length. The averages and shadowing change color based on if they are either rising or falling.
default values are 5, 9, and 21 EMA on open as source.
Bar color is dictated by the bar close over or under the 5 and 9 EMA.
This is suitable for use on HA candle.
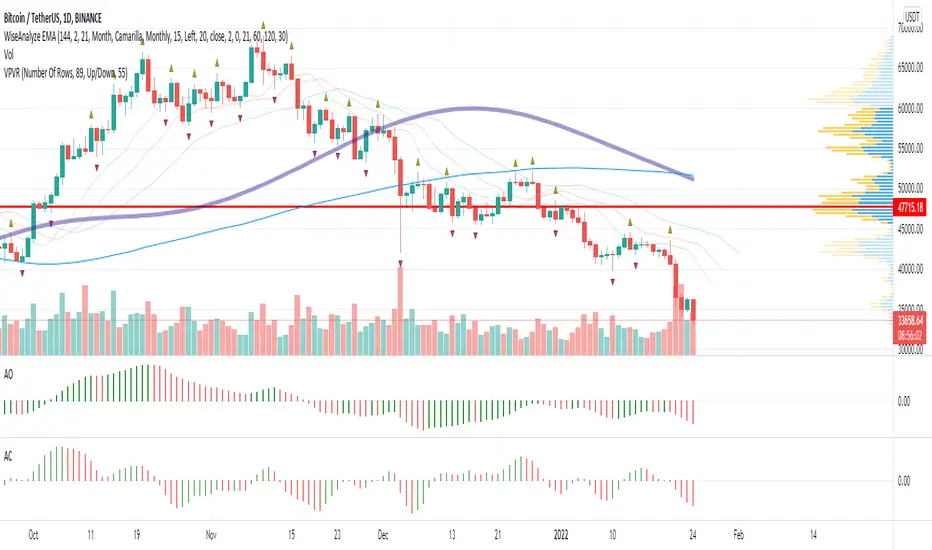
WiseAnalyze EMA + fractalsCombination of exponential moving averages allow to spot the trend reversal and expansion, Bill Williams fractals and support resistance zones allow to trade without drawing anything. Just follow the trend.
Study your chart. Note which EMA act as support and bounce most of tests. Most often I use 21/34 EMA for new entries.
Most powerful trend indicator is MAWV. Don't try to trade against it. If price above go long. If below - short.
Stops should be placed behind fractals. Breakout entries on price crossing fractals.
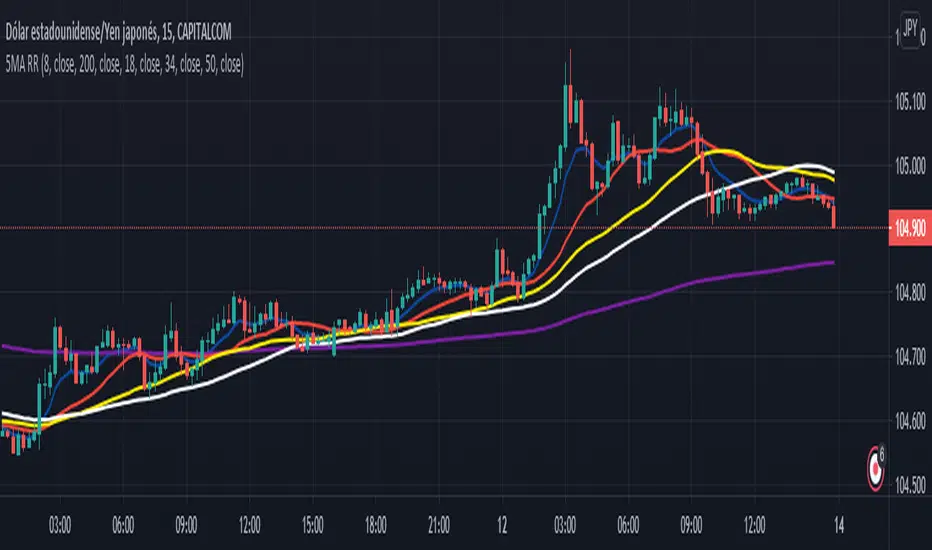
5 MOVING AVERAGES BY dobleRThis Script show 5 Moving Averages at closing price.
Este script muestra 5 Medias Moviles al precio de cierre.
Blue EMA = 8
Purple EMA = 200
Red MA = 18
Yellow MA = 34
White MA = 50
Rainbow Trend IndicatorThis is an indicator based on the MA rainbow concept. It is possible to choose between 15 or 20 MA's and if all 15 MA's is picked, the calculation will be calculated on 15 MA's and if 20 is picked the calculation is calculated on 20 MA's. The indicator will then be a line which is assigned a value from the calculation based on the MA's. If the line is above the dashed zero line, meaning the line's last value is a positive value, the price is in a uptrend and if the line is below the dashed zero line, meaning the line's last value is a negative value, the price is in a downtrend.
In short
If the line is green, the price is in a uptrend. If the line is red, the price is in a downtrend.

EMA Cross Levels + Standard DeviationPlots the price level that the most recent EMA crossover occurred at(Green if bullish and red if bearish).
Also calculates standard deviation over a shorter window-length/lookback period (of 'n_std_fast' length) and another over a much longer span of periods(n='n_std_slow', > 'n_std_fast').
These are the two dotted lines appearing as bands around the cross-level line.

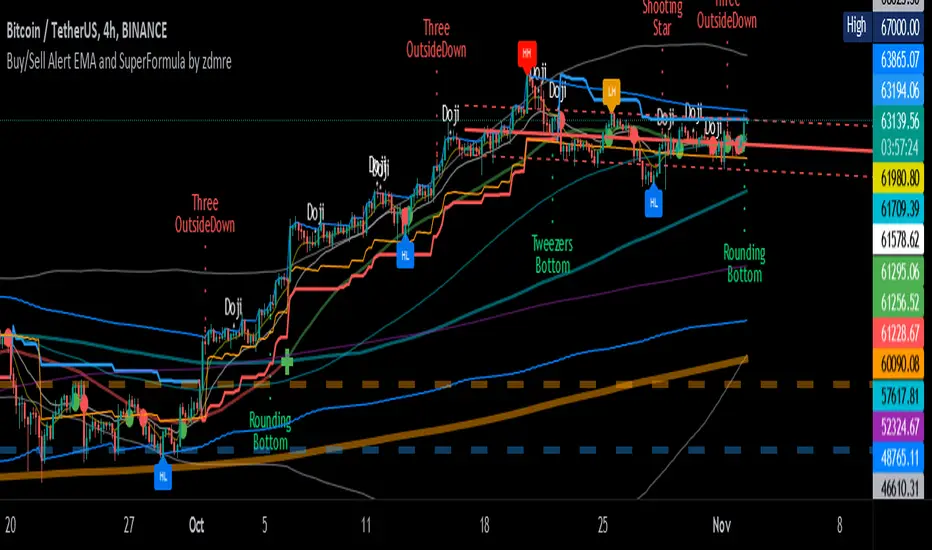
Buy/Sell Alert EMA with SuperFormula by zdmre*** Use it at your own risk
This indicator has 3 indicators and gives a buy/sell signal depending on the EMA.
3 indicators:
- Ichimoku
- Bollinger Band
- EMA
It also shows the value on the candle as a warning in the Buy and Sell signals. This value is calculated with a special formula I have created.
On the other hand Bollinger Band and Ichimoku Cloud are also included to check the accuracy of the signals.
For this indicator, I recommend a minimum of 4 hours chart.
Custom Moving Average (EMA & SMA)This script is a custom visualization tool to plot 4 Moving Averages (MA).
Each MA is customizable; you can:
enable (disable) the plot of MA;
select whether the MA is an EMA or an SMA;
the length;
the source (open, close, ...);
the offset value (default is 0).
Note:
The 1st MA is an EMA with length 50.
The others MAs are SMA with length 9, 30 and 100 respectively.

Multiple Time Frames Moving Averages (x3)This indicator is a set of 3 moving averages for which you can configure the type of the moving averages , their length , and of course the time frame . The moving averages you can choose from are:
- Simple Moving Average ( SMA )
- Exponential Moving Average ( EMA )
- Weighted Moving Average ( WMA )
- Running Moving Average (RMA)
- Hull Moving Average ( HMA )
- Volume Weighted Moving Average ( VWMA )
- Arnaud Legoux Moving Average ( ALMA )
The time-frames you can choose from - minutes (1, 3, 5, 15, 45), hours (1, 2, 3, 4, 12), days (1, 3), weekly or monthly .
Overall, it is a minimalistic indicator. No major improvements or trading logic like some of my other indicators, but I did make it slightly easier to use and visually appealing. The MAs' colors change from light to dark green/blue/red depending on the trend - bullish or bearish respectively. Initially, those were changing from green to red (based on direction) but it became a bit confusing when they started crossing each other. Anyway, feel free to change those colors to whatever you like.
If you have suggestions on how to improve this indicator or ideas about new ones, please drop me a line. Thanks.

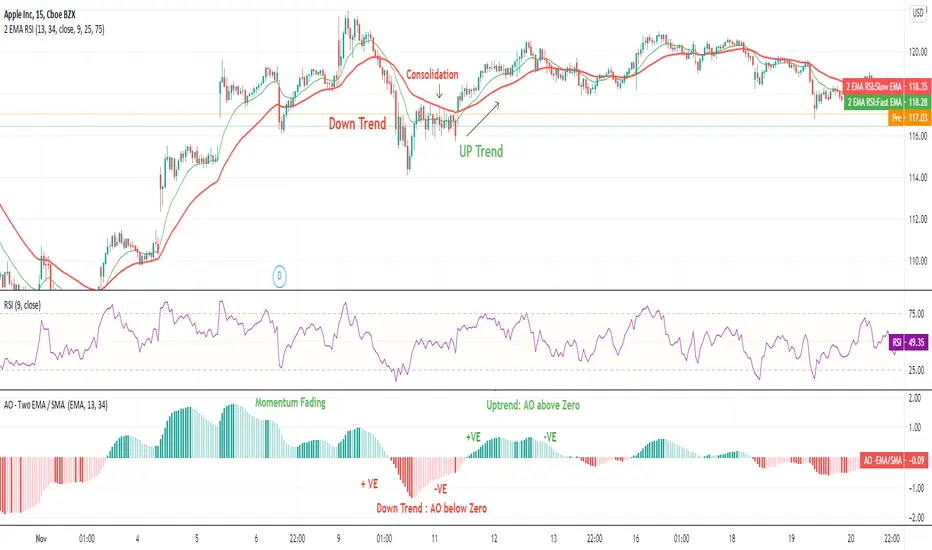
Awesome Oscillator (AO) - Two EMA / SMA Awesome Oscillator with EMA indicator plots Awesome Oscillator indicator (Bill M. Williams) on Two Exponential Moving Averages.
The value of the Awesome Oscillator indicator is calculated as the difference between moving averages over these two time frames.
Rather than using closing prices, though, these moving averages use the midpoints of the bars (i.e. halfway between the high and the low).
Midpoint = (H + L)/2
AO = Fast Moving Average - Slow Moving Average
The indicator subtracts the Fast Moving Average from the Slow Moving Average and plots this value as a histogram.
It measures the market momentum with the aim to detect potential trend direction or trend reversals and momentum.
How to read the Indicator ?
When AO is greater than zero line, it is an uptrend. When AO is less than zero it is a downtrend.
Rising AO indicates momentum intact. Falling AO indicates momentum loosing the steam.
When AO is nearing zero, one can expect the trend reversal & big move in opposite direction in trending market.
EMA Double - Bollinger Bands (BB) & RSI This Indicator (2 EMA -BB - RSI ) plots 2 EMA's along with Bollinger Bands and paints RSI Overbought & Oversold Zones on Chart.
RSI zones help quick identification of the overbought & oversold regions. RSI On/Off switch lets it Switch On & Off .

Trend Indicator for Directional Trading (main)TIDT is a two-part trend-based indicator that aims to recognize the general direction and help you identify good opportunities for going long or short. This is the main indicator that is plotted on the chart and is comprised of 3 Moving Averages over which you have full control. You can choose between the following 7 types:
- Simple Moving Average (SMA)
- Exponential Moving Average (EMA)
- Weighted Moving Average (WMA)
- Running Moving Average (RMA)
- Hull Moving Average (HMA)
- Volume Weighted Moving Average (VWMA)
- Arnaud Legoux Moving Average (ALMA)
For clarity of the trend whenever a fast MA crosses up or down a slower MA, the slower one changes its color. The faster MA changes color based on its direction.
Depending on your MA preferences and their period, you generate two main signal types:
1) Moving Average Bounce Signals - You will get a signal whenever the price bounces off, nearly touches or pierces your first MA (depending on your settings as described below)
2) Pullback / Retracement Signals - You will get a signal whenever a trend is established and the price retraces, thus giving you an optimal entry.
I've included 3 additional settings that you can tweak in order to reduce the noise or get more signals, all depending on your risk tolerance and trading style. Configuring these settings will filter the results you get in "Moving Average Bounce Signals". They are as follows:
1) Trend Strength - identifies ranging areas and helps you avoid choppy markets. The higher number, the stronger the trend must be for a signal.
2) Buffer Zone - allows you to receive a signal whenever price approaches your first MA. This way you will not miss a signal if the price doesn't bounce off your MA, or it will notify you in advance of a possible bounce/breakdown.
3) Max Candles Beyond MA - gives you a signal even if the price doesn't bounce off your first MA, but goes through it and then goes back up. You can select how many candles can close beyond the MA before invalidating the signal. Currently, the maximum number of candles that can close beyond the first MA is 5. This is done for your own practicality.
Almost all available options can be configured including the colors of the different signals - Bounces, Pullbacks, MA piercing depending on the number of candles, etc.
The second part of the indicator (called the same way with "add-on" at the end) is meant to complement this one and show additional trending signals, as well as Bull and Bear Divergences. For better results, both indicators must be used at the same time.
Please, note that like any other indicator, this one does exactly this - it indicates a good possibility of an entry, but does not guarantee profitability. Any indicator must be used as part of a system and strict money-management rules.
If you have any questions regarding the indicator or suggestions on how it could be improved, please let me know in the comment section below. Thank you.

BSKL Short-Term Momentum TradingIndicator to identify the beginning of a Momentum, designed to use for the Malaysian market(I haven't tried it on other markets).
Best to use on 30 minute timeframe. When all criteria is fulfilled, there will be a "^" logo appearing below the candlestick .
Not to be commercialised, feel free to PM me for any improvement or suggestion.
Happy trading.


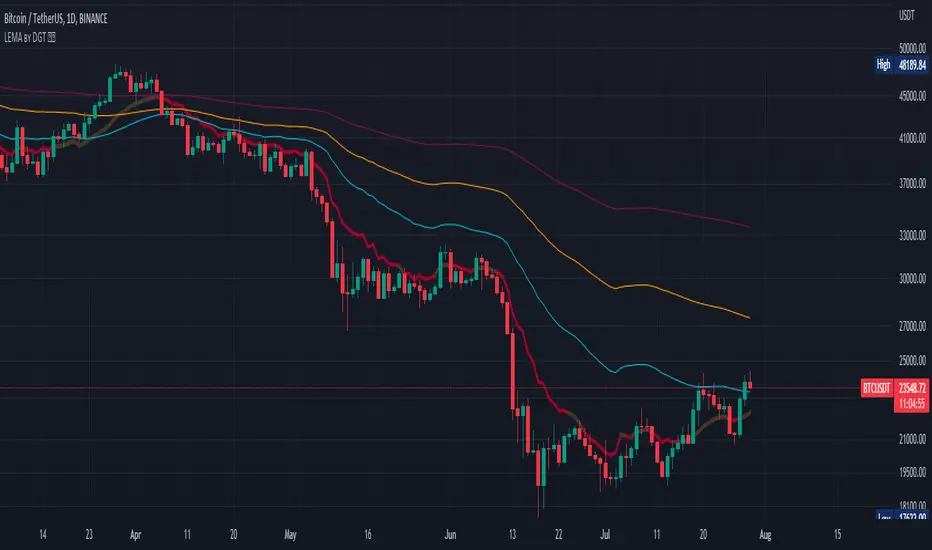
Logistic EMA w/ Signals by DGTLogistic Map Equation - The logistic map connects fluid convection, neuron firing, the Mandelbrot set and so much more.
This study is an attempt to apply Logistic Map Equation in Trading
Logistic Map Equation
Xn+1 = r * Xn * (1 - Xn)
Where,
r - growth rate
Xn - percentage of theoretical maximum of measured event (from 0 to 1)
(1 - Xn) - represents constraints of the environment, presents the idea of negative feedback
For trading the measured event will be the price of the instrument (price is commonly reffered as source in mathematicall forumlations),
hence
r - growth rate can be expressed as => change(source, length) / source, expressing r in such manner mades the equation dynamic with regards to the growth rate
Xn - percentage of theoretical maximum of the price for given duration can be expressed as => source / highest(length)
Putting pieces together we are ready to plot
Printed alone does not seem to provide much useful visualization for trading, in fact not easy to interpret especially when the market is an uptrend
What it has numerically,
Provides a ratio, where sudden changes are much more reflected thanks to negative feedback nature of the logistic equation.
As we know moving average indicators are lagging and the logistic map may fit here to reduce the lag
With this study you will find application of Logistic Map Equation with combination of Exponential Moving Average (EMA)
Logistic EMA (LEMA) and LEMA COLORS
one line with user defined periods of length, where the colors of the line will change automatically depending where the value is compared to 50-100-200 moving average
Multiple LEMAs : optional – three fixed lenght of 50-100-200 period lines
LEMA Signals
Various signals are added by using LEMA and applying some common market approaches. Use with caution and with conjunction of other indicators
Thanks to @allanster for the idea
A fascinating YouTube video explaining the logistic map - “This equation will change how you see the world (the logistic map)”
Disclaimer:
Trading success is all about following your trading strategy and the indicators should fit within your trading strategy, and not to be traded upon solely
The script is for informational and educational purposes only. Use of the script does not constitute professional and/or financial advice. You alone have the sole responsibility of evaluating the script output and risks associated with the use of the script. In exchange for using the script, you agree not to hold dgtrd TradingView user liable for any possible claim for damages arising from any decision you make based on use of the script