IFT Stochastic + Trailing StopInverse fisher transform on stochastic strategy with trailing stop. Good work on flats with mid-wave lengthPine Script®策略由laptevmaxim92提供已更新 44305
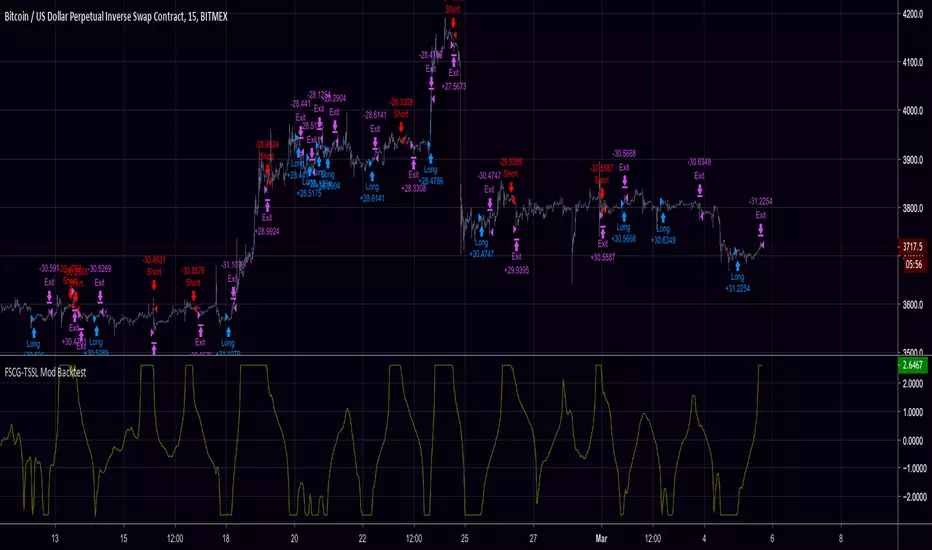
FSCG-TSSLA modification of dasanc's "Fisher Stochastic Center of Gravity" Added: - Thresholds for Buy/Sell Signals - Trailing Stop / Stop Loss - Backtest Range Support the open-source community. Screw you people selling open-source scripts to newbies. Tip Jar: 3KNZq8mE24MuBmpDJVF31bBy8zc9beDiZo Contact me for collaborations and let's take things to the next level! Do NOT contact me for alert scripts or paid-custom work, I don't work for clients.Pine Script®策略由nilux提供11192
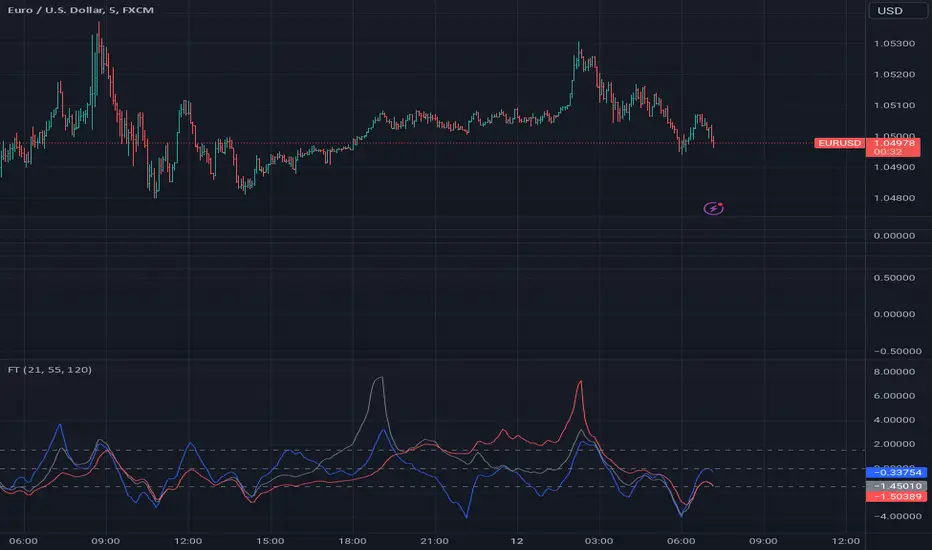
Fisher Transform Multi-Timeframe (Backtest)This is the Backtest Strategy for mortdiggiddy's "Fisher Transform Multi-Timeframe" For more details check his study: Pine Script®策略由nilux提供已更新 66145
Fisher Transform Multi-TimeframePlots the multi-timeframe version of the fisher transform. When the desired interval is less than the chart interval, the intermediate values of the transform will be displayed.Pine Script®指标由mortdiggiddy提供已更新 3030769
Ehlers Fisher Stochastic Relative Vigor Index StrategyBy John Ehlers from his book "Cybernetic Analysis for Stocks and Futures".Pine Script®策略由Tr0sT提供33199
Inverse Fisher Transform on STOCHASTIC (modified graphics)Modified the graphic representation of the script from John Ehlers - From California, USA, he is a veteran trader. With 35 years trading experience he has seen it all. John has an engineering background that led to his technical approach to trading ignoring fundamental analysis (with one important exception). John strongly believes in cycles. He’d rather exit a trade when the cycle ends or a new one starts. He uses the MESA principle to make predictions about cycles in the market and trades one hundred percent automatically. In the show John reveals: • What is more appropriate than trading individual stocks • The one thing he relies upon in his approach to the market • The detail surrounding his unique trading style • What important thing underpins the market and gives every trader an edge About INVERSE FISHER TRANSFORM: The purpose of technical indicators is to help with your timing decisions to buy or sell. Hopefully, the signals are clear and unequivocal. However, more often than not your decision to pull the trigger is accompanied by crossing your fingers. Even if you have placed only a few trades you know the drill. In this article I will show you a way to make your oscillator-type indicators make clear black-or-white indication of the time to buy or sell. I will do this by using the Inverse Fisher Transform to alter the Probability Distribution Function (PDF) of your indicators. In the past12 I have noted that the PDF of price and indicators do not have a Gaussian, or Normal, probability distribution. A Gaussian PDF is the familiar bell-shaped curve where the long “tails” mean that wide deviations from the mean occur with relatively low probability. The Fisher Transform can be applied to almost any normalized data set to make the resulting PDF nearly Gaussian, with the result that the turning points are sharply peaked and easy to identify. The Fisher Transform is defined by the equation 1) Whereas the Fisher Transform is expansive, the Inverse Fisher Transform is compressive. The Inverse Fisher Transform is found by solving equation 1 for x in terms of y. The Inverse Fisher Transform is: 2) The transfer response of the Inverse Fisher Transform is shown in Figure 1. If the input falls between –0.5 and +0.5, the output is nearly the same as the input. For larger absolute values (say, larger than 2), the output is compressed to be no larger than unity. The result of using the Inverse Fisher Transform is that the output has a very high probability of being either +1 or –1. This bipolar probability distribution makes the Inverse Fisher Transform ideal for generating an indicator that provides clear buy and sell signals. Pine Script®指标由hard6out提供11234
Fisher Transform Money Flow IndexThis is an experimental indicator by applying Money Flow Index with Fisher Transform. i found MFI code and Fisher transform code from public library. Use longer length to find divergence. Tune the length and samples according to your trading style and instrumentPine Script®指标由haidinurhasfi提供326
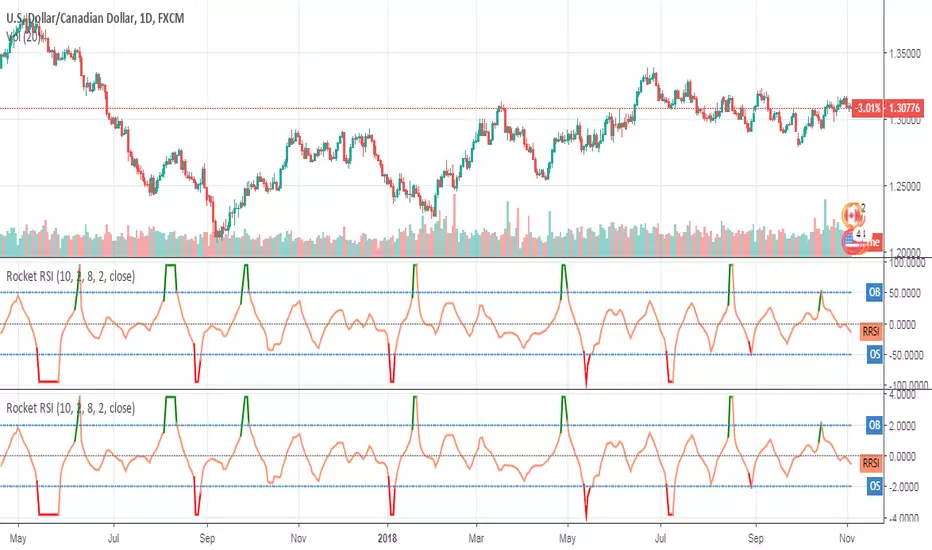
Rocket RSIRocket RSI indicator script. This indicator was originally developed by John Ehlers (Stocks & Commodities V.36:6, RocketRSI - A Solid Propellant For Your Rocket Science Trading).Pine Script®指标由everget提供已更新 88732
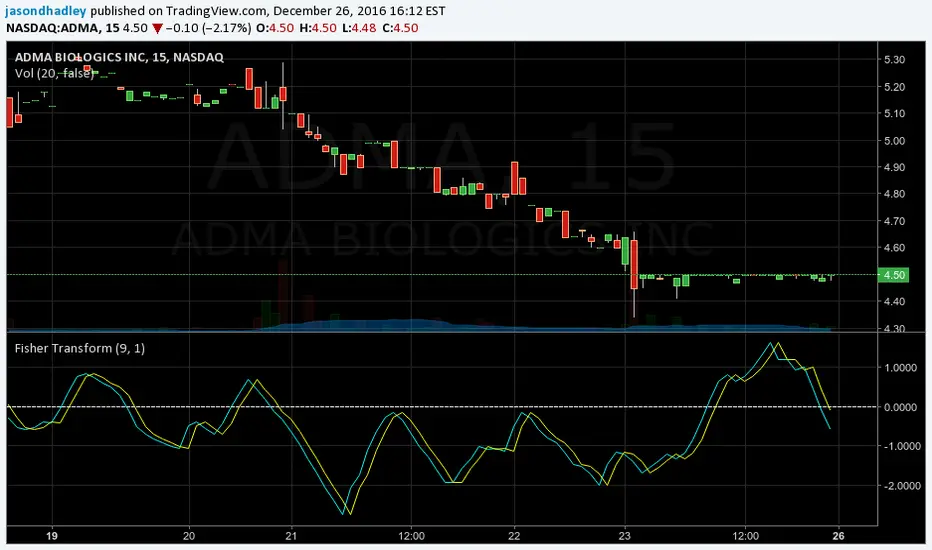
Fisher Transform SourceNothing fancy, just the Fisher Transform Indicator for those that want the source to it so they can modify it.Pine Script®指标由jasondhadley提供22286
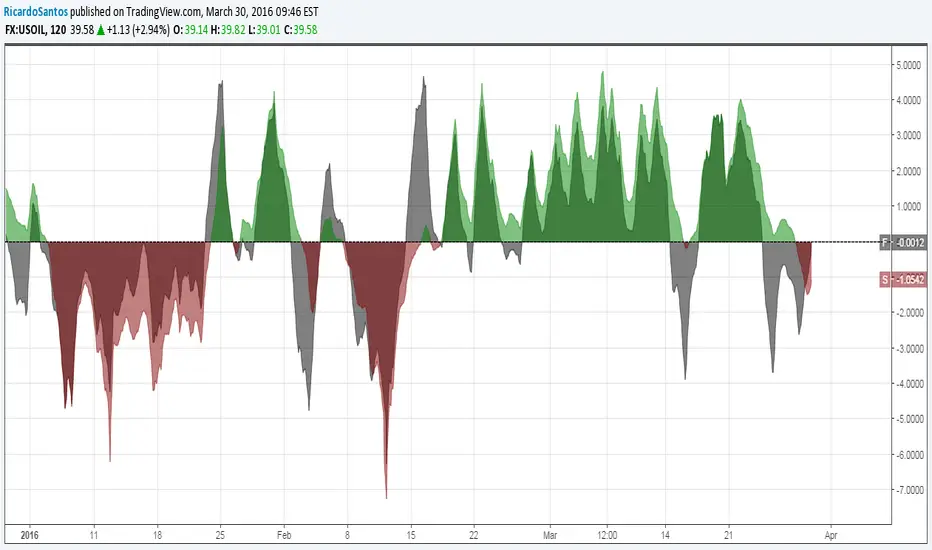
Price Divergence Detector V3 revised by JustUncleLThis is a revised version of the original "Price Divergence Detector by RicardoSantos". Description: Price Divergence detection for various methods : RSI, MACD, STOCH, VOLUME, ACC-DIST, FISHER, CCI, BB %B and Ehlers IdealRSI. Both Hidden and Regular Divergences are detected. Mofidifications: Revision 3.0 by JustUncleL Added option to disable/enable Hidden and Regular Divergence Added new divergence method BB %B (close only) Added new divergence mothos Ehlers IdealRSI (close only) Revision 2.0 - by RicardoSantos References: Information on Divergence Trading: www.babypips.com www.incrediblecharts.com (BB %B) Pine Script®指标由JustUncleL提供已更新 5858 6.7 K
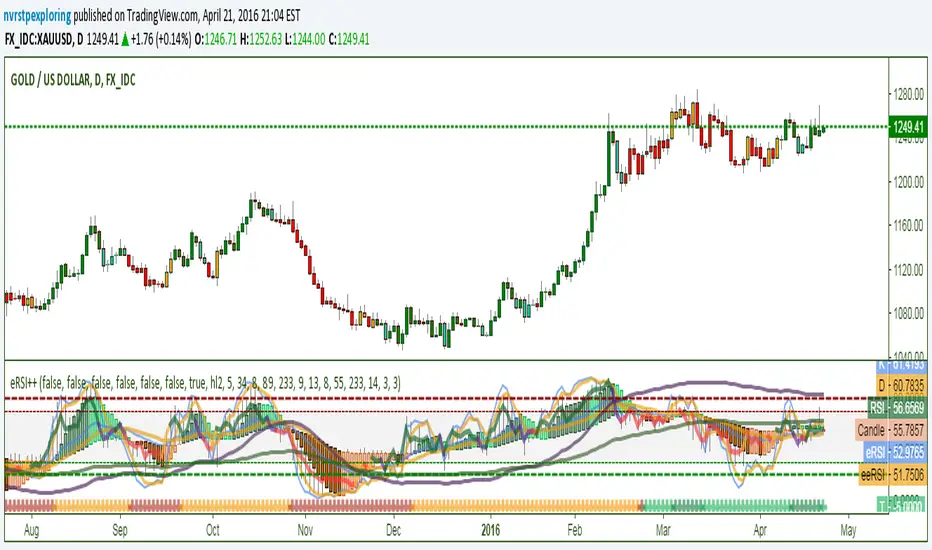
eRSI++Contains RSI; EMA of RSI; EMA of EMA of RSI; Stochastic Oscillator; 2 Inverse Fisher Transforms on RSI - IFRSI89 and IFRSI233 XOVER on higher timeframes from oversold/overbought is useful signal; RSI Trend/Divergence Candles with color variation based on multiple RSI length detection of trend decay; Chart candle overlay coloring based on RSI, eRSI, and eeRSI EMA55 & EMA233 Xover indicator on bottom for trend direction with color variations for counter trend movements. Pine Script®指标由nvrstpexploring提供77503
[RS]Double Fisher Transform V0double fisher system based on nmike system.Pine Script®指标由RicardoSantos提供11228
Fisher Transform with Up/Down colours - squattterCredit to HPotter - colour code borrowed from his AO script.Pine Script®指标由squattter提供126
Function Fisher Transform V1added ability for selecting src to the fisher() function. now can be used with rsi/stoch/macd/etc...Pine Script®指标由RicardoSantos提供已更新 11130
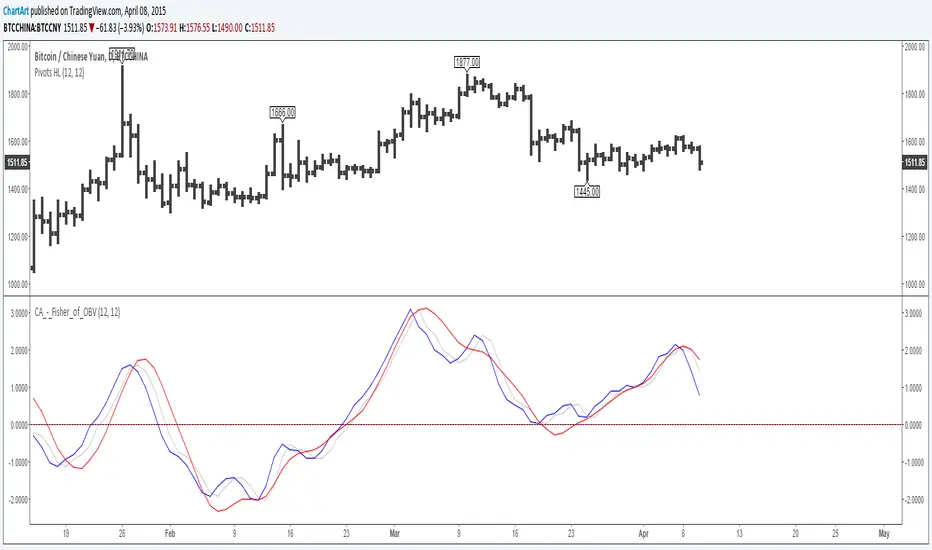
Fisher Transform of On Balance Volume (by ChartArt)A simple mash-up of the On Balance Volume (OBV) indicator with the Fisher Transform indicator (blue) with the classic Fisher Transform signal trigger (silver color), plus a linear regression as a second signal line (red). I recommend to use a period for the linear regression which has the same speed or is slower than the period of the Fisher Transform to avoid overshooting. P.S. Here are three areas where the indicator worked quite good on historic charts Pine Script®指标由ChartArt提供11 1.3 K
Multi-Functional Fisher Transform MTF with MACDL TRIGGERWhat this indicator gives you is a true signal when price is exhausted and ready for a fast turnaround. Fisher Transform is set for multi-time frame and also allows the user to change the length. This way a user can compare two or more time spans and lengths to look for these MACDL divergent triggers after a Fisher exhaustion. With so many indicators, it's probably best to merge these indicators and change the Fisher and Trigger colors so you can still have a look at price action (remember to scale right after merger). I've noticed from time to time when you have Fisher 34 100 and 300 up and running on two different time frames such as 5 and 15 min charts, with MACDL triggers on the 100/300 or 34/100 you get a high probability trade trigger. However, there are rare exceptions such as when price moves in a parabolic state up or down for a long period where this indication does not work. Ideally this indicator works best in a sideways market or slow rising/descending moving market. This indicator was worked on by Glaz, nmike and myself LazyBear also introduced the MACDL indicator Pine Script®指标由QuantitativeExhaustion提供1818 1.4 K
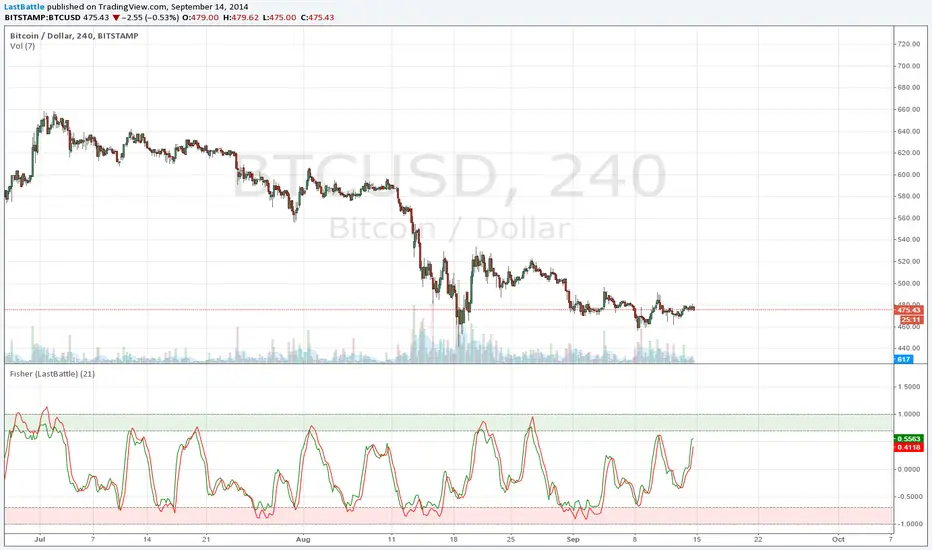
Fisher Transform StrategyDirect port of the original Fisher Transform to TradingView: media.johnwiley.com.au www.mesasoftware.com This might be better suited to be combined with other indicator to be effective, such as the Fisher Transform of RSI. I hope you have found this useful :) Happy trading. Thanks to @MikeLloyd for referring me to this, and here's my port for you.Pine Script®指标由LastBattle提供88549
Fisher Transform Indicator by Ehlers - Strategy Market prices do not have a Gaussian probability density function as many traders think. Their probability curve is not bell-shaped. But trader can create a nearly Gaussian PDF for prices by normalizing them or creating a normalized indicator such as the relative strength index and applying the Fisher transform. Such a transformed output creates the peak swings as relatively rare events. Fisher transform formula is: y = 0.5 * ln ((1+x)/(1-x)) The sharp turning points of these peak swings clearly and unambiguously identify price reversals in a timely manner. Pine Script®指标由HPotter提供2828 1.7 K
3 more indicators: Inverse Fisher on RSI/MFI and CyberCycleSuggested by John Ehlers, IFT helps you to determine the exact oversold/overbought points in any oscillator-type indicators. The 3 IFT based indicators in this chart are: - Inverse Fisher on RSI (IFTRSI) - Inverse Fisher on MFI (IFTMFI) - Inverse Fisher on CyberCycle (IFTCC) Suggested method to use any IFT indicator is to buy when the indicator crosses over –0.5 or crosses over +0.5 if it has not previously crossed over –0.5 and to sell short when the indicators crosses under +0.5 or crosses under –0.5 if it has not previously crossed under +0.5. More info: www.mesasoftware.com You can use these indicators by doing "Make it mine" (Click on "Share" to open the dialog box with this button). Let me know what you think, would love to hear how these indicators are used and how effective these are for other instruments. Pine Script®指标由LazyBear提供2121 2.9 K