12Q PerformanceShows a table of 12 quarters with Revenue, Net Income, and Net Profit Margin. Highlights QoQ changes in green/red and places the table at bottom-right for quick performance glance.Pine Script®指标由Jae-Porr提供2
DCA vs One-ShotCompare a DCA strategy by choosing the payment frequency (daily, weekly, or monthly), and by choosing whether or not to pay on weekends for cryptocurrency. You can add fees and the reference price (opening, closing, etc.).Pine Script®指标由romain4040提供19
CMC Macro Regime PanelOverview (what it is): A macro‑regime gate built entirely from TradingView-native symbols (CRYPTOCAP, FRED, DXY/VIX, HYG/LQD). It aggregates central‑bank liquidity (Fed balance sheet − RRP − Treasury General Account), USD strength, credit conditions, stablecoin flows/dominance, tech beta and BTC–NDX co‑move into one normalized score (CLRC). The panel outputs Risk‑ON/OFF regimes, an Early 3/5 pre‑signal, and an automatic BTC vs ETH vs ALTs preference. It is intentionally scoped to Daily & Weekly reads (no intraday timing). Publish with a clean chart and a clear description as per TradingView rules. TradingView Why we also use other TradingView screens (and why that is compliant) This script pulls data via request.security() from official TV symbols only; users often want to open the raw series on separate charts to sanity‑check: CRYPTOCAP indices: TOTAL, TOTAL2, TOTAL3 (market cap aggregates) and dominance tickers like BTC.D, USDT.D. Helpful for regime & rotation (ALTs vs BTC). TradingView provides definitions for crypto market cap and dominance symbols. TradingView +3 TradingView +3 TradingView +3 FRED releases: WALCL (Fed assets, weekly), RRPONTSYD (ON RRP, daily), WTREGEN (TGA, weekly), M2SL (M2, monthly). These are the official macro sources exposed on TV. FRED +3 FRED +3 FRED +3 Risk proxies: TVC:DXY (USD index), TVC:VIX (implied vol), AMEX:HYG/AMEX:LQD (credit), NASDAQ:NDX (tech beta), BINANCE:ETHBTC. VIX/NDX relationship is well-documented; VIX measures 30‑day expected S&P500 vol. TradingView +2 TradingView +2 Compliance note: Using multiple screens is optional for users, but it explains/justifies how components work together (a requirement for public scripts). Keep publication chart clean; use extra screens only to illustrate in the description. TradingView How it works (high level) Liquidity block (Weekly/Monthly) Net Liquidity = WALCL − RRPONTSYD − WTREGEN (YoY z‑score). WALCL is weekly (as of Wednesday) via H.4.1; RRP is daily; TGA is a Fed liability series. M2 YoY is monthly. FRED +3 FRED +3 FRED +3 Risk conditions (Daily) DXY 3‑month momentum (inverted), VIX level (inverted), Credit (HYG/LQD ratio or HY OAS). VIX is a 30‑day constant‑maturity implied vol index per Cboe methodology. Cboe +1 Crypto‑internal (Daily) Stablecoins (USDT+USDC+DAI 30‑day log change), USDT dominance (20‑day, inverted), TOTAL3 (63‑day momentum). Dominance symbols on TV follow a documented formula. TradingView Beta & co‑move (Daily) NDX 63‑day momentum, BTC↔NDX 90‑day correlation. All components become z‑scores (optionally clipped), weighted, missing inputs drop and weights renormalize. We never use lookahead; we confirm on bar close to avoid repainting per Pine docs (barstate.isconfirmed, multi‑TF). TradingView +2 TradingView +2 What you see on the chart White line (CLRC) = macro regime score. Background: Green = Risk‑ON, Red = Risk‑OFF, Teal = Early 3/5 (pre‑signal). Table: shows each component’s z‑score and the Preference: BTC / ETH / ALTs / Mixed. Signals & interpretation Designed for Daily (1D) and Weekly (1W) only. Regime gates (default Fast preset): Enter ON: CLRC ≥ +0.8; Hold ON while ≥ +0.5. Enter OFF: CLRC ≤ −1.0; Hold OFF while ≤ −0.5. 0 / ±1 reading: CLRC is a standardized composite. ~0 = neutral baseline (no macro edge). ≥ +1 = strong macro tailwind (≈ +1σ). ≤ −1 = strong headwind (≈ −1σ). Early 3/5 (teal): a fast pre‑signal when at least 3 of 5 daily checks align: USDT.D↓, DXY↓, VIX↓, HYG/LQD↑, ETHBTC↑ or TOTAL3↑. It often precedes a full ON flip—use for pre‑positioning rather than full sizing. BTC/ETH/ALTs selector (only when ON): ALTs when BTC.D↓ and (ETHBTC↑ or TOTAL3↑) ⇒ rotate down the risk curve. BTC when BTC.D↑ and ETHBTC↓ ⇒ keep it concentrated. ETH when ETHBTC↑ while BTC.D flat/up ⇒ add ETH beta. (Dominance mechanics are documented by TV.) TradingView Dissonance (incompatibility) rules — when to stand down Use these overrides to avoid false comfort: CLRC > +1 but USDT.D↑ and/or VIX spikes day‑over‑day → downgrade to Neutral; wait for USDT.D to stabilize and VIX to cool (VIX is a fear gauge of 30‑day expectation). Cboe Global Markets CLRC > +1 but DXY↑ sharply (USD squeeze) → size below normal; require DXY momentum to roll over. CLRC < −1 but Early 3/5 = true two days in a row → start reducing underweights; look for ON flip within a few bars. NetLiq improving (W) but credit (HYG/LQD) deteriorating (D) → treat as mixed regime; prefer BTC over ALTs. How to use (step‑by‑step) A. Read on Daily (1D) — main regime Open CRYPTOCAP:TOTAL3, 1D (panel applied). Wait for bar close (use alerts on confirmed bar). Pine docs recommend barstate.isconfirmed to avoid repainting on realtime bars. TradingView If ON, check Preference (BTC / ETH / ALTs). Then drop to 4H on your trading pair for micro entries (this indicator itself is not for intraday timing). B. Confirm weekly macro (1W) — once per week) Review WALCL/RRP/TGA after the H.4.1 release on Thursdays ~4:30 pm ET. WALCL is “Weekly, as of Wednesday”; M2 is Monthly—so do not expect daily responsiveness from these. Federal Reserve +2 FRED +2 Recommended check times (practical schedule) Daily regime read: right after your chart’s daily close (confirmed bar). For consistent timing across crypto, many users set chart timezone to UTC and read ~00:05 UTC; you can change chart timezone in TV’s settings. TradingView In‑day monitoring: optional spot checks 16:00 & 20:00 UTC (DXY/VIX move during US hours), but act only after the daily bar confirms. Weekly macro pass: Thu 21:30–22:30 UTC (after H.4.1 4:30 pm ET) or Fri after daily close, to let weekly FRED series propagate. Federal Reserve Limitations & data latency (be explicit) Higher‑TF data & confirmation: FRED weekly/monthly series will not reflect intraday risk in crypto; we aggregate them for regime, not for entry timing. Repainting 101: Realtime bars move until close. This script does not use lookahead and follows Pine guidance on multi‑TF series; still, always act on confirmed bars. TradingView +1 Public‑library compliance: Title EN‑only; description starts in EN; clean chart; justify component mash‑up; no lookahead; no unrealistic claims. TradingView Alerts you can use “Macro Risk‑ON (entry)” — fires on ON flip (confirmed bar). “Macro Risk‑OFF (entry)” — fires on OFF flip. “Early 3/5” — fires when the teal pre‑signal appears (not a regime flip). “Preference change” — BTC/ETH/ALTs toggles while ON. Publish note: Alerts are fine; just avoid implying guaranteed accuracy/performance. TradingView Background research (why these inputs matter) Liquidity → Crypto: Fed H.4.1 timing and series definitions (WALCL, RRP, TGA) formalize the “net liquidity” concept used here. FRED +3 Federal Reserve +3 FRED +3 Stablecoins ↔ Non‑stable crypto: empirical work shows bi‑directional causality between stablecoin market cap and non‑stable crypto cap; stablecoin growth co‑moves with broader crypto activity. Global liquidity link: world liquidity positively relates to total crypto market cap; lagged effects are observed at monthly horizons. VIX/Uncertainty effect: fear shocks impair BTC’s “safe haven” behavior; VIX is a meaningful risk‑off read. Pine Script®指标由seckinduran提供21
AD4President SMC Strong OB AlertsAD4President SMC Strong OB Alerts – Full Description Overview: The AD4President SMC Strong OB Alerts indicator is a multi-timeframe Smart Money Concepts (SMC) tool designed to help traders identify key Order Blocks (OBs) and potential high-probability areas of support and resistance. Inspired by premium SMC indicators, it focuses on strong OBs while filtering out weaker levels to reduce noise. Features: Strong vs. Weak Order Blocks Strong OBs: Bright green (bullish) or bright red (bearish). Weak OBs: Dimmed green (bullish) or dimmed red (bearish). Only strong OBs trigger alerts, keeping signals clean and high-probability. Multi-Timeframe Detection Works across current timeframe and higher timeframes: HTF1: 4H (configurable) HTF2: Daily HTF3: Weekly Each timeframe’s OBs are visually distinct with unique colors. 50% Midpoint / Equilibrium Line Draws a dashed line at the 50% mark of each order block. Provides a visual reference for the OB’s equilibrium and potential price reaction points. Alerts can trigger when price touches this midpoint for strong OBs. Dynamic Color Coding Strong bullish OB: Bright green Weak bullish OB: Dim green Strong bearish OB: Bright red Weak bearish OB: Dim red HTF OBs have unique color sets to distinguish them easily. Alerts for High-Probability Levels Alerts trigger only for strong OBs when: Price enters the OB Price touches the 50% midpoint of the OB Alerts available for current timeframe and all higher timeframes. Efficient Drawing & Cleanup Supports up to 500 OB boxes, 500 lines, and 500 labels. Automatically deletes old objects to prevent chart clutter. Legend / Visual Guide Shows which colors represent strong/weak OBs for each timeframe. Provides quick reference to understand signals without confusion. How Traders Use It: Identify strong support/resistance levels via bullish and bearish OBs. Spot potential supply and demand zones for entries or exits. Combine with price action, break of structure, and liquidity hunts for advanced SMC trading strategies. Alerts help you stay updated without watching charts continuously. Settings & Customization: lookback: Number of bars to analyze for OB formation. show50: Enable/disable midpoint dashed line. strongOBPct: Threshold for strong OB detection. HTFs: Configure 3 higher timeframes to monitor multi-timeframe OBs. showLegend: Toggle the visual legend. Ideal For: Swing traders, intraday traders, and position traders using Smart Money Concepts. Traders looking to filter high-probability zones while avoiding noise from weaker OBs. Pine Script®指标由ADorseystockspaper提供1114
ICT 369 Sniper MSS Indicator (HTF Bias) - H2LThis script is an ICT (Inner Circle Trader) concept-based trading indicator designed to identify high-probability reversal or continuation setups, primarily focusing on intraday trading using a Higher Timeframe (HTF) directional bias. Here are the four core components of the indicator: Higher Timeframe (HTF) Bias Filter (Market Structure Shift - MSS): It determines the overall trend by checking if the current price has broken the most recent high or low swing point of a larger timeframe (e.g., 4H). This establishes a Bullish or Bearish bias, ensuring trades align with the dominant trend. Fair Value Gap (FVG) and OTE: It identifies price imbalances (FVGs) and calculates the Optimal Trade Entry (OTE) levels (50%, 62%, 70.5%, etc.) within those gaps, looking for price to retrace into these specific areas. Kill Zones (Timing): It incorporates specific time windows (London and New York Kill Zones, based on NY Time) where institutional trading activity is high, only allowing entry signals during these defined periods. Signal and Targets: It triggers a Long or Short signal when all criteria are met (HTF Bias, FVG, OTE retracement, and Kill Zone timing). It then calculates and plots suggested trade levels, including a Stop Loss (SL) and three Take Profit targets (TP1, TP2, and a dynamic Runner Target based on the weekly Average True Range or ATR). In summary, it's a comprehensive tool for traders following ICT principles, automating the confluence check across trend, structure, liquidity, and timing. Pine Script®指标由heartolearn提供11140
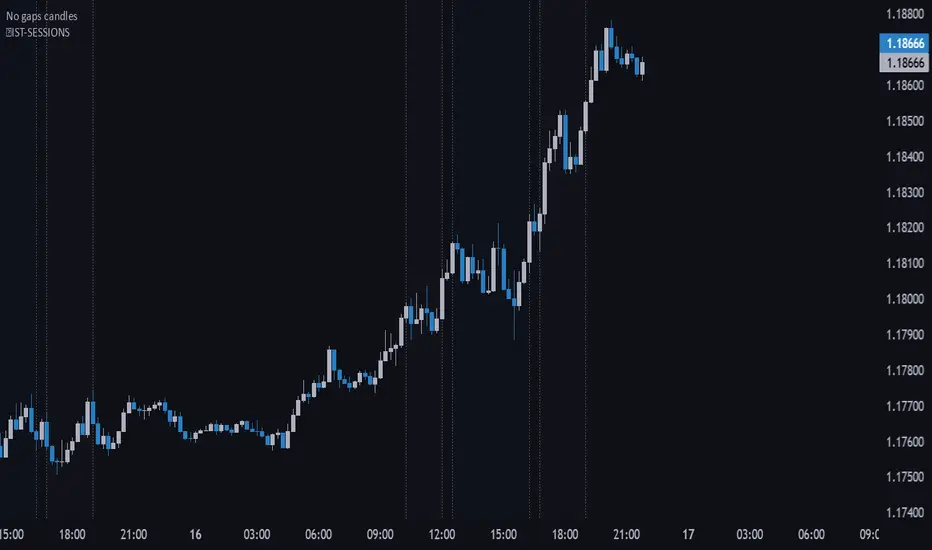
🔵IST-SESSIONS📌 IST-SESSIONS – TradingView Indicator The IST-SESSIONS indicator clearly marks all major trading sessions throughout the day according to your specified schedule, helping traders visualize market activity and plan intraday strategies. It highlights session times and breaks for optimal clarity: Morning Session: 10:15 – 12:00 Midday Break: 12:00 – 12:30 Day Session: 12:30 – 16:15 Afternoon Break: 16:15 – 16:45 Evening Session: 16:45 – 19:00 Evening Break: 19:00 – 20:00 Night Session: 20:00 – 23:00 ✔️ Visualizes multiple trading sessions and breaks ✔️ Helps traders track market activity during specific hours ✔️ Perfect for intraday strategies and session-based analysis ✔️ Makes planning entries and exits easier across different market phases How to use: Apply the indicator to your chart. Sessions and breaks are automatically highlighted according to the schedule. Use the visual cues to optimize your trading strategy for each session.Pine Script®指标由Trading_Pfx提供2
Macro & Earnings Dashboard — NY Fed CalendarMacro & Earnings Dashboard — NY Fed Calendar This is an overlay indicator designed to provide a quick, real-time overview of the most critical upcoming US economic data releases and corporate earnings reports directly on your TradingView chart. It functions as a dynamic dashboard, removing the need to constantly check external calendars. Key Features 1. Real-Time Economic Calendar (Bottom-Right Table) The dashboard tracks the time remaining until the next release of five major, high-impact economic indicators. The data for these dates is pre-loaded directly from the New York Fed Economic Indicators Calendar (currently loaded for October through December 2025). The tracked events include: CPI (Consumer Price Index) PPI (Producer Price Index) Employment Situation (Non-Farm Payrolls / Unemployment Rate) Interest Rate Decision (FOMC Meetings) Consumer Sentiment (University of Michigan Survey) 2. Corporate Earnings Tracker (Top-Right Table) This table uses TradingView's built-in data to calculate the estimated days remaining until the next Earnings Per Share (EPS) report for a curated list of high-profile NASDAQ tickers: AAPL, NVDA, GOOG, TSLA, MSFT, AMZN, META 3. Color-Coded Urgency The "Days" column for both macro and earnings tables uses a traffic light system to instantly communicate how soon the event is: Red: The event is scheduled for Today or Tomorrow (0–1 day away). Orange: The event is scheduled for the current week (within 6 days). Teal: The event is more than a week away. Gray: The date is currently unavailable or outside the loaded calendar range. Pine Script®指标由Cmo22提供9
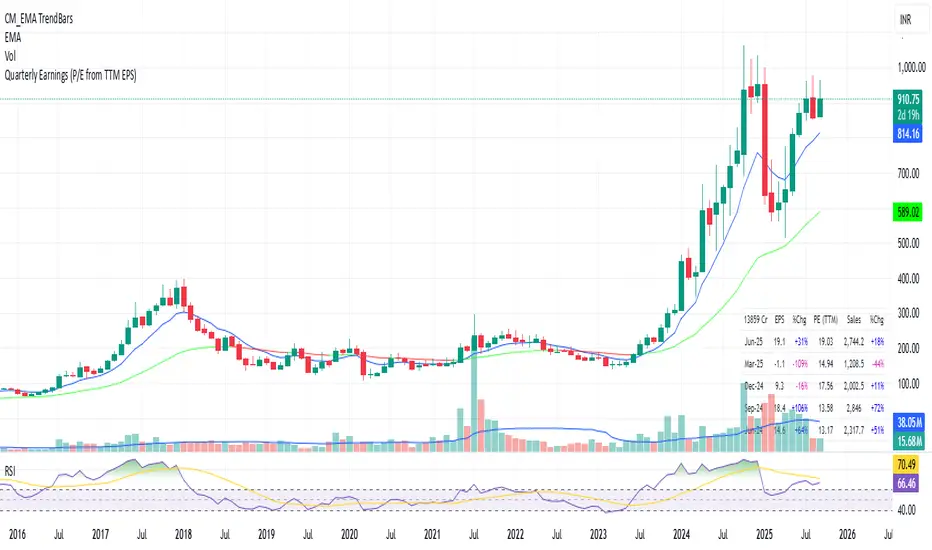
Quarterly EarningsEarnings Per Share (EPS), Price-to-Earnings Ratio (P/E, TTM), Sales (in Crores), Operating Margin (OPM %), Return on Assets (ROA %), and Return on Equity (ROE %). Each metric includes its absolute value and quarter-over-quarter or year-over-year percentage change.Pine Script®指标由Avinaash提供已更新 5
Quarterly EarningsEarnings Per Share (EPS), Price-to-Earnings Ratio (P/E, TTM), Sales (in Crores), Operating Margin (OPM %), Return on Assets (ROA %), and Return on Equity (ROE %). Each metric includes its absolute value and quarter-over-quarter or year-over-year percentage change.Pine Script®指标由Avinaash提供22
Quarterly EarningsThis Pine script shows quarterly EPS, Sales, and P/E (TTM-based) in a styled table.Pine Script®指标由Avinaash提供33
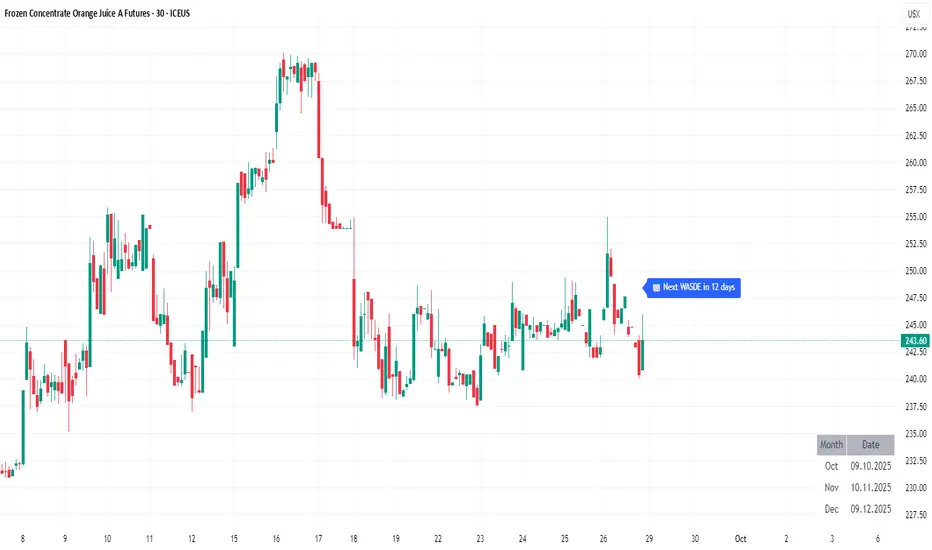
WASDE DatesOverview WASDE Dates — a small, focused event indicator that displays confirmed USDA WASDE release dates for 2025 on the chart and marks each release day. The indicator is designed to be a lightweight timing tool for traders who want clean visual reminders and optional alerts around USDA WASDE publications. Features • Shows official WASDE release dates for 2025 in a compact chart table. • Draws on-chart markers and a dotted vertical line on WASDE release days. • Two alert conditions you can enable in TradingView: "WASDE Day Alert" and "WASDE 24h Reminder". • Simple table position control (Top/Bottom, Left/Right) in the indicator settings. • Minimal, self-contained code — no external data feeds or permissions required. How to use 1. Apply the indicator to any chart and timeframe. 2. Use the indicator settings to choose table position. 3. Enable Alerts (if desired) via TradingView Alerts → choose “WASDE Day Alert” or “WASDE 24h Reminder”. 4. This version contains 2025 confirmed dates only — verify dates for live trading and enable alerts as needed. Design & rationale This indicator is intentionally not a technical trading signal. It is an event scheduler focused on clarity and low overhead: combine it with your existing setup to avoid being surprised by WASDE publications and to quickly inspect price action around these event dates. Limitations & disclaimer • This script shows **confirmed 2025** WASDE dates only. It does not provide trading advice or entry/exit signals. Use at your own risk. • Double-check official USDA publishing times before executing trades. • No external links or contact information are included in this description to comply with TradingView publishing rules. Feature outlook (V2) Planned V2 (future release): enhanced countdown (days → hours/minutes), optional inclusion of estimated 2026 dates marked as (TBC), and an invite-only/protected advanced version with reaction overlays (T+1/T+3) and extended alert options. V2 will be announced on this script page when ready. Changelog v1 — public release: 2025 confirmed dates, release markers, alerts, table position control.Pine Script®指标由DerAndi72提供5
NY 14:30 High/Low - 1mThis indicator automatically draws horizontal lines for the High (green) and Low (red) of the 14:30 (Lisbon) candle on the 1-minute chart. It is designed for traders who want to quickly identify the New York open levels (NY Open), allowing you to: Visualize the NY market opening zone. Use these levels as intraday support or resistance. Plan entries and exits based on breakouts or pullbacks. Features: Works on any 1-minute chart. Lines are drawn immediately after the 14:30 candle closes. Lines extend automatically to the right. Simple and lightweight, no complex variables or external dependencies. Daily reset, always showing the current day’s levels. Recommended Use: Combine with support/resistance zones, order blocks, or fair value gaps. Monitor price behavior during the NY open to identify breakout or rejection patterns.Pine Script®指标由AR17_17提供9
ORB 15m + MAs (v4.1)Session ORB Live Pro — Pre-Market Boxes & MA Suite (v4.1) What it is A precision Opening Range Breakout (ORB) tool that anchors every session to one specific 15-minute candle—then projects that same high/low onto lower timeframes so your 1m/5m levels always match the source 15m bar. Perfect for scalpers who want session structure without drift. What it draws Asia, Pre-London, London, Pre-New York, New York session boxes. On 15m: only the high/low of the first 15-minute bar of each window (optionally persists for extra bars). On 5m: mirrors the same 15m range, visible up to 10 bars. On 1m: mirrors the same 15m range, visible up to 15 bars. Levels update live while the 15m candle is forming, then lock. Fully editable windows (easy UX) Change session times with TradingView’s native input.session fields using the familiar format HHMM-HHMM:1234567. You can tweak each window independently: Asia Pre-London London Pre-New York New York Multi-TF logic (no guesswork) Designed to show only on 1m, 5m, 15m (by default). 15m = ground truth. Lower timeframes never “recalculate a different range”—they mirror the 15m bar for that session, exactly. Alerts Optional breakout alerts when price closes above/below the session range. Clean visuals Per-session color controls (box + lines). Boxes extend only for the configured number of bars per timeframe, keeping charts uncluttered. Built-in MA suite SMA 50 and RMA 200. Three extra MAs (SMA/EMA/RMA/WMA/HMA) with selectable color, width, and style (line, stepline, circles). Why traders like it Consistency: Lower-TF ranges always match the 15m source bar. Speed: You see structure immediately—no waiting for N bars. Control: Edit session times directly; tune how long boxes stay on chart per TF. Clarity: Minimal, purposeful plotting with alerts when it matters. Quick start Set your session times via the five input.session fields. Choose how long boxes persist on 1m/5m/15m. Enable alerts if you want instant breakout notifications. (Optional) Configure the MA suite for trend/bias context. Best for Intraday traders and scalpers who rely on repeatable session behavior and demand exact cross-TF alignment of ORB levels.Pine Script®指标由CarlosVillacis82提供35
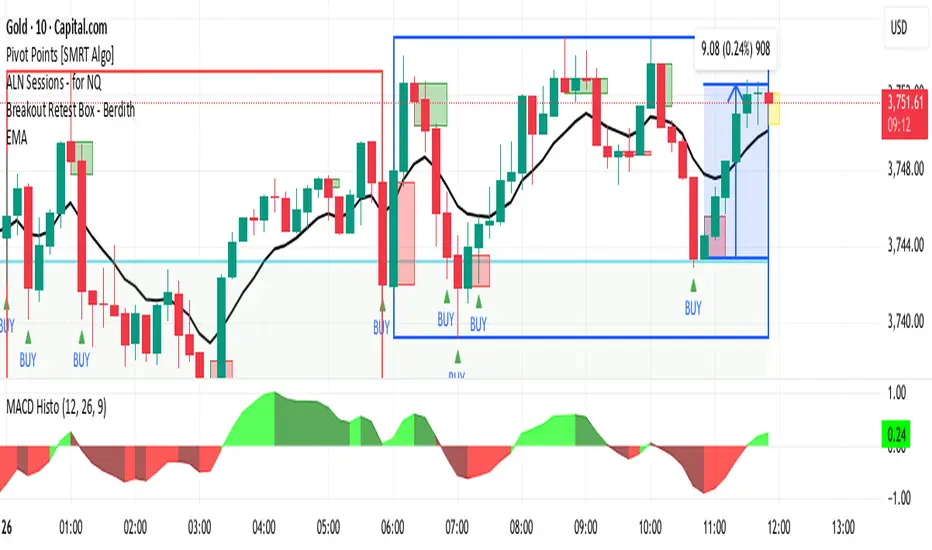
Breakout Retest Box - BerdithThis is the best way to get money, open box and retest confirmationPine Script®指标由robertbersonn提供89
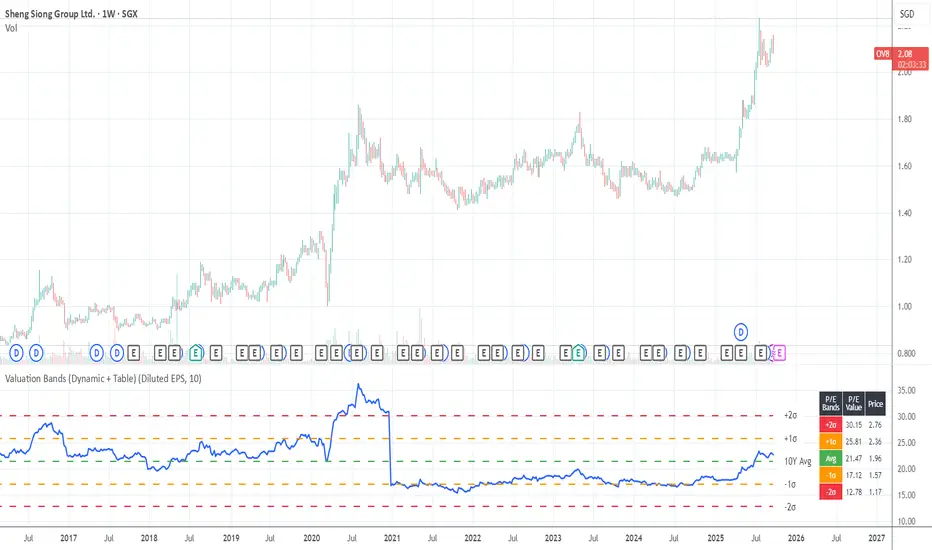
Valuation Bands (Dynamic + Table)Valuation Bands (Dynamic + Table) This indicator helps investors assess whether a stock is trading at cheap, fair, or expensive levels relative to its historical valuation multiples. It dynamically calculates valuation ratios such as P/E, P/B, P/S, P/Operating Income, P/Cash Flow, or Dividend Yield over a customizable lookback period (e.g., 10 years). Using these ratios, the script plots the long-term average alongside ±1σ and ±2σ standard deviation bands, highlighting valuation zones. The included data table displays both the multiple values and their corresponding price levels, making it easy to interpret fair value ranges. Alerts are built in to notify when the current ratio crosses into undervalued (–2σ) or overvalued (+2σ) zones, helping investors spot potential opportunities or risks. In short, this tool bridges fundamentals with technical visualization, giving a quick snapshot of how today’s valuation compares to historical norms.Pine Script®指标由choychho提供5
Valuation Bands (Dynamic + Table)Valuation Bands (Dynamic + Table) This indicator helps investors assess whether a stock is trading at cheap, fair, or expensive levels relative to its historical valuation multiples. It dynamically calculates valuation ratios such as P/E, P/B, P/S, P/Operating Income, P/Cash Flow, or Dividend Yield over a customizable lookback period (e.g., 10 years). Using these ratios, the script plots the long-term average alongside ±1σ and ±2σ standard deviation bands, highlighting valuation zones. The included data table displays both the multiple values and their corresponding price levels, making it easy to interpret fair value ranges. Alerts are built in to notify when the current ratio crosses into undervalued (–2σ) or overvalued (+2σ) zones, helping investors spot potential opportunities or risks. In short, this tool bridges fundamentals with technical visualization, giving a quick snapshot of how today’s valuation compares to historical norms.Pine Script®指标由choychho提供1
SOFR Swap Spreads (2Y, 5Y, 10Y, 30Y)This indicator models real-time SOFR swap spreads across 2Y, 5Y, 10Y, and 30Y maturities by comparing SOFR Swapnote Futures (ICEEUR) to corresponding Treasury yields (TVC). It calculates the spread for each tenor and overlays a 90-day moving average as a fair value model, with ±1 standard deviation bands.Pine Script®指标由ayounk提供7
Traders Tool by DeepanIndiaThis powerful Pine Script is designed to support both beginner and advanced traders by providing a comprehensive trading setup alongside core fundamental tools to enhance decision-making Pine Script®指标由DeepanIndia提供3
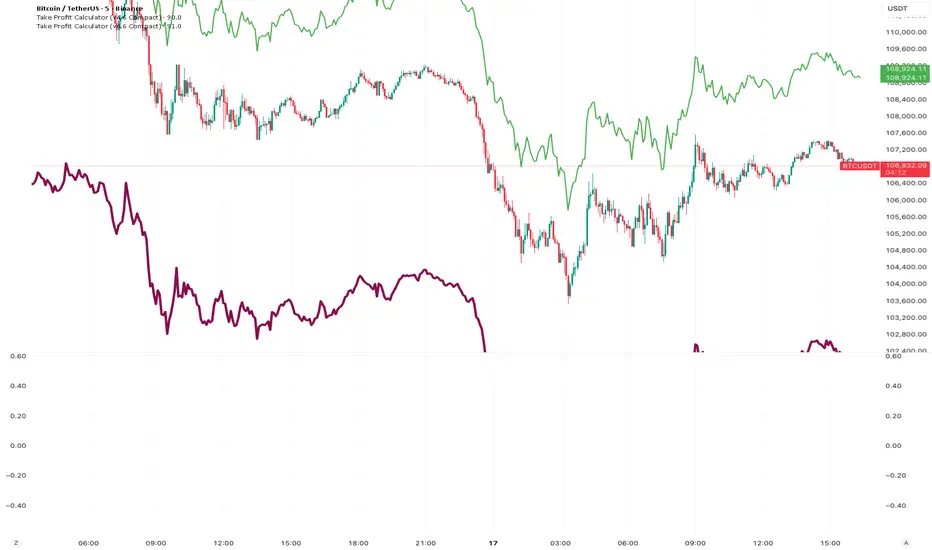
Take Profit CalculatorRelease Notes: Take Profit Calculator v1.0 Introduction Introducing the Real-Time Take Profit Calculator, a dynamic tool for TradingView designed to instantly calculate and display your target exit price. This indicator eliminates the need for manual calculations, allowing scalpers and day traders to see their profit targets directly on the chart as the market moves. Key Features Dynamic Target Calculation: The take-profit line is not static. It recalculates on every tick, moving with the current price to show you the exact target based on a real-time entry point. Full Trade Customization: Margin: Set the amount of capital (in USDT) you are allocating to the trade. Leverage: Input your desired leverage to accurately calculate the total position size. Desired Profit: Specify your target profit in USDT, and the indicator will calculate the corresponding price level. Long & Short Support: Easily switch between "Long" and "Short" trade directions. The indicator will adjust the calculation and the visual style accordingly. Customizable Display: Change the color and width of the take-profit line for both long and short scenarios. Toggle a price label on or off for a cleaner chart view. How to Use Add to Chart: Apply the "Take Profit Calculator" indicator to your chart. Open Settings: Double-click the indicator name or the line itself to open the settings panel. Enter Your Parameters: Under "Trade Parameters," fill in your Margin, Leverage, and Desired Profit. Select Direction: Choose either "Long" or "Short" from the Trade Direction dropdown. Analyze: The horizontal line on your chart now represents the exact price you need to reachPine Script®指标由dancing_god提供已更新 27
NQ Edge IndicatorThe NQ Edge Indicator is designed for Nasdaq futures traders who want a clear, visual read on market bias, trend alignment, and momentum. This overlay highlights bullish and bearish environments without giving buy/sell signals — making it the perfect complement to your own strategies. Features: ✅ Trend Background Coloring – Green for bullish, Red for bearish, based on EMA + VWAP alignment ✅ EMA & Higher Timeframe EMA – See both short-term and medium-term trend filters at a glance ✅ VWAP Line – Weighted average price reference for intraday value zones ✅ Candle Strength Detection – ATR-based measurement of strong vs. weak candles ✅ Visual-Only – No trade signals, no repainting, just clean market context Why Traders Use It: Quickly identify bullish vs. bearish bias Confirm setups with trend + strength alignment Enhance clarity on volatile intraday Nasdaq sessions Safe to use with any existing strategy Works on: Nasdaq futures (NQ / MNQ) Any timeframe on TradingView Perfect for scalpers, intraday traders, and swing traders who want to see the bigger picture instantly.Pine Script®指标由peterfwmarch提供已更新 8
Elliott Wave Auto (Impulse + Correction) — stable deleteAutomatic pivot detection: The script identifies swing highs and swing lows using ta.pivothigh and ta.pivotlow. Impulse wave labeling (1–5): Detects 5 alternating pivots and labels them as waves 1 to 5. Uses green/red labels for impulse and correction legs. Connects waves with blue lines for visual clarity. Corrective wave labeling (A–B–C): Detects the next 3 alternating pivots after wave 5. Labels them as A, B, C with orange lines connecting them. Dynamic cleanup: Stores labels and lines in arrays. Deletes previous drawings automatically before redrawing, keeping the chart clean. Optional pivot markers: Plots tiny triangles for detected pivots (green for lows, red for highs). Information table: Displays the direction (Bullish/Bearish) and percentage move of the 1–5 impulse waves. Pine Script v5 compliant: Uses str.tostring() and array-based deletion to avoid tostring() or line.deleteall() errors. If you want, I can also add an alert feature to notify you when a full impulse + corrective wave pattern completes. This makes it actionable for trading.Pine Script®指标由shravanreddy0808提供已更新 11133
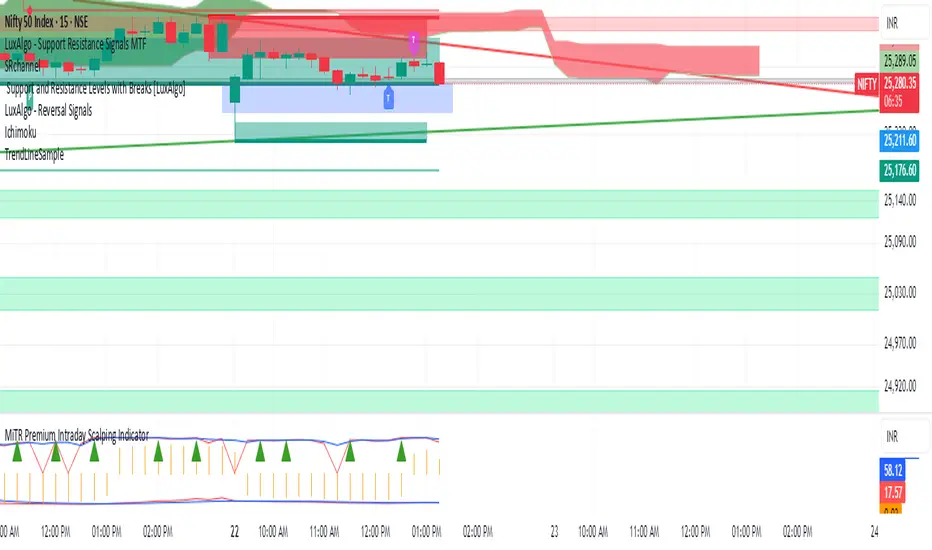
MiTR Premium Intraday Scalping IndicatorMiTR (www.mitr.live) own intraday Scalping indicator Pine Script®指标由mkrathi提供30
FRANJAS POR FECHAS - RSDescription: This indicator allows you to highlight specific dates on your chart with vertical background stripes, similar to a session indicator. Input your dates in the format DD.MM.YYYY (you can separate them with commas, spaces, line breaks, or semicolons). The script automatically normalizes the format and applies a shaded vertical band for each matching day. Works on daily and intraday charts: in intraday, the shading will cover the full trading day. Options available to adjust the color and transparency of the stripes. Optional dotted lines can be enabled at the start and end of each highlighted day. This is useful for marking important events such as FOMC meetings, earnings releases, economic data announcements, or any custom list of key dates you want to track directly on your chart.Pine Script®指标由ramonsegh提供2