Stock Fundamentals (Zeiierman)█ Overview
Stock Fundamentals (Zeiierman) is designed for investors who want a clear, visual, and efficient way to understand a company’s overall fundamental profile directly on the chart. Instead of digging through dozens of ratios or scanning multiple websites, the tool combines fundamental data, price behavior, and analyst expectations into a single intuitive visual system that can be understood at a glance.
A multi-axis “fundamental spider chart” presents the company across six core dimensions: value, quality, financial health, future prospects, dividend strength, performance, and volatility behavior. Each axis represents a structural aspect of company quality, allowing you to see strengths, weaknesses, and imbalances in one immediate view.
Alongside the spider chart, a compact PE and Return panel shows where current valuation and analyst expectations sit within their historical ranges, giving context for whether the stock is cheap, expensive, stretched, or positioned for growth.
The goal is simple: make fundamental analysis accessible, fast, and insightful for every investor, from beginner to advanced. Stock Fundamentals (Zeiierman) transforms dense data into a structured visual profile suited for stocks on the daily timeframe, allowing you to interpret company quality as easily as you read price action.
Important: This script is designed for STOCK symbols on the DAILY timeframe. On anything else, it will show an explicit warning instead of a spider chart.
⚪ Why This One Is Unique
Most fundamental overlays rely on static ratios or simple tables, but this script takes a far more comprehensive approach. It builds a multi-dimensional scoring system across Value, Health, Future, Dividend, Performance, and Volatility, then maps these dimensions into a geometric spider chart with clearly labeled axes so you can interpret company quality visually rather than through scattered numbers.
An Overall Score from 0 to 10 is computed by aggregating these dimensions and is displayed using a smooth gradient from your selected color palette. Performance scoring is based on yearly return statistics such as returns, volatility, Sharpe ratio, max drawdown, and alpha versus a benchmark, giving the score a foundation in real multi-year behavior rather than short-term noise.
Dividend quality is evaluated through yield, growth, payout behavior, free-cash-flow coverage, leverage, and the company’s EPS trend, creating a deeper view of dividend strength than raw yield alone. Future expectations are incorporated through a forward-looking model that compares projected earnings and revenue paths to the current price using a nonlinear scoring method.
A dedicated PE Sentiment and Return Estimate panel places the stock’s PE, current price, and analyst targets along a graded strip, helping you see valuation and expected upside or downside in a meaningful context.
█ Main Features
⚪ 1. Company Overview Score
Stock Fundamentals (Zeiierman) evaluates a company across six core dimensions: Value, Health, Future, Dividend, Performance, and Volatility. Each dimension is scored individually and combined into a single Overall Score (0–10) displayed beside the spider chart. The score cell uses a smooth gradient to reflect weak-to-strong company quality at a glance.
⚪ 2. Fundamental spider chart Visualization
The individual scores are mapped into a six-axis polygon, known as the fundamental spider chart. Each arm of the spider chart represents one of the core dimensions:
Dividend – quality, growth, coverage, and stability
Performance – multi-year risk-adjusted returns
Volatility – long-term price stability
Value – earnings yield, ROIC, and valuation appeal
Health – solvency, balance-sheet strength, and overall safety
Future – forward growth potential relative to current price
The axes extend from weak at the center to strong at the outer boundary, creating a color-filled shape that makes strengths, weaknesses, and imbalances instantly visible. The spider chart and the overall score work together to provide a fast, intuitive snapshot of company fundamentals.
⚪ 3. PE Sentiment Bar
A horizontal PE Sentiment bar shows where the company’s current P/E sits within its historical low-to-high range. The bar is color-graded to indicate whether the valuation leans cheap or expensive, with a marker precisely showing today’s position.
⚪ 4. Return Estimate Bar
The Return Estimate bar compares the current price against analyst expectations:
lowest target
highest target
average target
current price marker
A percentage estimate displays potential upside or downside to the average target. The bar is visually graded using the same palette for fast interpretation.
█ How to Use
⚪ Quick Stock Screening
Investors can rapidly assess company quality before deep research, saving significant time.
⚪ Comparing Opportunities
Easily compare two or more companies using their overall scores and key sentiment visuals.
⚪ Portfolio Reassessment
Use the Stock Fundamentals to monitor existing holdings and identify potential risks or strong performers.
⚪ Sentiment-Based Entries
Combine PE Sentiment and Return Estimate data to evaluate whether a stock is currently undervalued or overextended.
█ How It Works
⚪ Fundamental Dimensions and Scoring
Stock Fundamentals (Zeiierman) evaluates a company across six primary dimensions: Value, Health, Future, Dividend, Performance, and Volatility. Each dimension is assessed through its underlying behaviors rather than a single ratio, producing a more balanced and realistic view of company strength.
Value reflects how attractive the company is relative to its earnings power and capital efficiency.
Health measures balance-sheet strength, operational resilience, and the company’s ability to withstand financial stress.
Future estimates the growth potential implied by projected business expansion versus current pricing.
Dividend evaluates reliability, sustainability, and the stability of historical payouts.
Performance summarizes long-term return quality and risk-adjusted behavior.
Volatility indicates the consistency of price behavior, highlighting stability versus choppiness.
Each category is converted into a normalized score and combined into an overall weighted score (0–10), providing a fast yet reliable snapshot of company quality.
⚪ Value Engine
The Value dimension reflects both the company’s earnings attractiveness and how effectively it uses capital. Instead of relying on a single valuation ratio, the engine blends multiple valuation signals with an estimate of capital efficiency, producing a stable value intensity score. This approach rewards companies that combine strong earnings power with efficient capital use, while preventing extreme outliers from dominating.
⚪ Health Engine
The Health dimension evaluates how structurally sound the business is. It draws from indicators that capture financial resilience, balance-sheet strength, stability, and operational robustness. For financial institutions or bank-like profiles, the system shifts toward metrics that emphasize asset efficiency and solvency buffers. The result is a single robustness score that adapts to the company’s business model.
⚪ Performance Engine
Performance is based on long-term behavior rather than short-term swings. The system evaluates multi-year return characteristics, consistency, risk-adjusted efficiency, and resilience during adverse market periods. Each of these behaviors is transformed into a smooth score, then combined into a single Performance dimension that reflects “quality of returns,” not just raw gains.
⚪ Dividend Engine
The Dividend dimension assesses both reward and reliability. It considers payout behavior over several years, historical stability, growth tendencies, coverage strength, and overall sustainability. It also evaluates whether the company’s financial structure supports long-term dividends rather than simply rewarding high yield. All of these factors combine into a dividend score that balances attractiveness with durability.
⚪ Future Growth Engine
The Future dimension estimates how well the company’s projected business expansion aligns with current price levels. It builds a simplified projection of growth potential and assesses whether that trajectory reasonably supports the stock’s valuation. The closer the company appears to “growing into” its price, the higher the future score. This dimension effectively acts as a growth runway estimator.
⚪ Volatility Node
The Volatility dimension reflects how stable or turbulent the stock has been over a broad timeframe. Its purpose is descriptive rather than judgmental: a high volatility score indicates choppy behavior, while a lower score suggests consistency. Although this measurement is displayed as part of the spider chart, it is intentionally excluded from the Overall Score to avoid penalizing growth-oriented or cyclical companies unfairly.
⚪ PE Sentiment
The company’s current P/E ratio is placed within its historical low-to-high range. The panel uses a smooth gradient from “cheap” to “expensive,” with a clear marker showing exactly where today’s valuation sits relative to past conditions.
⚪ Return Estimate
Analyst expectations are displayed on a similar range-based strip. Markers show the lowest, highest, and average analyst targets, alongside a marker for the current price. A projected percentage return is calculated relative to consensus expectations, offering a simple visual cue for whether analysts see meaningful upside or downside.
-----------------
Disclaimer
The content provided in my scripts, indicators, ideas, algorithms, and systems is for educational and informational purposes only. It does not constitute financial advice, investment recommendations, or a solicitation to buy or sell any financial instruments. I will not accept liability for any loss or damage, including without limitation any loss of profit, which may arise directly or indirectly from the use of or reliance on such information.
All investments involve risk, and the past performance of a security, industry, sector, market, financial product, trading strategy, backtest, or individual's trading does not guarantee future results or returns. Investors are fully responsible for any investment decisions they make. Such decisions should be based solely on an evaluation of their financial circumstances, investment objectives, risk tolerance, and liquidity needs.
Fundamentalstrategy

Quick Valuation V.1.0 (Ibo)This Pine Script indicator performs a Quick Discounted Cash Flow (DCF)-style Valuation to estimate the intrinsic value of a stock.
It calculates a projected Fair Value and a Margin of Safety based on user inputs or automatically pulled financial data from TradingView (like revenue, growth, margin, and exit P/E). It also automatically computes a Discount Rate using a modified CAPM model.
Key Features
Valuation Output: Calculates a target Fair Value and the resulting Margin of Safety.
Data Flexibility: Automatically pulls essential fundamentals (Revenue, Margins, Shares Outstanding, etc.) but allows the user to override any value (revenue, growth, P/E, shares, etc.) via the settings.
Automated Discount Rate: Calculates the Discount Rate (Cost of Equity) using the current 10-Year Real Yield and a computed or user-defined Beta.
Clear Display: Presents all input metrics, calculated values, and data sources (TradingView or User Input) in a neat table on the chart.

PFA_Earnings Surprise %📌 Indicator Name: Earnings Surprise %
📖 Description:
The Earnings Surprise % indicator calculates and plots the difference between reported EPS (Earnings Per Share) and analyst consensus estimates, expressed as a percentage of the estimate. It helps traders and investors quickly gauge how much a company’s earnings have deviated from expectations on each earnings release date.
Earnings Surprise % — See how earnings stack up against expectations!
This simple yet powerful tool shows the percentage difference between reported EPS and analyst estimates directly on your chart. Positive surprises are plotted in green, negative surprises in red, so you can instantly spot earnings beats and misses. Great for combining with gap analysis, volume spikes, or technical setups around earnings dates. Works best on daily charts of stocks and ETFs with regular earnings reports.

PE Ratio Intrinsic ValueThe "Median PE Ratio and Intrinsic Value" indicator is designed for traders and investors who wish to evaluate the intrinsic value of a stock based on a comparative analysis of Price-to-Earnings (PE) ratios across multiple stocks. This tool not only provides insights into whether a stock is undervalued or overvalued but also allows you to visualize the intrinsic value directly on the chart.
Comparison Across Multiple Stocks:
This indicator calculates the PE ratio for up to five different stocks, allowing you to compare the target stock's valuation against four other same sector companies. By default, the stocks included are Apple (AAPL), Google (GOOG), Microsoft (MSFT), and Amazon (AMZN), but you can customize these symbols to fit your analysis needs.
Dynamic PE Ratio Calculation:
The indicator calculates the PE ratio for each stock by dividing the current price by the earnings per share (EPS). The EPS data is retrieved based on the selected period, which can be one of the following:
FY (Fiscal Year)
FH (Fiscal Half-Year)
FQ (Fiscal Quarter)
TTM (Trailing Twelve Months)
You can easily switch between these periods using the provided input options, enabling a more customized analysis based on your preferred financial timeframe.
Once the PE ratios for the selected stocks are computed, the indicator calculates the average PE ratio. The average value is a robust measure that reduces the influence of outliers and provides a balanced view of market valuation.
The intrinsic value of the stock on the chart is calculated by multiplying its EPS by the median PE ratio of the selected stocks. This gives you an estimate of what the stock should be worth if it were to trade at a fair valuation relative to the chosen peers.
The intrinsic value is plotted directly on the price chart as a step line with breaks. This step line style is chosen to represent changes in intrinsic value clearly, with breaks indicating periods where the calculated value is not valid (e.g., negative intrinsic value). Only positive intrinsic values are displayed, helping you focus on meaningful data.
You can easily customize the stocks analyzed by entering the ticker symbols of your choice. Additionally, the indicator allows you to adjust the timeframe for EPS data, giving you flexibility depending on whether you are focused on long-term trends or shorter financial periods.
How to Use:
Compare the current stock price to the plotted intrinsic value. If the current price is below the intrinsic value, the stock may be undervalued. Conversely, if the price is above the intrinsic value, the stock might be overvalued. By comparing your stock against major market players, you can gauge whether it's trading at a premium or discount relative to other key companies in the sector. Use the period selection (FY, FQ, TTM) to adapt your analysis to different market conditions or earnings cycles, giving you more control over your valuation assessment.
Ideal For:
Long-term Investors looking to assess the intrinsic value of a stock based on comparative analysis.
Fundamental Analysts who want to combine multiple stocks' PE ratios to estimate a fair valuation.
Value Investors interested in finding undervalued opportunities by comparing the market price to intrinsic value.

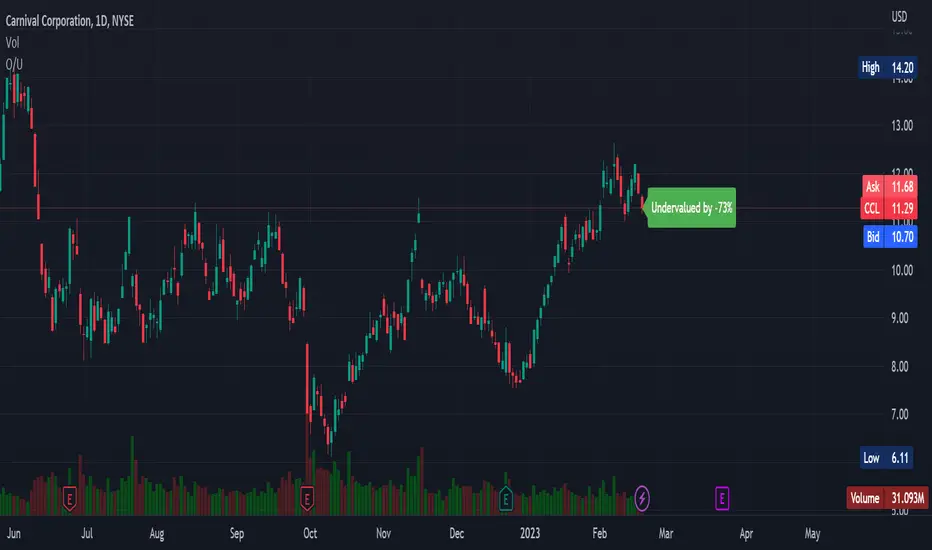
Overvalued/Undervalued OverlayThis indicator will tell you whether the security you are looking at is overvalued or undervalued using a company's total assets and their market cap. In theory, a company's total assets is everything that they own, which then should technically be how much the company is worth. Therefore, if the company's market cap is higher than their total assets, the indicator will read "Overvalued by X%". However, if the company's market cap is lower than their total assets, the indicator will read "Undervalued by X%". If you have any questions, feel free to let me know. Keep in mind that this indicator should be only used for long-term investing.
SOPR SignalThe script uses Glassnode's SOPR on-chain data to identify:
1. Sentiment Trends:
- Green circle on bottom (Bullish) -> Investors are selling in profits
- Red circle on top (Bearish) -> Investors are selling in losses
2. Short-term Entries:
- Small green circle on SOPR (Bullish) -> Approaching investor purchase price in bull run -> not willing to sell -> decrease supply
- Small red circle on SOPR (Bearish) -> Approaching break even price in bear run -> chance to get out -> increase supply
3. Potential Trend Change:
- Yellow circle on top/bottom -> Potential trend changing soon

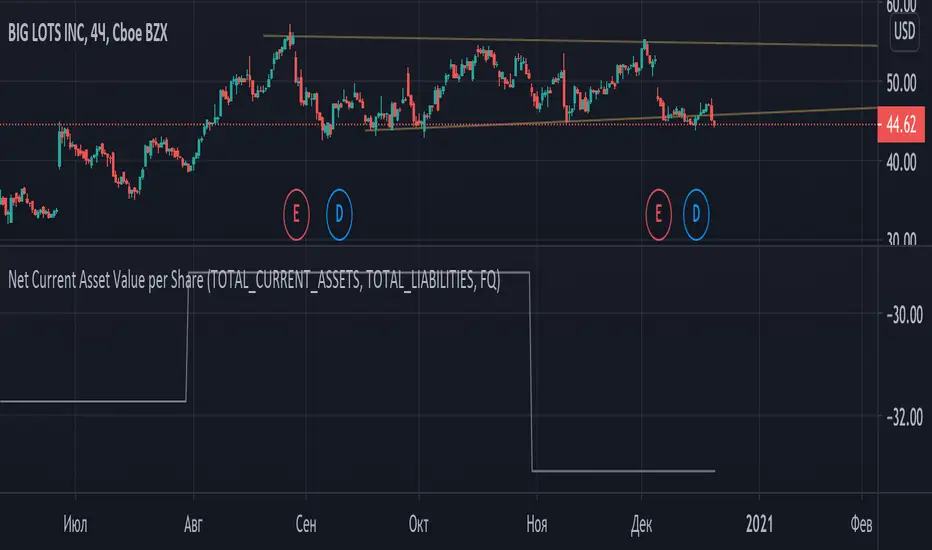
Graham Net Current Asset Value per ShareNet current asset value per share (NCAVPS) is a measure created by Benjamin Graham as one means of gauging the attractiveness of a stock. A key metric for value investors, NCAVPS is calculated by taking a company's current assets and subtracting total liabilities.
NCAVPS = Current Assets - (Total Liabilities + Preferred Stock) ÷ Shares Outstanding.
According to Graham, investors will benefit greatly if they invest in companies where the stock prices are no more than 67% (or 2/3) of their NCAV per share (price <= (2/3)*NCAV).
Coloring pattern:
- price <= (1/3)*ncav -> light green
- (1/3)*ncav < price <= (2/3)*ncav -> green
- (2/3)*ncav < price <= ncav -> dim red
- price > ncav -> red
Dividend Yield with 2 Moving Average for see SpreadI "applied" the dividend yield on the original library script which I adding 2 Exponential Moving Average.
That is average the Long term of Dividend Yield and Short Term of Dividend Yield.
To estimate the Trend that "Is it worth to invest this stock right now?"
If the dividend yield right now is higher than both maybe it worth it on the past
(You can used your price pattern skill to make an entry with backed by adjusted yield------> I think it will help you for estimate pre-total return for Hybrid with Fundamental and Technical )
Hope it will help you ><
PS. it has a problem when using with "Split" stock ( for example 1 Year on "Day" Timeframe )
if somebody can help me .pls help me pls TT
Ps2. Be warry of the stock that don't has consistency pay dividend out and some "special dividend" that don't come form the real operating income.
--------------------------------------------------------------------------------------------------------------------------------------------------------------
สวัสดีมิตรสหายเทรดเดอร์หุ้นไทยทุกท่าน ผมสร้างอินดิเคเตอร์ สำหรับดูผลตอบแทนจากเงินปันผล พร้อมกับเส้นค่าเฉลี่ย เคลื่อนที่ 2 เส้น
เพื่อเป็นการดูแนวโน้มของราคาหุ้น และเพื่อจับจังหวะการซื้อหุ้นนะครับ
ผมขอยกความดีความชอบของ ท่าน Library Script นะครับ ที่มี Format ของการคำนวณเงินปันผลมาให้ ผมทำเพียงแค่ปัดฝุ่น และ Mod เส้นค่าเฉลี่ยขึ้นมาครับ
ไม่มีอะไรจะดีไปกว่าการซื้อหุ้นแล้วมีปันผลรองรับ ซับแรงกระแทกตอนที่กดเข้าซื้อหุ้นไปอีกแล้ว
สำหรับมิตรสหายท่านใดที่ศึกษาศาสตร์ด้าน "พื้นฐาน" และ "เทคนิค" อินดิเคเตอร์นี้อาจช่วยท่านหาจุดเข้าซื้อ ที่คุ้มค่าด้านเงินปันผล และเป็นจุดซื้อที่แม่น ขลัง มากขึ้นนะครับ
ผมว่าหากใช้ควบคู่กับเรื่อง Price Pattern คงเป็นประโยชน์ไม่น้อยเลย
ขอให้อินดิเคเตอร์นี้มิประโยชน์แก่ทุกท่านนะครับ
Ps. บางที เจ้าอินดิเคเตอร์นี้อาจมีปัญหา เมื่อใช้กับหุ้นที่เคยมีการแตกพาร์มาก่อนนะครับ ท่านอาจต้องใช้ Timeframe อื่นที่ไม่ครอบครุมช่วงเวลาที่แตกพาร์ครับ
ซึ่งตรงนี้ ผมยังหาวิธีแก้ไม่พบครับ มิตรสหายท่านใดช่วยมาก ผมจะยินดีอย่างยิ่ง
Ps2. ระมัดระวังหุ้นที่จ่ายปันผลไม่สม่ำเสมอ และหุ้นที่จ่ายปันผลจากกำไรพิเศษ หรือจ่ายจากเงินที่ไม่ได้มาจากการดำเนินงานตามปกตินะครับ เช่นการขาย Asset เข้า กอง Reit ขายหุ้นในบริษัทลูกและอื่นๆ
