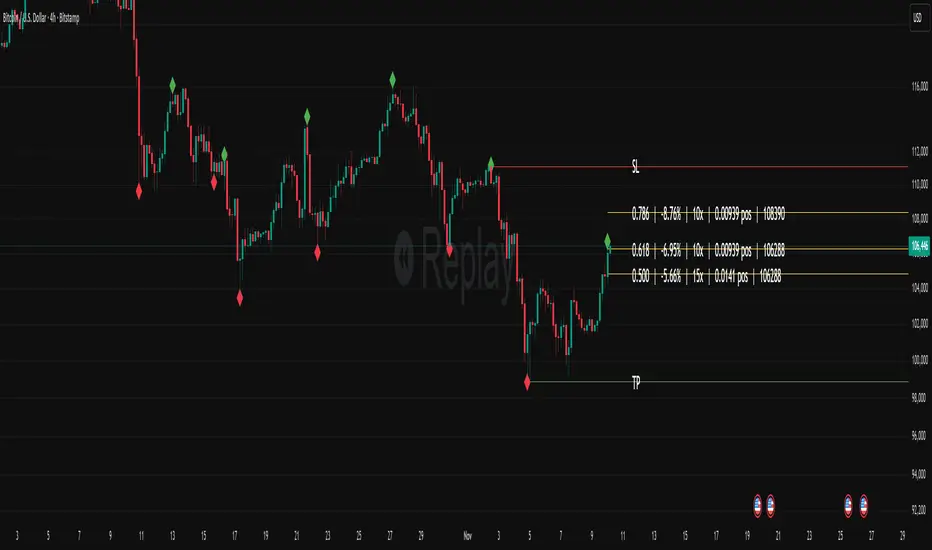
Fibonacci Set-upThe indicator plots Fibonacci retracements based on recent lows and highs.
Additionally it calculates position size, max leverage, max drawdown and pricelevels.
Helper
Svl - Trading SystemPrice can tell lies but volume cannot, so keeping this in mind I have created this indicator in which you see sell order block and buy order block on the basis of price action + volume through which we execute our trade
First of all, let us know its core concepts and logic, which will help you in taking the right decisions in it.
core concept of the " Svl - Trading System " TradingView indicator is based on professional price action, volume, and swing structure. This indicator smartly gives real-time insights of important price turning points, reversal zones, and trend continuation. Its deep explanation is given below.
Edit - default swing length -5 , change according your nature , tested With 7 For 5 minute timeframe
Core Concept:
1. Swing Structure Detection
The indicator automatically detects swing highs (HH/LH) and swing lows (HL/LL) on the chart.
HH: Higher High
HL: Higher Low
LH: Lower High
LL: Lower Low
These swings are the backbone of price action – signaling a change in trend, a bounce, reversal or trend continuation.
2. Order Block (OB) Mapping
Buy Order Block (Buy OB): When the indicator detects the HL/LL swing, we declare Buy OB, the lowest point of the swing.
Sell Order Block (Sell OB): On HH/LH swing, the highest point of our swing is called Sell OB.
Order Blocks are those important zones of price where historically price has reacted strongly – where major clusters of buyers/sellers are located in the market.
3. Volume Analysis (Optional Dashboard/Barcolor)
The candle color depends on the volume ranking on the chart (most high/low, normal, pressure blue shade).
Highest/lowest volume candles are a special highlight, which helps to spot liquidity spikes, exhaustion, or big orders.
4. Live Dashboard
There is an automated dashboard in the top-right of the chart, which shows this in real-time:
Last swing type (HH/HL/LH/LL)
Reversal price (last swing level)
Swing direction (Bull/Bear/Neutral)
Volume, Buy OB, Sell OB, etc.
This helps the trader understand the market situation at a glance.
5. Smart Plotting/Labels
Buy/Sell are plotted as distinct lines on the OB chart.
The Labels option gives clear visual swing points.
All calculations are fast and automated – the user does not need to mark manually.
This indicator is an advanced, fully-automated price action tool that combines
trend, reversal, volume, liquidity and zone detection in one smart system,
makes entry/exit decisions objective and error-free,
and provides complete trading confidence with a live monitor/dashboard.
All of its functions/properties such as: swing detect, OB plot, volume color, dashboard follow best practice for professional chart analysis!

[HELPER] Math Constant Helper█ OVERVIEW
This indicator is to show constant in table using built-in math name space, coded in latest Pine Script version 5.
█ CREDITS
Credits to PineCoders.
█ FEATURES
- Display table by changing table position, font size and color.

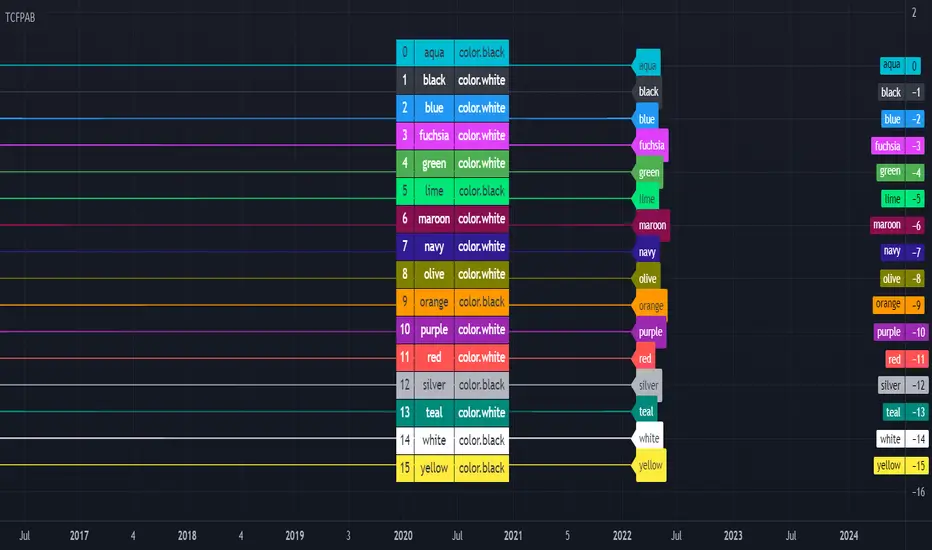
[HELPER] Table Color For Pairing Black And White█ OVERVIEW
This helper intend to simplify which color pair better with black or white color, may help some pine coders.
█ INSPIRATION
This color choice was inspired during plot especially user enable dark color theme.
Color displayed at table and label are based on Indicator name label and Indicator last value label displayed at Scales.
█ FEATURES
Color can be tick to be inverted color.
Display table by changing table position and font size.
Order Block FinderAfter finding a huge amount of use from TV user's wugamlo script Order Block Finder (Experimental) , I decided to make some much needed upgrades! Added support for plotting the last X number of Order Blocks and am currently working on a multi-timeframe version.
If you'd like to contribute to the MTF analysis portion, that would benefit tons of other scripts and open the possibility to more "MTF Panel" style indicators.
Please visit the original script page (link at top) to review how the indicator is used in trading.

[CLX][#02] Registry (type-based)This script only provides a basic __setter and __getter registration function with a type-based limitation.
We don't want to blow the code with additional conditions. The suggestion was to get the basic functionality.
Benefits:
- Get/set/update global-like variables between functions
- No init needed. You can call a entry before you set it.
Get-Functions:
- f_reg_getInt(_key)
- f_reg_getFloat(_key)
- f_reg_getBool(_key)
- f_reg_getString(_key)
- f_reg_getColor(_key)
- f_reg_getLabel(_key)
- f_reg_getLine(_key)
Set-Functions:
- f_reg_setInt(_key, _value)
- f_reg_setFloat(_key, _value)
- f_reg_setBool(_key, _value)
- f_reg_setString(_key, _value)
- f_reg_setColor(_key, _value)
- f_reg_setLabel(_key, _value)
- f_reg_setLine(_key, _value)
Feel free to contribute for an extended version. :)
We hope you enjoy it! 🎉
CRYPTOLINX - jango_blockchained 😊👍
Disclaimer:
Trading success is all about following your trading strategy and the indicators should fit within your trading strategy, and not to be traded upon solely.
The script is for informational and educational purposes only. Use of the script does not constitute professional and/or financial advice. You alone have the sole responsibility of evaluating the script output and risks associated with the use of the script. In exchange for using the script, you agree not to hold dgtrd TradingView user liable for any possible claim for damages arising from any decision you make based on use of the script.

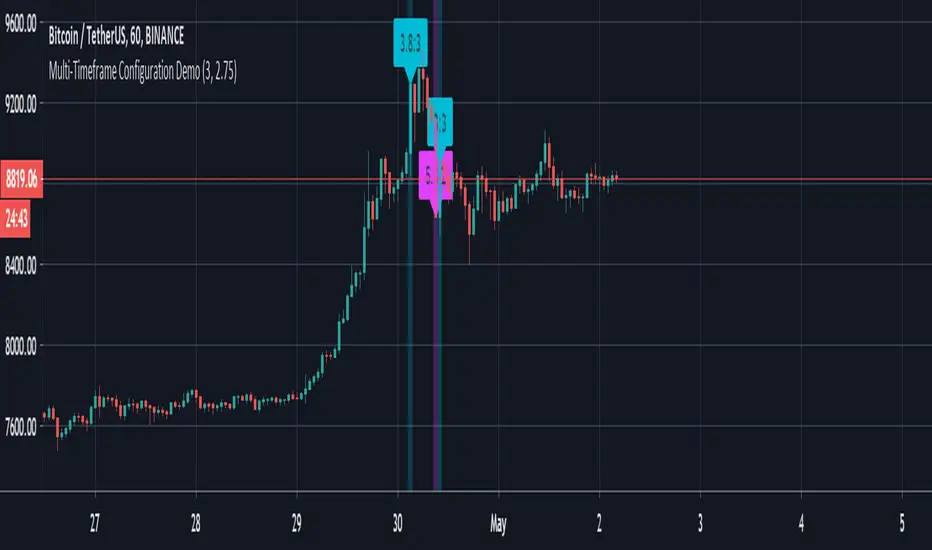
Multi-Timeframe Configuration DemoThis is a developer friendly solution to the current PineScript limitation of not being able to easily configure presets for multiple timeframes.
If you're developing multi-timeframe strategies then you've no doubt done battle with built-in `input` function which only allows for a single default value. You've probably come up with all kinds of fancy workarounds, including messy hardcoding, and even gritting your teeth and patiently reentering all the necessary values each time you refresh the chart or change the timeframe. The last one is my personal favourite.
As you can see in the code below we have defined a `usePresets` condition which tells the script to use our preset configuration, otherwise the default `input` values will be used. If `usePresets` is false then we use our presets which are defined in a (fairly) easy to read condition chain with the help of some basic timeframe utility functions.
Obviously this is nothing groundbreaking, but its helped me clean up my scripts a bit, so hopefully it will help you too.
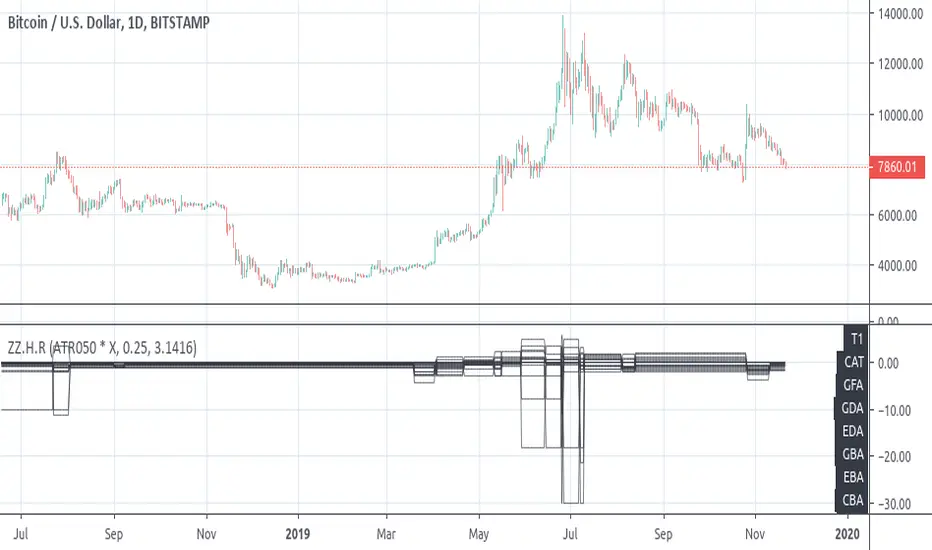
[RS][V4]ZigZag Percent Reversal - Helper - Retrace LevelsA helper script with multiple retrace level options.

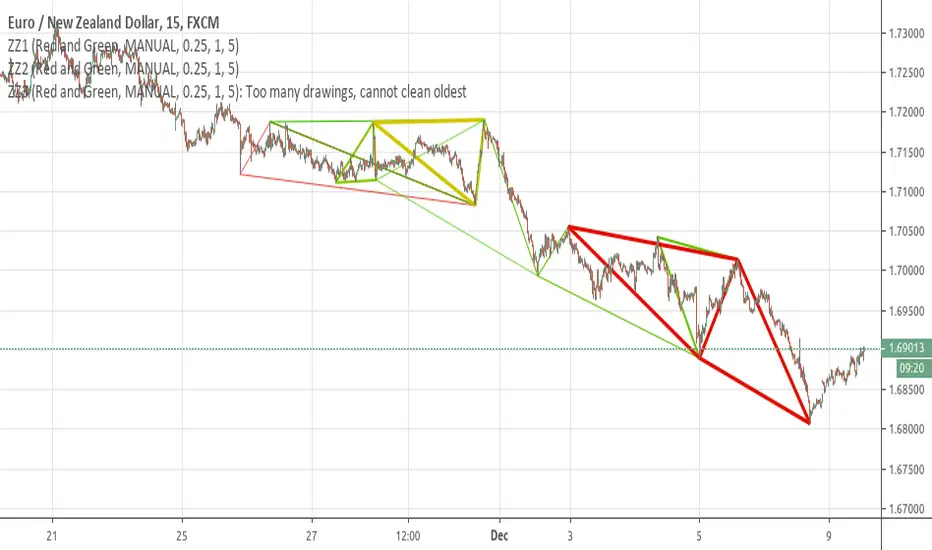
[RS]ZigZag Percent Reversal - Helper - Draw Patterns - Part 3Helper script to draw patterns on chart.
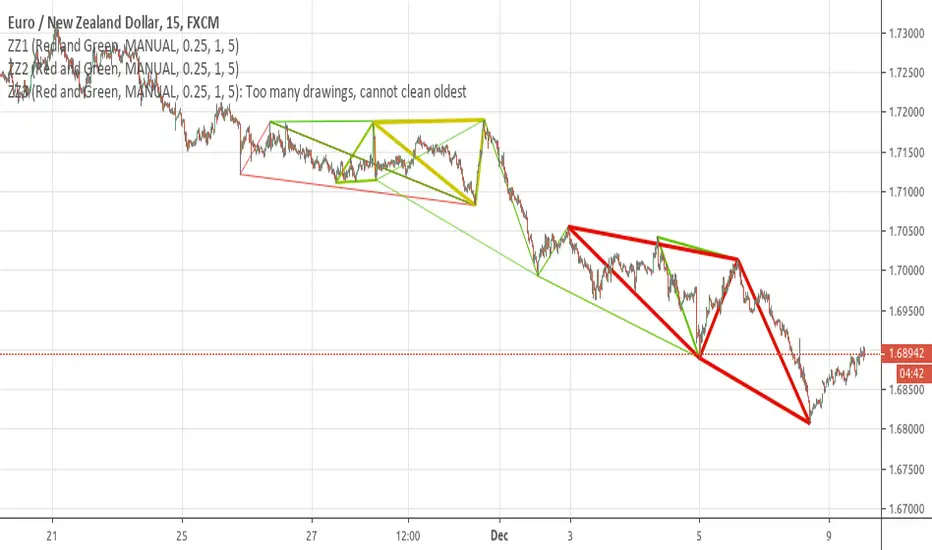
[RS]ZigZag Percent Reversal - Helper - Draw Patterns - Part 2Helper script to display patterns on chart.

[RS]ZigZag Percent Reversal - Helper - Draw Patterns - Part 1Helper script to display patterns on chart.