Goldencross & Deathcross Highlights (50/200 SMA) - Fixed dailyThis indicator visualizes major long-term trend shifts in the market
by tracking the daily 50-day and 200-day Simple Moving Averages (SMAs)
— regardless of your current chart timeframe.
🟩 A green flash (Golden Cross) appears when the 50-day SMA crosses
above the 200-day SMA — signaling potential long-term bullish momentum.
🟥 A red flash (Death Cross) appears when the 50-day SMA crosses
below the 200-day SMA — suggesting potential long-term bearish pressure.
Unlike typical SMA overlays, this script:
• Pulls daily data directly (fixed to daily timeframe)
• Works cleanly on any chart timeframe (5m, 1h, 4h, etc.)
• Avoids clutter by hiding moving average lines
• Shows only short, subtle flashes and one clean marker per event
Highlight

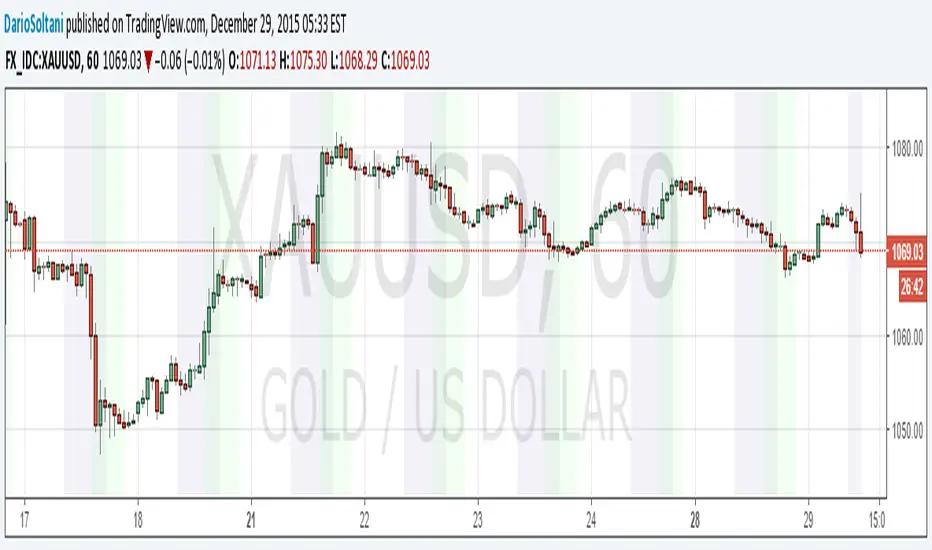
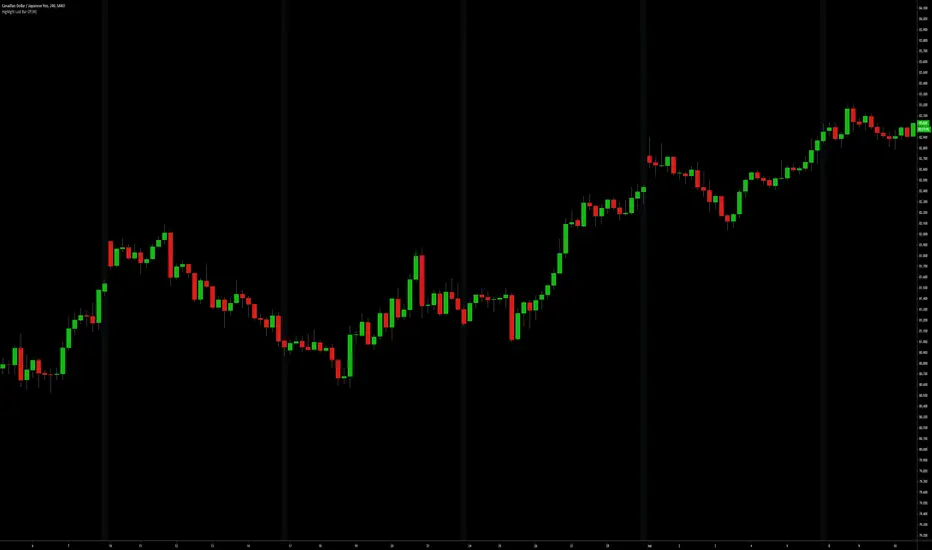
Night Session Highlight (Valehson)Highlights time range from 21:00 to 09:00 with a gray background with 90% transparency.
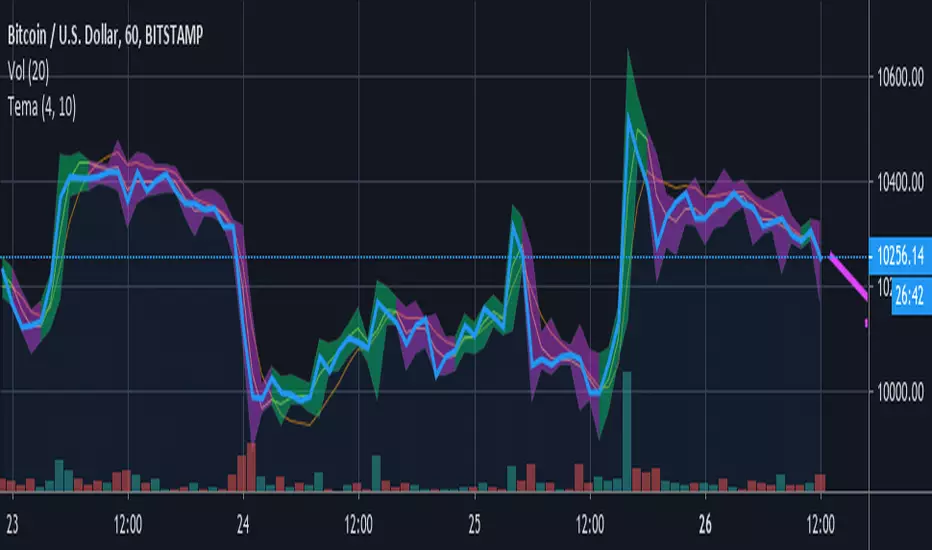
FuTech V-Spike & V-HighlighterFuTech V-Spike & V-Highlighter
In the context of trading and technical analysis, this volume spike & volume highlighter indicator is the perfect indicator used to assess market activity and make informed trading decisions.
Let's Understand in brief as below :
1) Volume Spike :
A volume spike refers to a sudden, significant increase in trading volume compared to the average volume over a specific period.
This spike can indicate heightened interest in a particular security, often preceding price movements.
Traders may look for volume spikes as signals for potential buy or sell opportunities because they can suggest that a stock is experiencing increased activity, possibly due to news, earnings releases, or other catalysts.
Characteristics of a Volume Spike:
Assess the sudden increase in trading volume.
It Can occur in both upward and downward price movements.
Often compared to the average volume over a defined period (e.g., the last 20 days).
2) Volume Highlighter:
A volume highlighter emphasizes significant changes in trading volume on a price chart. This indicator typically uses color coding to highlight periods of high volume, making it easier for traders to identify volume spikes at a glance.
How this indicator works:
a) Volume Spike will calculate the highest volume spike as per the user defined threshold multiplier. (Multiplier = when volume exceeds a certain threshold)
b) The threshold Multiplier can be set based on a fixed number or as a multiple of the Exponential Moving Average volume. Volume Spike Multiplier default is 1.5, means the EMA volume should cross 1.5 times the user defined lookback period
c) The result is derived from the user defined lookback candles by using its EMA instead of SMA, which will give us more precise results.
d) By default, last 10 candles EMA average is used to calculate the Volume Spike but you can choose your lookback period as many days, weeks, months, years of your choice !
e) In Volume Spike -
- Green candle will show Yellow color Bar as Bullish sentiments, whereas
- Red candle will show Black Bar as Bearish sentiments.
f) Volume Highlighter will highlight the candles background if the highest volume is crossing as per the the user defined lookback period
g) Default Lookback period is 20, Color coding (e.g., Blue for bullish spikes, Red for bearish spikes) helps traders quickly assess the volume context.
h) Volume Highlighter plotting shapes and positions can be modified
Illustration:
From the Above pic,
If last Volume Spike is 10 lookback candles, Spike multiplier is 1.5 and Highlighter lookback candles is 20,
Then yellow candle means the spike in volume which is 1.5 times higher than the last 10 candles
Highlighting color defines the highest volumes trading from the last 20 candles which is either Blue (Bullish) or Red (Bearish) sentiments
Conclusion :
Using FuTech V-Spike & V-Highlighter indicator - will help traders identify potential trading opportunities and better understand market dynamics.
By analyzing volume in conjunction with price movements, traders can make more informed decisions based on market sentiment.
Thank you !
Jai Swaminarayan Dasna Das !
He Hari ! Bas Ek Tu Raji Tha !

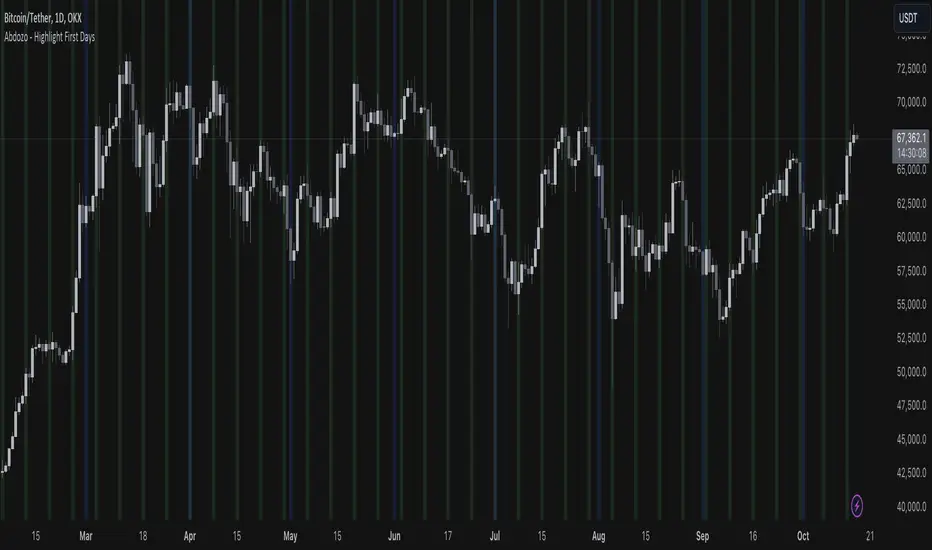
Abdozo - Highlight First DaysAbdozo - Highlight First Days Indicator
This Pine Script indicator helps traders easily identify key timeframes by highlighting the first trading day of the week and the first day of the month. It provides visual markers directly on your chart, helping you stay aware of potential market trends and turning points.
Features:
- Highlight First Day of the Week (Monday): Automatically marks Mondays to help you track weekly market cycles.
- Highlight First Day of the Month: Spot the start of each month with ease to analyze monthly performance and trends.
RSI & BB QQE Mod (highlight)This script is a combination of the RSI, QQE and BB
Here is an explanation on how I combined them, and how they are used:
- RSI (Relative Strength Index)
- Display a smoothed version of the RSI to identify "oversold" and "overbought" market phases
- Used to calculate a QQE
- QQE (Quantitative Qualitative Estimation)
- Used to identify trend direction and trend strength
- Used to set a basis for the BB
- BB (Bollinger Bands)
- Used with QQE as a basis to determine a relative definition of "high RSI" and "low RSI"
- Used with QQE as a basis to determine the volatility of the RSI at a given moment
- Used to predict pivot points
Here are the main signals:
- When "RSI Smoothed" line above the Upper BB then "RSI Smoothed" line turns green
- Also , display green background color highlight
- Also , and if "RSI Smoothed" is above the overbought line then display a second green background color highlight
- When "RSI Smoothed" line bellow the Lower BB then "RSI Smoothed" line turns red
- Also , display red background color highlight
- Also , and if "RSI Smoothed" is bellow the oversold line then display a second red background color highlight
A tool codded to be aesthetically pleasing and VERY customisable:
- Designed for both light theme and dark theme users
- Value can be easily modified in the settings
- Colors can be easily swapped in the settings
- Opacity of "fill" & "bgcolor" regrouped as a single input
A tool codded to be easy to read and to learn from:
- Sources and inspirations all listed within the script
- Structure easily identifiable (to understand with little to no effort how the script works)
Notes :
- This script is lagging, because of that I do recommend using it on relatively large timeframe
- This script is OpenSource, feel free to reuse it, but if so please remember to include a link to my script in your sources
- This script is not a magical tool, use at your own risk

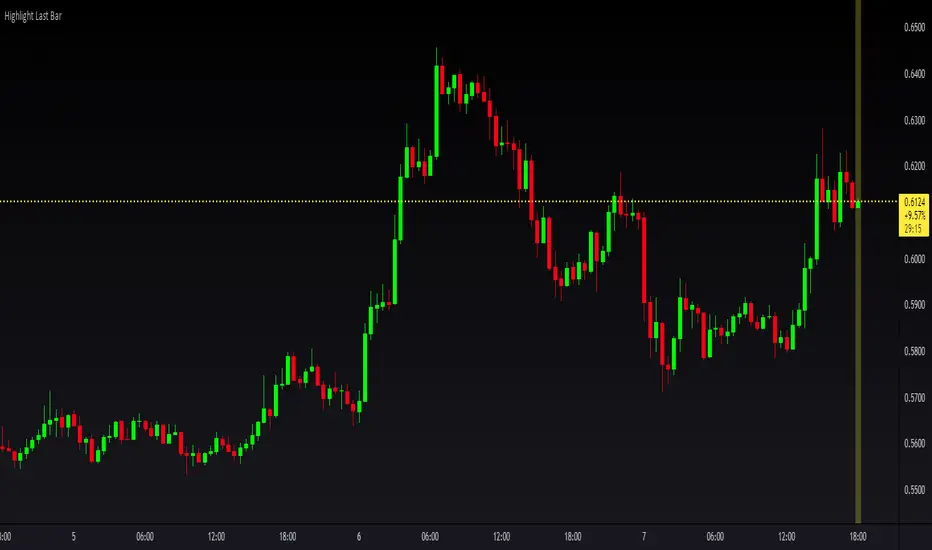
Highlight last bar, work on all timeframe, v4 & v5 @magnummHighlight last bar only. No refresh needed.
Works on all time frame and for version 4 & 5.
Can be added in your own scripts copy/pasting just one line.
//DON'T FORGET TO HYDRATE

Shade COVID PeriodA free Pine Script that shades the COVID outbreak period. Note that you can specify your own date range and shade color.

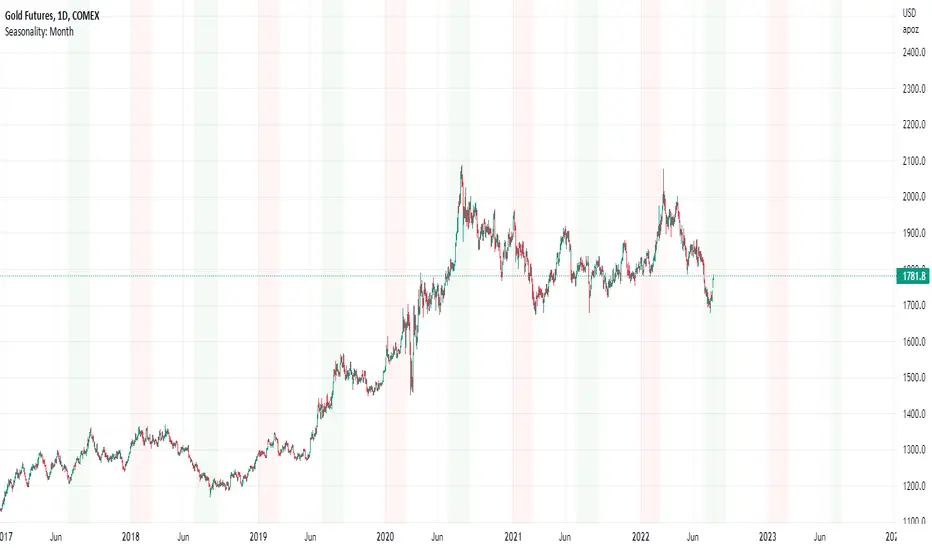
Seasonality: Month HighlightMany Assets, especially Commodities , have patterns of seasonality: Periods in the year when they have shown a greater tendency to rise or a greater tendency to fall.
The Seasonality of an asset is based on historical data (20yrs+): Specific asset seasonality charts can be found via an online search.
This is a simple tool that allows users to highlight and color code each of the 12 months of the year; depending on the seasonality of the specific asset.
The above chart shows Sugar Futures ; which are a seasonal 'sell' in February , and a seasonal 'buy' in May and August.
Seasonality should only be used to compliment a trading setup, NOT as a single reason in itself to buy or sell. Simply put: if you find a good setup, AND you have seasonality on your side; your odds of success are increased.

Dziwne MFI Overlay (with highlight)It is simply your traditional MFI , except that your 50 line became the actual price.
Why and how could it be useful? This indicator helps to spot more easily and efficiently divergences .
You could also use it for trend reversals as you usually do with your 50 line, but I would suggest to set a higher length for the MFI, like 155 or something like that.

RSI w/ Mid Point and Highlights by ShotokhanI was searching for a script that had the 50 level visible, the only one I've found was the one of Alexpunct, however the 50 line was not very visible so I've just modified style and color. It's a very little modification but at least it's useful for those who want to use is in combo with EMA or McGinley-based strategies.

Everything RSIThis indicator includes:
RSI Candles set to the default 14 length (un check Borders in the Style tab to see the candlesticks better)
I like using the wicks as an early warning for a possible trend change, which is generally in the opposite direction of the wicks.
It's also easier for me to draw trend lines using the RSI Candles vs the rsi plot line.
40 ema of the RSI Candles
2nd RSI set to the 20 length , which plots just inside the wicks of the RSI Candles. This RSI also highlights Oversold and Overbought levels.
I sometimes leave the RSI Candle Borders checked and use the 20 RSI plot with the wicks of the RSI Candles
Signals to look for Short or Long opportunities , which use the 5 sma of the RSI Candles crossing under the overbought and over the
oversold levels. If you'd like to plot the 5 sma, remove the // at the beginning of the code on line 72.
3nd RSI set to the default 14 length which can be set to a different timeframe as the current chart. Default setting is the 1h.
This RSI plots a + at the top of the indicator when it's above the 50 level and an x at the bottom of the indicator when it's below the 50 level.
For me, this is just a visual aid when I'm scalping on lower timeframes.
If the 1h RSI is above the 50 level, I focus on long scalps. If the 1h RSI is below the 50 level, I focus on short scalps.
RSI Cloud which is formed by filling in the area between the 14 ema of both the 7 RSI and 28 RSI.
I used part of @FnM_Capital 's Trend-Sniper script for my RSI Candles. Thank you! You're extremely talented and deserve all of the credit for your work.
I'd also like to thank @SeanNance for answering all of my random coding questions!!!
I've added the indicator to the example twice to show a couple of the ways I view the RSI's.
The top indicator shows the RSI Candle Borders "un checked" and without the 2nd RSI plot.
The bottom indicator shows RSI Candle Borders "checked", using 2nd RSI plot with the RSI Candle Wicks.

Triple RSIThis idea behind this indicator was to show an un cluttered view of the RSI on 3 different timeframes. The RSI for the current chart highlights Lime/Red when it crosses the Overbought and Oversold levels, which are editable in the Inputs tab. RSI 2 defaults to the 1h timeframe and prints a lime dot at the top of the indicator when it's above the 50 level and a Red Dot at the bottom of the indicator when it's below the 50 level. It can also be viewed as a plot line that changes color when it's above or below the 50 level. RSI 3 defaults to the 4h timeframe and prints a blue square at the top of the indicator when it's above the 50 level and an orange square at the bottom of the indicator when it's below the 50 level. It also can be viewed as a plot line that changes color when it's above or below the 50 level.
I've added the indicator multiple times to show a few of the different viewing options, with the default settings at the very bottom.

Background to highlight cash/session range [Futures]A simple script which allows the user to highlight the background of a certain session. At the moment there is only one session available, I will work on multiple highlights for numerous sessions at a later date.

HG Scalpius - Previous Bar HighlightHG Scalpius - Previous Bar Highlight
This indicator highlights the 20th bar from the current bar and has the below applications for trading the HG Scalpius system:
- Determining if trend mode off switch is triggered, failing to set a new higher (lower) close in the trend with 20 bars
- Determining the highest (lowest) bar in the previous range to decide if a trade is high & tight
bars_back = input(defval=20, minval=0, title="Bars Back")
bgcolor(#9C27B0, offset=-bars_back, show_last=1)
If you come across or think of any other useful scripts for the HG Scalpius system please comment below!
Happy trading!

TD Ameritrade regular + extended US trading hours highlightTD Ameritrade regular + extended US trading hours highlight

Highlight Last Bar of: D | W | M | Hour| H4 | MinutesSimple script highlighting a vertical line on the last bar of the Day/ Week/ Month/ Hour/ H4/ minute etc.
Helps maintain visibility of higher timeframes when on lower timeframes.
Quickly identify end of period levels.
Day of week, Forex FixCalendar to work on instruments that trade a 24 hour day like crypto and forex, also does not display if you are above an intraday time. Main tweak was to end the trading day at 0000 (midnight) instead of 1700 (5pm) NYC time.
This update is geared towards Forex traders, which is why I chose to highlight Wednesday in yellow since that is commonly thought of as a midweek reversal point.
@airscape built a good calendar indicator based on the work of @ChrisMoody, this is really an update to their work and directed towards FX and Crypto
airscape:
ChrisMoody:
Future development:
Toggle for light and dark themes
Adjustment/offset for DLST and local vs/ server time
Additional color bands to denote Asian/London/NYC sessions?
Text label for days instead of color option?
Clean up the code and simplify
intraday trading perioddisplay the intraday trading period (08:30 - 15:00) on chart with high transparent white background.
you can edit the time period by yourself in the pine editor mode.


Team TemaTema highlights bars based on the triple ema ( tema ) with two different length qualifiers.
The tema is believed to react quicker to price fluctuations than the simple moving average ( sma ), the exponential moving average ( ema ), and the double ema ( dema ). The shorter length tema crossing over the longer one is believed to indicate a bullish trend ahead, highlighted in green. The shorter length crossing below the longer one may indicate a bearish trend is on the way.
Benefits.
It has been found that most traders lose money because they panic early, and don't let profits run. Tema helps me to filter out trading noise , reduce stress and stay in profitable trades longer . Highlighting the candle wicks reveals trends in highs and lows that may be difficult to see otherwise. I like being able to adjust the settings and look back to see how much noise would have been good to filter out.
Things to watch out for.
Like other moving averages, the tema is a lagging indicator , vulnerable to false signals, especially during a large move up or down . Use with other indicators that are better designed for detecting tops and bottoms. Adjust the lengths to filter out what you think may be wrong signals. The settings are subjective , and it depends on the security and the time period. Manually create a note or reminder with your favorite settings for each. You may choose how much price fluctuation to filter out by going into settings, marked with the gear icon.
Unconfirmed sentiment arrow.
Tema draws an arrow of current sentiment , based on the unconfirmed price action of the faster tema. It shows where it thinks prices are presently going, barring other factors. Its main purpose is to extend a line from the end of the tema, so it is not difficult to see. Remember, it is probably wrong until the last bar closes. And even then, buyers or sellers could come along at any moment and change the outlook.
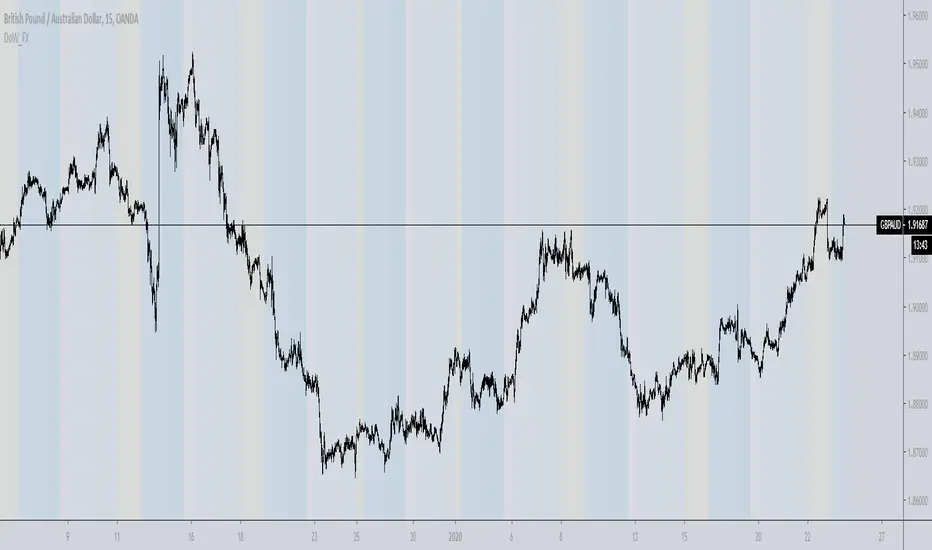
Trading hours background highlight UTC basedHighlights trading opening hours in the background based on UTC times.
Settings for US and EU markets available now, let me know if you want other markets.