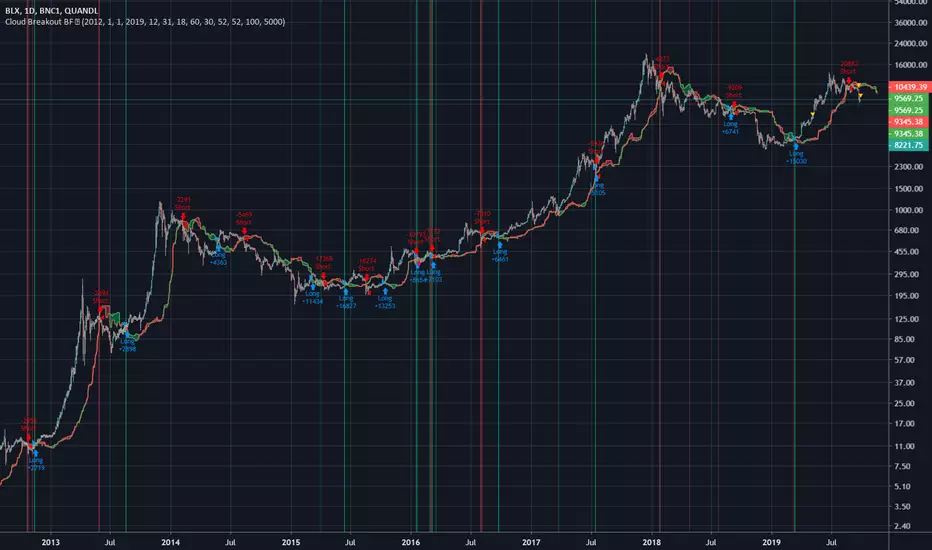
Cloud Breakout BFBased on code by nathanhoffer
Long signal is after a close above Kumo cloud, short signal after close below it.
You can adjust stuff in the settings.
一目均衡表
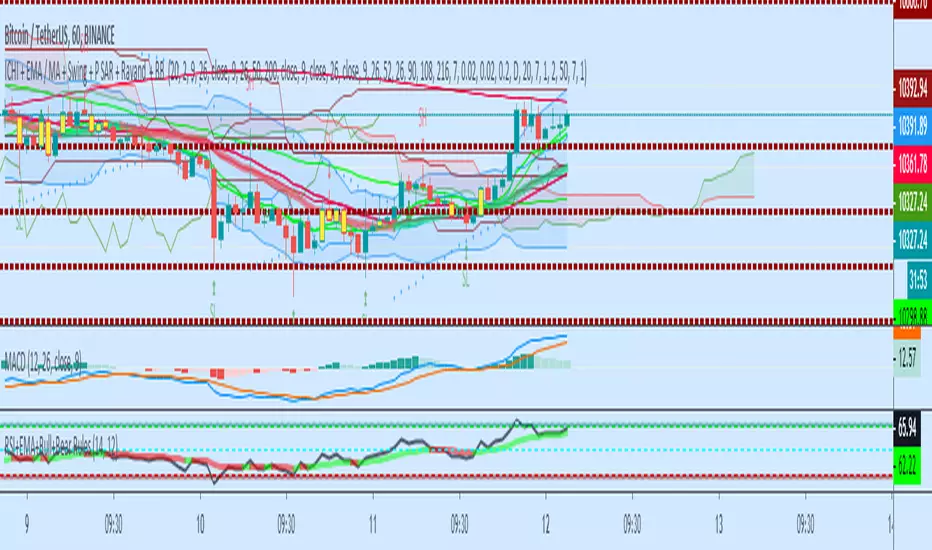
ICHI + EMA / MA + Swing + P SAR + BB A combination of Swing, Ichimuko and 3 different kijunsen, EMA, MA, MA and EMA, ( cross ), Parabolic Sar, BB, and the middle line of Bolinger Band Indicators
open source to the further adjustment
Dual Ichimoku CloudDual Ichimoku cloud
Now you don't need to switch between time frames to see cloud support/resistance!
Configure cloud as you wish then set ratio.
Example Rations
3 Minutes to 15 Minutes = 5
15 Minutes to 1 Hour = 4
1 Day to 1 Week = 5

Lancelot Band - ATR Reversal+Trending IndicatorThis is an indicator I created recently, with the mind of spotting where price might reverse and where the price is trending. You can see this as the primary indicator for your system, however, it is recommended you use this in conjunction with other confirmation indicators.
This script focus solely on ATR or Average True Range.
This indicator is the combination of the baseline from the Ichimoku cloud and the concept of the Keltner channel.
Baseline period = 14
ATR period = 14
ATR Mult = 1.5
For reversal
Long when price crossover Lower band & Stop loss at xLower band
Sell when price crossunder Upper band & Stop loss at xUpper band
For Trend Following
Long when price crossover xUpper band and Stop loss at Upper band
Short when price crossunder xLower band and Stop loss at Upper band
Again, you will need other indicators to help you to succeed in this system. This indicator will not generate the best exit for your position but will generate a good entry signal when you use it with both volume indicator and exit indicator.
Works well on BTCUSD XBTUSD, as well as other major liquid Pair.
Feel free to follow me on Twitter @Lancelot_Auger for more free Alpha.
Please acknowledge my effort by like and follow.
And lastly,
Save Hong Kong, the revolution of our times.

Odin's Kraken (TK Cross Strategy)A simple, yet profitable, trend following system based on 1 hour TK Crosses and ADX.
Works best on ETH/BTC, but is also profitable on other large-cap altcoin BTC pairs (ADA/BTC, EOS/BTC, and TRX/BTC ).
I'm still just getting started in the algo trading world, but if you have any questions I am more than happy to answer them in the comment section here or on Twitter (@pascaltmn).
Cheers.

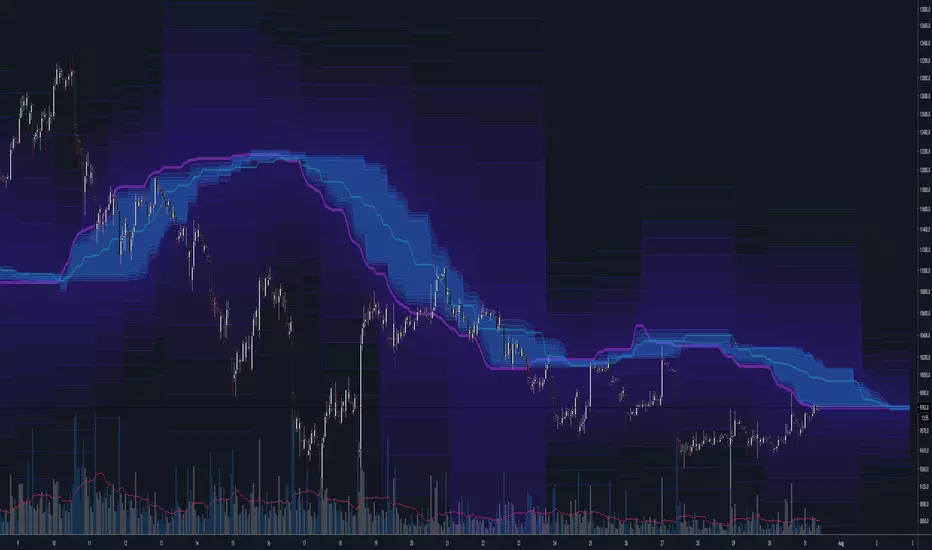
CloudRest ATR based cloudThis is an indicator I have been working on for the past 2 years, developed specifically for cryptocurrency.
It is primarily a trend following indicator with great success and it performs the best in 4hrs to the weekly chart.
There are two components of this indicator.
The baseline from Ichimoku cloud and volatility stop .
baseline period = 26
volatility stop = 1.5ATR, 3
You can view this as the main component of a trend following system but you will need other confirmation indicators to confirm your entry.
Feel free to modify the script for your own system.
Feel free to follow me on twitter @Lancelot_Auger
I will be posting more content in the future, stay tuned.
And lastly,
Free hong kong, the revolution of our time!


Filtered Waves [NXT2017] #Linda Raschke #basics on Arthur MerrilHI BIG PLAYERS,
this script I wrote for an enquiry of a tradingview-user. It should represent the Filtered Waves idea from Arthur Merril and used by Linda Raschke.
It's similar like a visualization of Elliott Waves.
On YouTube title "MTA UK Chapter Presentation with Linda Raschke" between 34-36 minutes Linda Raschke shows the rules for her Filterd Waves.
Any questions? Ask me!
King regards
NXT2017
========
TO MY PERSON
I'm the second winner of the official German Forex Trading Competition in 2018.
Look here to the ranks:
deutsche-trading-meisterschaften.de
I speak german, english and russian.
My strength in trading are Wolfe Wave pattern.

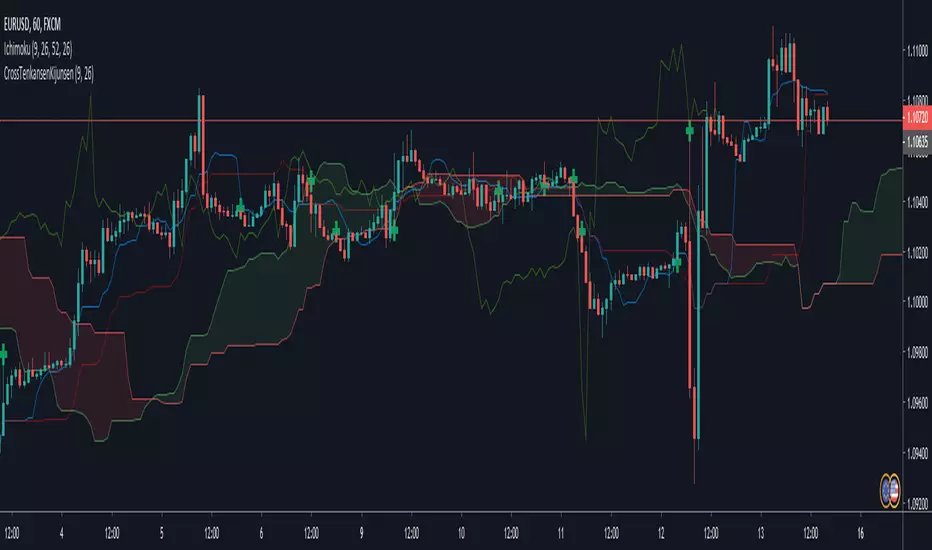
Ichimoku Cross Indicator [Mehdihz]This script shows tenken & kijen lines position to better detection of crosses.

Ichimoku Cloud setup OualidIchimoku Cloud setup Oualid
plus sûr dans les trades
Mieux addapté non agressif

The Rumpy CloudSimilar basic principle to Ichimoku cloud, more sophisticated implementation.
I've exposed cloud width multipliers in the setting in case anyone wants to experiment with them, there are likely to be other widths of significance.
Lots of lines so settings includes easy batch way of altering color settings.
--------------------------------------
If you find it useful please consider a tip/donation :
BTC - 3BMEXEDyWJ58eXUEALYPadbn1wwWKmf6sA
--------------------------------------
Tenkan Kijun Cross AlertTenkan Kijun cross alert, best used alongside a Volume indicator to help aid with finding those trend continuation patterns.
I prefer to use the Chaikin Money Flow, when it indicates and holds above the 0 line then you will bias Longs, and when below then you will Bias shorts
If you like this then please donate
BTC: 1LRbUgrkvFLQ5Mt7C62EJRD9aMvhDNT22K
ETH: 0xa509b89bccb788234278eFE63470c10946E26F3c
LTC: LV7MUr6arvCffS5N6pbTWgav5S3Yi1Eejp

Skipz multi-indicatorMaking my own indicator pack based on several indicators used by my mentors.
Would love feedback

Bollinger bands/Lagging span crossHello my dear ambitious traders
I'm working hard this week to publish some great indicators this week and open sourced. Hope you'll enjoy, learn and use them.
This will be my greatest reward but comments showing appreciation are also very welcomed (actually likes too) :)
For today, I'll share a simple indicator but it's coming along with some insightful knowledge ^^
Anyway, I'm not here to ask you to this but to share a very cool indicator I made a few months ago and wanted to share for FREE with the community today
The indicator is related to this educational post : What-a-Bollinger-Bands-Lagging-span-cross-can-tell-us/
This trading technique was invented by Robbytrade, a famous french trader twitter.com
I wanted to have those visual signals on the chart so I coded it.
The advantage of being a developer is that you can litteraly code what you miss and get your life better in the process. The one that will find a way to code a new form of money will be rich... wait.... that guy is called Satoshi Nakamoto...
That's all for me today my friends
PS
Trying to update the Trade Manager shared yesterday with some cool features. More to come in the upcoming days
Enjoy
Dave

Volume Weighted Ichimoku (Cleaned Up Visuals)Ichimoku with cleaned up appearance on chart and volume-weighted highs / lows. Publishing this final version with open script.

Kijun-sen Colored [aamonkey]I isolated the Kijun-sen from the Ichimoku Cloud and colored it.
You can do major damage by just entering when the price closes above the Kijun-sen and sell when it is the other way around.
Add some other confirmation indicators to filter some false breakouts and you are good to go.

Ichimoku Double Cloud + AutoFibCombined indicator using an ichimoku double cloud derivative.
Ideal use is option swings, using traditional ichimoku rules, targets are adjusted to the current ATR.
Appropriate strikes closest to one of these lines for assisted price targeting.
Ichimoku JrTenkan Jaune suis le prix
Kijun Orange effet elastique
Chikou ici est maintenant projeter dans le passe
SSA moyenne de tenkan et kijun projeter dans le futur
SSB moyenne des 52 dernieres bougie projeter dans le futur
