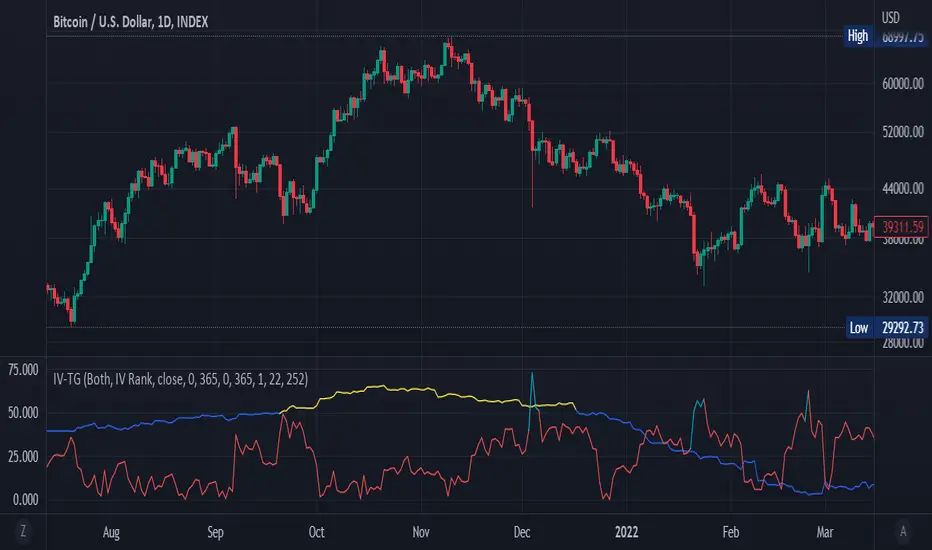
Synthetic IV Rank [UAlgo]Synthetic IV Rank is a volatility analysis indicator that creates a practical proxy for IV Rank when direct options implied volatility data is not available. Instead of reading an options chain, the script estimates a synthetic volatility series from price action using a Yang Zhang style historical volatility model, then normalizes that value into a 0 to 100 rank across a user defined lookback window.
This makes the tool especially useful for traders who want an IV Rank style workflow on instruments or markets where true implied volatility is unavailable, limited, or inconsistent. The indicator can be used on stocks, indices, forex, commodities, and crypto, with a dedicated Crypto Mode for annualization based on 365 days.
The script is built as a separate pane indicator and focuses on clear regime awareness. It plots a smooth IV Rank line, adds visual threshold references for high and low volatility zones, and shows a live status label on the most recent bar with both the current rank and the raw synthetic volatility value. The overall design makes it suitable for fast regime checks, mean reversion context, premium selling style filters, and volatility expansion monitoring.
Important note: This is a synthetic IV Rank approximation based on historical price volatility. It is not a substitute for true options implied volatility from an options chain.
🔹 Features
🔸 1) Synthetic IV Rank Using a Yang Zhang Style Volatility Model
The indicator estimates volatility from price data using a Yang Zhang style framework, then converts that estimate into an IV Rank style percentile scale. This gives users an IV Rank like signal even when broker feeds do not provide options implied volatility.
🔸 2) Engine Based Design with Structured Inputs
The script uses a custom VolatilityEngine type to organize the core calculation parameters:
hv_length for volatility estimation length
lookback_length for IV Rank normalization window
annual_factor for market specific annualization
This structure makes the logic easier to maintain and extend.
🔸 3) Stock and Crypto Annualization Modes
The engine supports two annualization conventions through a simple input toggle:
252 day convention for traditional markets
365 day convention for crypto markets
This is a practical detail because the same raw volatility process can produce different annualized values depending on the asset class.
🔸 4) Robust IV Rank Normalization with Safe Fallback
The script computes IV Rank by comparing the current synthetic volatility value against the lowest and highest values over the selected lookback period. If the range collapses to zero, the script safely assigns a neutral rank of 50 instead of causing a division issue.
This improves reliability in flat or low variance periods.
🔸 5) Clear Regime Visualization
The indicator includes a strong visual layout designed for quick interpretation:
A main IV Rank line
A mid reference line at 50
High and low threshold markers at 80 and 20
Gradient fills that visually emphasize extreme zones
This helps users recognize volatility regime shifts at a glance.
🔸 6) Dynamic Last Bar Status Labels
On the latest bar, the script prints a compact status label that shows:
Current IV Rank value
Regime label such as EXTREME FEAR, COMPLACENCY, or NEUTRAL
It also adds a secondary information label showing the raw Yang Zhang synthetic volatility percentage. This gives both normalized context and raw measurement at the same time.
🔸 7) Practical Regime Classification
The script uses simple but effective thresholds for regime tagging:
Above 80 signals elevated volatility conditions
Below 20 signals compressed volatility conditions
Between 20 and 80 is treated as neutral
These thresholds align with common IV Rank style interpretation used in discretionary and systematic workflows.
🔹 Calculations
1) Engine Initialization
On the first bar, the script initializes the custom volatility engine and stores:
The Yang Zhang calculation length
The IV Rank lookback window
The annualization factor based on asset class mode
If Crypto Mode is enabled, the annual factor uses the square root of 365. Otherwise it uses the square root of 252.
2) Synthetic Volatility Source Series
The indicator computes a Yang Zhang style historical volatility estimate from OHLC data. The model combines multiple variance components so it can capture more market behavior than a simple close to close volatility series.
The script calculates:
A first variance component labeled as overnight in the comments
An open to close variance component
A Rogers Satchell style intraday variance component from high, low, open, and close relationships
3) First Variance Component (Commented as Overnight)
In the current implementation, the first component is built from the logarithmic return of close / close , and its rolling variance is measured over the user defined length.
This is important to note because the code comments describe an overnight style component, while the actual formula uses consecutive closes in the current version.
4) Open to Close Variance Component
The script computes the logarithmic open to close return log(close / open) and then applies a rolling variance over the selected length. This measures intrabar movement relative to the bar open.
5) Rogers Satchell Intraday Variance Component
To improve intraday variance estimation, the script calculates a Rogers Satchell style daily variance term using four logarithmic relationships derived from high, low, open, and close. It then smooths this with a rolling simple average across the same volatility length.
This component is useful because it incorporates more intrabar range information than a simple close based measure.
6) Yang Zhang Weighting Factor
The script computes a weighting coefficient k that depends on the volatility length. This weight balances the contribution of the open to close variance and the Rogers Satchell component in the final combined variance.
The implementation follows the standard Yang Zhang style weighting formula shown in the script comments.
7) Combined Synthetic Volatility and Annualization
After computing the variance components, the script combines them into a single Yang Zhang style variance estimate, takes the square root to obtain volatility, and annualizes the result with the engine annual factor. The final synthetic volatility value is expressed as a percentage.
In practical terms, this output is the raw volatility series that the script later converts into Synthetic IV Rank.
8) IV Rank Calculation
The IV Rank logic measures where the current synthetic volatility sits relative to its historical range over the selected lookback:
It finds the lowest synthetic volatility in the lookback window
It finds the highest synthetic volatility in the lookback window
It scales the current value to a 0 to 100 rank
If the lookback range is flat, the script assigns 50.0 as a neutral fallback.
This normalization step is what makes the output behave like an IV Rank style regime indicator rather than a raw volatility plot.
9) Regime State Classification
On the latest bar, the script assigns a text state from the current IV Rank:
EXTREME FEAR when rank is above 80
COMPLACENCY when rank is below 20
NEUTRAL otherwise
The label color also changes with the state, which improves visual scanning.
10) Visual Layer Logic
The visualization includes:
A plotted IV Rank line
Hidden boundary plots for fill anchors
Visible threshold markers at 80 and 20
A midpoint reference line at 50
Gradient fills for high volatility and low volatility zones
The fill logic visually intensifies as the IV Rank moves deeper into an extreme zone, helping users identify volatility compression and expansion phases quickly.
11) What This Indicator Represents in Practice
This script is best understood as a normalized historical volatility regime tool designed to mimic the workflow of IV Rank when direct implied volatility data is not available. It is excellent for context filtering and regime awareness, but it should not be interpreted as a true options market implied volatility feed.
Pine Script®指标