Instantaneous Trendline with Cloud Instantaneous Trendline with Cloud
Introduction & History
The Instantaneous Trendline was introduced by John Ehlers, a well-known figure in the field of technical analysis, particularly for applying digital signal processing concepts to financial markets. Ehlers aimed to create an indicator that reacts to market price changes more quickly than traditional moving averages, yet remains smooth enough to avoid excessive noise. By incorporating concepts from digital filtering, he devised a formula that calculates a trendline with minimal lag—hence the term “instantaneous.”
Purpose
The primary purpose of the Instantaneous Trendline with Cloud is to provide traders and analysts with a responsive, smoothed line that closely follows market price movements. Additionally, this script enhances the visual cues by adding a cloud fill to highlight bullish and bearish zones:
Trend Identification
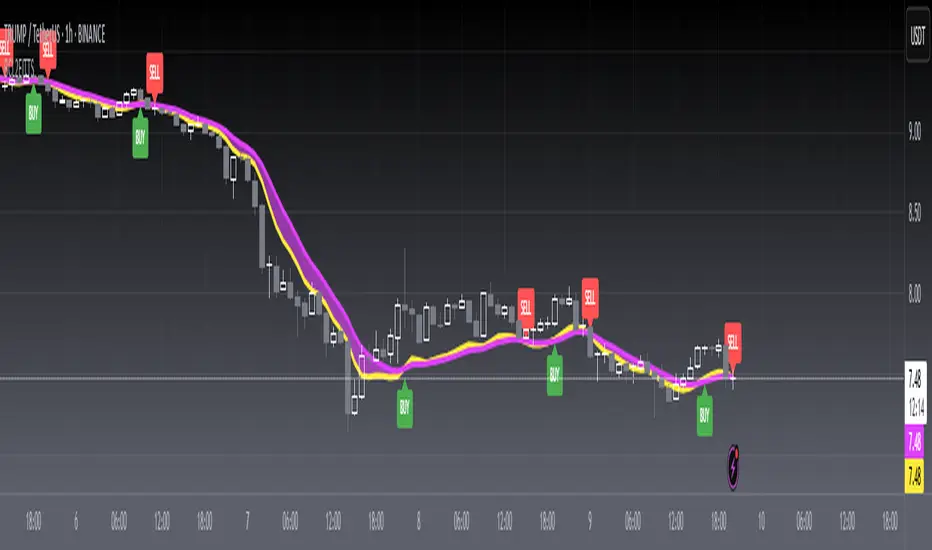
The ITL (Instantaneous Trendline) is plotted alongside the price. When price consistently stays above the ITL, it may signal an uptrend. Conversely, when price dips below the ITL, it can suggest a downtrend.
Signal Generation
Crossover points between the price and the ITL can serve as potential entry or exit signals. A bullish crossover (price moving above the ITL) often indicates the start of upward momentum, while a bearish crossover (price dropping below the ITL) may point to downward momentum.
Noise Reduction
By applying digital filtering concepts and smoothing through the alpha (smoothing coefficient), the ITL reduces noise while still responding relatively quickly to price changes. Traders can adjust alpha to make the trendline more reactive (higher alpha) or smoother (lower alpha).
Clarity via Cloud Fill
A color-coded cloud between the price and the ITL provides an at-a-glance view of market bias. The green cloud highlights potentially bullish phases, while the red cloud highlights potentially bearish phases.
Experiment with the alpha value (commonly between 0.2 and 0.3) to find a balance that suits your preference for responsiveness versus smoothness.
This indicator implements John Ehlers’ Instantaneous Trendline concept and plots a smoothed trendline (ITL) alongside the price. The trendline is controlled by a user-defined smoothing coefficient (alpha). A higher alpha makes the trendline respond more quickly to price changes, while a lower alpha produces a smoother line.
A color-filled cloud helps traders identify bullish and bearish conditions:
Green cloud if the price is above the ITL (bullish potential).
Red cloud if the price is below the ITL (bearish potential).
Key Benefits
Trend Visualization: Quickly see if the market is in an uptrend or downtrend based on the position of the price relative to the trendline.
Crossover Signals: Identify potential shifts in trend or momentum when the price crosses the ITL.
Customizable Sensitivity: Adjust the alpha parameter to make the ITL more or less reactive to price moves. Use this tool to better visualize short-term trend changes and potential entry/exit signals in conjunction with other technical analysis methods.
Instantaneoustrendline

[blackcat] L2 Ehlers Instantaneous Trendline Trading StrategyLevel: 2
Background
John F. Ehlers introuced Instantaneous Trendline Trading Strategy in his "Cybernetic Analysis for Stocks and Futures" chapter 3 on 2004.
Function
With the crossover strategy that Dr. Ehlers has developed it is possible to be on the wrong side of the trade for a substantial period from time to time. For this reason, Dr. Ehlers has added a rule that if the price goes against your position by more than some percentage, the strategy will correct itself and automatically reverse to the opposite position. The percentage is supplied as the input variable RevPct. RevPct is an optimizable parameter, but I find that the default
value of 1.5 percent (RevPct = 1.015) is a relatively robust number.
Key Signal
Trigger ---> Instantaneous Trendline fast line
ITrend ---> Instantaneous Trendline slow line
LimitBuy ---> limit buy price level which is triggered by gold cross
LimitSell ---> limit buy price level wich is triggered by dead cross
Pros and Cons
100% John F. Ehlers definition translation of original work, even variable names are the same. This help readers who would like to use pine to read his book. If you had read his works, then you will be quite familiar with my code style.
Remarks
The 23th script for Blackcat1402 John F. Ehlers Week publication.
Readme
In real life, I am a prolific inventor. I have successfully applied for more than 60 international and regional patents in the past 12 years. But in the past two years or so, I have tried to transfer my creativity to the development of trading strategies. Tradingview is the ideal platform for me. I am selecting and contributing some of the hundreds of scripts to publish in Tradingview community. Welcome everyone to interact with me to discuss these interesting pine scripts.
The scripts posted are categorized into 5 levels according to my efforts or manhours put into these works.
Level 1 : interesting script snippets or distinctive improvement from classic indicators or strategy. Level 1 scripts can usually appear in more complex indicators as a function module or element.
Level 2 : composite indicator/strategy. By selecting or combining several independent or dependent functions or sub indicators in proper way, the composite script exhibits a resonance phenomenon which can filter out noise or fake trading signal to enhance trading confidence level.
Level 3 : comprehensive indicator/strategy. They are simple trading systems based on my strategies. They are commonly containing several or all of entry signal, close signal, stop loss, take profit, re-entry, risk management, and position sizing techniques. Even some interesting fundamental and mass psychological aspects are incorporated.
Level 4 : script snippets or functions that do not disclose source code. Interesting element that can reveal market laws and work as raw material for indicators and strategies. If you find Level 1~2 scripts are helpful, Level 4 is a private version that took me far more efforts to develop.
Level 5 : indicator/strategy that do not disclose source code. private version of Level 3 script with my accumulated script processing skills or a large number of custom functions. I had a private function library built in past two years. Level 5 scripts use many of them to achieve private trading strategy.
[blackcat] L2 Ehlers Instantaneous TrendlineLevel: 2
Background
John F. Ehlers introuced Instantaneous Trendline (IT) in his "Rocket Science for Traders" chapter 10. Dr. Ehlers hope IT can enable us to compute a continuous trendline from which we can rapidly assess market action.
Function
blackcat L2 Ehlers Instantaneous Trendline (IT) is used to follow trend. IT is important because the dominant cycle component is always notched out. It follows that if the composite analytic waveform consists of only a trend component and a cycle component, and if we remove the cycle component, the residual must be the trend. Of course, this is not precisely true in reality, because there will always be components other than the dominant cycle present. However, this is a workable solution for trading purposes because the secondary cycles usually have a small amplitude.
Key Signal
Smooth --> 4 bar WMA w/ 1 bar lag
Detrender --> The amplitude response of a minimum-length HT can be improved by adjusting the filter coefficients by
trial and error. HT does not allow DC component at zero frequency for transformation. So, Detrender is used to remove DC component/ trend component.
Q1 --> Quadrature phase signal
I1 --> In-phase signal
Period --> Dominant Cycle in bars
SmoothPeriod --> Period with complex averaging
DCPeriod ---> Dominant Cycle Period
Trendline ---> IT fast line
SmoothPrice ---> IT slow line
Pros and Cons
100% John F. Ehlers definition translation of original work, even variable names are the same. This help readers who would like to use pine to read his book. If you had read his works, then you will be quite familiar with my code style.
Remarks
The 9th script for Blackcat1402 John F. Ehlers Week publication.
Readme
In real life, I am a prolific inventor. I have successfully applied for more than 60 international and regional patents in the past 12 years. But in the past two years or so, I have tried to transfer my creativity to the development of trading strategies. Tradingview is the ideal platform for me. I am selecting and contributing some of the hundreds of scripts to publish in Tradingview community. Welcome everyone to interact with me to discuss these interesting pine scripts.
The scripts posted are categorized into 5 levels according to my efforts or manhours put into these works.
Level 1 : interesting script snippets or distinctive improvement from classic indicators or strategy. Level 1 scripts can usually appear in more complex indicators as a function module or element.
Level 2 : composite indicator/strategy. By selecting or combining several independent or dependent functions or sub indicators in proper way, the composite script exhibits a resonance phenomenon which can filter out noise or fake trading signal to enhance trading confidence level.
Level 3 : comprehensive indicator/strategy. They are simple trading systems based on my strategies. They are commonly containing several or all of entry signal, close signal, stop loss, take profit, re-entry, risk management, and position sizing techniques. Even some interesting fundamental and mass psychological aspects are incorporated.
Level 4 : script snippets or functions that do not disclose source code. Interesting element that can reveal market laws and work as raw material for indicators and strategies. If you find Level 1~2 scripts are helpful, Level 4 is a private version that took me far more efforts to develop.
Level 5 : indicator/strategy that do not disclose source code. private version of Level 3 script with my accumulated script processing skills or a large number of custom functions. I had a private function library built in past two years. Level 5 scripts use many of them to achieve private trading strategy.
