SMC Post-Analysis Lab [PhenLabs]📊 SMC Post-Analysis Lab
Version: PineScript™ v6
📌 Description
The SMC Post-Analysis Lab is a dedicated hindsight analysis tool built for traders who want to understand what really happened during any historical trading period. Unlike forward-looking indicators, this tool lets you scroll back through time and instantly receive algorithmic classification of market states using Smart Money Concepts methodology.
Whether you’re reviewing a losing trade, studying a successful session, or building your pattern recognition skills, this indicator provides immediate context. The expansion-aware algorithm processes price action within your selected window and outputs clear, actionable classifications ranging from Parabolic Expansion to Consolidation Inducements.
Stop relying on subjective post-trade analysis. Let the algorithm objectively tell you whether institutional players were accumulating, distributing, or running inducements during your trades.
🚀 Points of Innovation
First indicator specifically designed for SMC-based post-trade review rather than live signal generation
Dual-mode analysis system allowing both dynamic scrollback and precise date selection
Expansion-aware classification algorithm that weighs range position against net displacement
Real-time efficiency metrics calculating directional quality of price movement
Integrated visual FVG detection within the analysis window only
Interactive table with clickable date range adjustment via chart interface
🔧 Core Components
Pivot Detection Engine: Uses configurable pivot length to identify significant swing highs and lows for structure break detection
Window Calculator: Determines active analysis zone based on either bar offset or timestamp boundaries
Data Aggregator: Tracks window open, high, low, close and counts bullish/bearish structure break events
State Classification Algorithm: Applies hierarchical logic to determine market state from six possible classifications
Visual Renderer: Draws structure breaks, FVG boxes, and window highlighting within the active zone
🔥 Key Features
Sliding Window Mode: Use the Scroll Back slider to dynamically move your analysis zone backwards through history bar-by-bar
Date Range Mode: Select specific start and end timestamps for precise session or trade review
Six Market State Classifications: Parabolic Expansion (Bull/Bear), Bullish/Bearish Order Flow, Accumulation/Distribution Reversal, and Consolidation/Inducement
Range Position Percentile: See exactly where price closed relative to the window’s high-low range as a percentage
Bull/Bear Event Counter: Quantified count of structure breaks in each direction during the analysis period
Efficiency Calculation: Net move divided by total range reveals trending quality versus chop
🎨 Visualization
Blue Window Highlight: Active analysis zone is clearly marked with blue background shading on the chart
Structure Break Lines: Dashed lines appear at each bullish or bearish structure break within the window
FVG Boxes: Fair Value Gaps automatically render as semi-transparent boxes in bullish or bearish colors
Dashboard Table: Top-right positioned table displays State, Analysis description, and Metrics in real-time
Color-Coded States: Each classification uses distinct coloring for immediate visual recognition
Interactive Tip Row: Optional help text guides users on clicking the table to adjust date range
📖 Usage Guidelines
General Configuration
Analysis Mode: Default is Sliding Window. Choose Date Range for specific timestamp analysis.
Sliding Window Settings
Scroll Back (Bars): Default 0. Increase to move window backwards into history.
Window Width (Bars): Default 100. Range 20-50 for scalping, 100+ for swing analysis.
Date Range Settings
Start Date: Select the beginning timestamp for your analysis period.
End Date: Select the ending timestamp for your analysis period.
Visual Settings
Show Help Tip: Default true. Toggle to hide instructional row in dashboard.
Bullish Color: Default teal. Customize for bullish elements.
Bearish Color: Default red. Customize for bearish elements.
SMC Parameters
Pivot Length: Default 5. Lower values (3-5) catch minor breaks. Higher values (10+) focus on major swings.
✅ Best Use Cases
Post-trade review to understand why entries succeeded or failed
Session analysis to identify institutional activity patterns
Trade journaling with objective algorithmic classifications
Pattern recognition training through historical scrollback
Identifying whether stop hunts were inducements or legitimate breaks
Comparing your real-time read versus what the algorithm detected
⚠️ Limitations
Designed for historical analysis only, not live trade signals
Classification accuracy depends on appropriate pivot length for the timeframe
FVG detection uses simple gap logic without mitigation tracking
State classification is based on window data only, not broader context
Requires manual scrolling or date input to review different periods
💡 What Makes This Unique
Purpose-Built for Review: Unlike most indicators focused on live signals, this is designed specifically for post-trade analysis
Expansion-Aware Logic: Algorithm weighs both position in range AND directional efficiency for accurate state detection
Interactive Date Control: Click the dashboard table to reveal draggable anchors for window adjustment directly on chart
🔬 How It Works
1. Window Definition:
User selects either Sliding Window or Date Range mode
System calculates which bars fall within the active analysis zone
Active zone receives blue background highlighting
2. Data Collection:
Algorithm captures window open, running high, running low, and current close
Structure breaks are detected when price crosses above last pivot high or below last pivot low
Bullish and bearish events are counted separately
3. State Classification:
Range Position calculates where close sits as percentage of high-low range
Efficiency calculates net move divided by total range
Hierarchical logic applies priority rules from Parabolic states down to Consolidation
4. Output Rendering:
Dashboard table updates with State title, Analysis description, and Metrics
Visual elements render within window only to keep chart clean
Colors reflect bullish, bearish, or neutral classification
💡 Note:
This indicator is intended for educational and review purposes. Use it to develop your understanding of Smart Money Concepts by analyzing what institutional order flow looked like during historical periods. Combine insights with your own analysis methodology for best results.
Journal

Custom Trade Checklist by [YSFX]# Custom Trade Checklist: Your On-Chart Trading Co-Pilot
## Overview
Ever taken a trade based on impulse, only to realize you forgot a key step in your analysis? The Custom Trade Checklist is a simple yet powerful on-chart utility designed to help you remain disciplined and consistent with your trading strategy.
By externalizing your trading plan into a visible, interactive checklist, you can reduce emotional decision-making and systematically verify your criteria before entering or exiting a trade. This tool acts as your personal co-pilot, ensuring you follow your rules on every single trade.
## Key Features
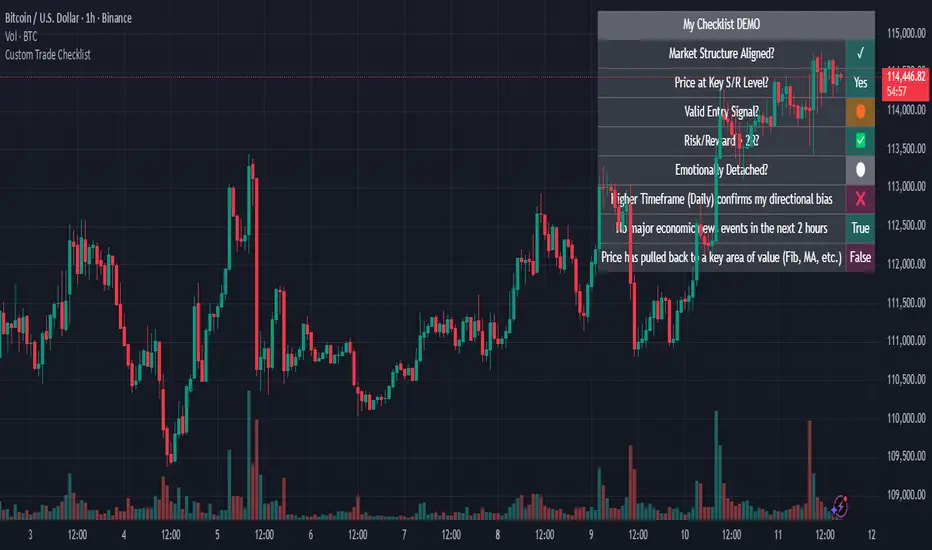
✅ Fully Customizable Rules: Define up to 10 unique checklist items tailored to your specific trading strategy. Examples include "Market Structure Aligned?", "RSI Oversold?", "News Events Checked?", or "Risk/Reward > 2:1?".
⚪ Dynamic Status Tracking: Use a simple dropdown menu in the settings to mark each rule with intuitive symbols like:
✅ / ✓ - Completed / True
❌ / ✕ - Failed / False
🟡 - Pending / Caution
⚪ - Neutral / Not Checked
And many more for complete flexibility.
📋 Clean & Minimalist Display: The checklist is presented in a clean, unobtrusive table that can be positioned in any corner of your chart, ensuring it provides guidance without cluttering your analysis.
⚙️ Flexible Configuration:
Choose the maximum number of entries to display.
Optionally hide disabled checklist items to keep your view focused on what's active.
Customize the table title to match your strategy (e.g., "Pre-Trade Checklist", "Swing Trade Rules").
🎨 Complete Color Control: Personalize every aspect of the table's appearance. You can independently set the colors for the title, text, background, border, and each individual status symbol to perfectly match your chart's theme.
## How to Use
Add the Indicator to your chart.
Open the Settings Panel by clicking the gear icon (⚙️) on the indicator.
Define Your Rules:
Go through Entry 1 to Entry 10.
For each rule you want to use, check the box to enable it.
In the text field, write your rule (e.g., "Price above 200 EMA").
Update Your Status: Before placing a trade, go back into the settings and update the status dropdown for each rule based on your analysis.
Customize Appearance:
Under the "General" tab, change the table title and position.
Under the "Colors" tab, adjust the colors to your liking.
## Who Is This For?
This tool is perfect for:
Discretionary Traders who need to enforce a consistent set of rules.
New Traders looking to build good habits and internalize their trading plan.
Systematic Traders who want a final pre-flight check before executing a trade.
Anyone working on improving their trading psychology and reducing impulsive actions.
This indicator does not generate signals or trading advice; it is a utility to support the trader's own process and discipline. We hope it helps you achieve greater consistency in your trading journey!
Ultra Trade JournalThe Ultra Trade Journal is a powerful TradingView indicator designed to help traders meticulously document and analyze their trades. Whether you're a novice or an experienced trader, this tool offers a clear and organized way to visualize your trading strategy, monitor performance, and make informed decisions based on detailed trade metrics.
Detailed Description
The Ultra Trade Journal indicator allows users to input and visualize critical trade information directly on their TradingView charts.
.........
User Inputs
Traders can specify entry and exit prices , stop loss levels, and up to four take profit targets.
.....
Dynamic Plotting
Once the input values are set, the indicator automatically plots horizontal lines for entry, exit, stop loss, and each take profit level on the chart. These lines are visually distinct, using different colors and styles (solid, dashed, dotted) to represent each element clearly.
.....
Live Position Tracking
If enabled, the indicator can adjust the exit price in real-time based on the current market price, allowing traders to monitor live positions effectively.
.....
Tick Calculations
The script calculates the number of ticks between the entry price and each exit point (stop loss and take profits). This helps in understanding the movement required for each target and assessing the potential risk and reward.
.....
Risk-Reward Ratios
For each take profit level, the indicator computes the risk-reward (RR) ratio by comparing the ticks at each target against the stop loss ticks. This provides a quick view of the potential profitability versus the risk taken.
.....
Comprehensive Table Display
A customizable table is displayed on the chart, summarizing all key trade details. This includes the entry and exit prices, stop loss and take profit levels, tick counts, and their respective RR ratios.
Users can adjust the table's Position and text color to suit their preferences.
.....
Visual Enhancements
The indicator uses adjustable background shading between entry and stop loss/take profit lines to visually represent potential trade outcomes. This shading adjusts based on whether the trade is long or short, providing an intuitive understanding of trade performance.
.........
Overall, the Ultra Trade Journal combines visual clarity with detailed analytics, enabling traders to keep a well-organized record of their trades and enhance their trading strategies through insightful data.

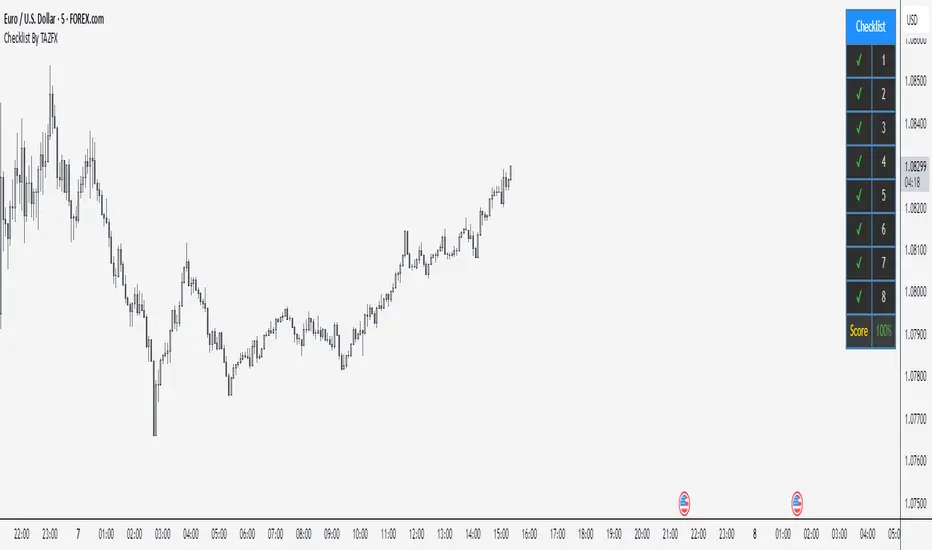
Checklist By TAZFX with Trade ScoreTrading Checklist is a customizable indicator designed for traders who want to stay disciplined and stick to their trading rules. Using this indicator, you can easily create and display your own personalized checklist of trading rules directly on your TradingView chart.
1. Customizable Settings:
• Positioning : Place the table in one of nine positions on the chart (e.g., bottom left, top right).
• Header : Modify the banner text, size, and color.
• Row Content : Define text for each row and control visibility.
• Appearance : Adjust text and background colors.
2. Checklist Table:
•Displays up to 8 rows with checkboxes (✅/❌) and custom labels for trade evaluation.
•Useful for tracking whether specific trade conditions or rules are met.
3. Trade Score Calculation:
•The Trade Score is a percentage that shows how many of your checklist items are checked compared to the total visible items.
Sticky Notes, Checklist, To-do, Journal [algoat]I forgot to bring my notes again...
Ever feel like your trading notes are all over the place, much like your portfolio after a market dip? Worry not! With this script, you'll have all your trading notes, tasks, and brilliant (or not so brilliant) ideas neatly organized right on your chart. It's like having a sticky note board, but way cooler and without the risk of paper cuts.
⭐ Features :
To-Do Lists
Keep track of tasks with satisfying checkmarks for those dopamine hits.
Journal Entries
Document your market insights, trade plans, or just random thoughts. "I forgot something" – we've all been there.
Due Dates
Never miss an important deadline again. Red alert for overdue tasks because procrastination is a trader's worst enemy.
Customization
Choose the size and position of your notes because one size doesn't fit all.
Perfect for the organized trader who loves a bit of fun or the chaotic one who needs a bit of structure. Embrace the power of notes and stay on top of your trading game!
══════════════════
🧠 General advice
Trading effectively requires a range of techniques, experience, and expertise. From technical analysis to market fundamentals, traders must navigate multiple factors, including market sentiment and economic conditions. However, traders often find themselves overwhelmed by market noise, making it challenging to filter out distractions and make informed decisions. By integrating multiple analytical approaches, traders can tailor their strategies to fit their unique trading styles and objectives.
Confirming Signals with other indicators
As with all technical indicators, it is important to confirm potential signals with other analytical tools, such as support and resistance levels, as well as indicators like RSI, MACD, and volume. This helps increase the probability of a successful trade.
Use proper risk management
When using this or any other indicator, it is crucial to have proper risk management in place. Consider implementing stop-loss levels and thoughtful position sizing.
Combining with other technical indicators
The indicator can be effectively used alongside other technical indicators to create a comprehensive trading strategy and provide additional confirmation.
Keep in mind
Thorough research and backtesting are essential before making any trading decisions. Furthermore, it's crucial to have a solid understanding of the indicator and its behavior. Additionally, incorporating fundamental analysis and considering market sentiment can be vital factors to take into account in your trading approach.
══════════════════
⭐ Conclusion
We hold the view that the true path to success is the synergy between the trader and the tool, contrary to the common belief that the tool itself is the sole determinant of profitability. The actual scenario is more nuanced than such an oversimplification. A word to the wise is enough: developed by traders, for traders — pioneering innovations for the modern era.
Risk Notice
Everything provided by algoat — from scripts, tools, and articles to educational materials — is intended solely for educational and informational purposes. Past performance does not assure future returns.
