SMC KZ NYThis script plots vertical lines on the chart to highlight KZ opens and closes based on New York time.
Key characteristics:
The indicator is plotted on the price chart (overlay).
It draws thin, dotted vertical lines at specific kz.
Killzones are calculated using the America/New_York timezone to ensure correct alignment.
Only weekdays (Monday to Friday) are considered.
The script draws sessions for today and up to one week back (maximum 7 calendar days).
All drawings are created once on the last bar to avoid duplicates and performance issues.
Each session has its own color for clear visual distinction:
Asia KZ(open)
London KZ (open and close)
New York / KZ Morning (open and close)
Lunch (open and close)
New York / KZ Afternoon (open and close)
The Asia KZ open at 20:00 NY is intentionally excluded on Fridays, as there is no valid Asia KZ start on Friday evening.
The vertical lines extend across the entire visible price range of the chart.
The script is optimized to stay well within TradingView object limits.
Purpose:
The indicator is designed to give traders a clean, non-intrusive visual reference for key KZ transitions, helping to analyze price behavior around killzones opens and closes without cluttering the chart.
Killzone
A+ Model - Cave EducationHere is a comprehensive and detailed explanation of the "A+ Model - Cave Education" Pine Script code.
This script is a sophisticated technical analysis tool designed for TradingView. It assists traders in identifying specific institutional time windows, price ranges (sessions), and "Macro" volatility periods based on the ICT (Inner Circle Trader) or similar time-based trading concepts.
Below is the breakdown of how the code functions, organized by its logic sections.
1. General Overview
The script is an overlay indicator (it sits directly on the price chart). Its primary purpose is to:
Highlight a specific trading session (The "A+ Box") and mark its High/Low.
Mark key institutional times (07:00 NY and 09:30 NY Open).
Identify "Macro" windows (specific 20-minute periods where algorithms are active) and draw dynamic ranges around them based on volatility (ATR).
Project future times onto the chart to help the trader prepare for the next day.
2. Settings & Inputs (User Configuration)
The code begins by defining a vast array of user inputs, grouped for better usability:
General Time & Box: Allows the user to define the "A+ Session" time (default 20:00-00:00) and the Time Zone (UTC-5/New York). It also handles the visual style (colors) of the session box.
Visibility: A crucial performance and visual clutter setting. boxDays limits how far back the A+ boxes and time lines are drawn (default 14 days). Macros are strictly limited to the current week to prevent chart lagging.
Line & Text Controls: Every visual element (A+ lines, NY markers, Macros) has toggles (input.bool) to show/hide the lines or the text labels separately.
Macro Settings: Defines the time windows for three separate macros and an ATR Multiplier. The ATR multiplier determines how wide the channel lines are drawn around the macro price action.
3. Logic Breakdown by Section
Section 1: The "A+ Draw" Box (Session Range)
This is the core of the A+ Model.
Logic: The script checks if the current bar is within the user-defined sessionTime.
Box Creation:
When the session starts, it initializes a new Box (box.new).
Throughout the session, it continuously updates the Box's Top (Highest High) and Bottom (Lowest Low) to encompass the full range of that time period.
Extension Lines (Support/Resistance):
Once the session ends, the script draws two horizontal lines: one from the Session High and one from the Session Low.
Smart Break Logic: These lines are active (highActive, lowActive). They extend to the right until the price breaks them (High line is broken by a higher price, Low line by a lower price). This helps traders see if the session range is being respected or broken later in the day.
Section 2: Time Lines (NY Midnight & Open)
This section marks vertical reference points.
It checks for specific times: 07:00 and 09:30 (in the user's timezone).
If the current bar matches these times, it draws a vertical line (line.new) covering the High/Low of that bar and places a label (e.g., "NY." or "09:30") above it.
This helps the trader orient themselves regarding the New York session Open and the "Killzone" start.
Section 3: Macros (Volatility Windows)
This is the most complex calculation in the script.
Definition: Macros are specific time windows (e.g., 09:50–10:10) where price delivery is often accelerated.
Visibility Rule: To keep the script fast, this only runs if isCurrentWeek is true.
ATR Offset: The script calculates the Average True Range (ATR). It uses this to create a "channel" around the price.
Drawing Logic:
When a Macro time starts, the script tracks the Highest High and Lowest Low inside that specific 20-minute window.
It draws parallel horizontal lines above and below these prices.
The Twist: The lines are not drawn at the High/Low. They are offset by ATR * Multiplier. This creates a wider "zone" around the macro price action, visually indicating a volatility range.
Section 4: Future Projection (Tomorrow)
This feature is for planning ahead.
It runs only on the last bar of the chart (barstate.islast).
It calculates the timestamps for the next occurrence of the key times (07:00, 09:30, and all three Macros).
It draws vertical lines into the future (empty space on the right of the chart).
Benefit: The trader can see exactly where 09:30 or the next Macro will occur on the timeline before the candles even print.
4. Helper Functions
The code uses custom functions to keep the logic clean:
f_drawFuture(...): A standardized function to draw the future vertical lines and labels so the code doesn't have to repeat itself for every single time marker.
isStartTime(...) & isInTime(...): Shorthand functions to check if the current candle belongs to a specific session string (like "0950-1010").
Summary of Improvements in this Version
Compared to a standard indicator, this script is highly optimized:
Text Control: You can turn off text labels while keeping the lines (or vice versa).
Performance: It limits historical drawing (only 14 days back for boxes, only this week for macros) to prevent "Maximum Line Count" errors in Pine Script.
Visual Clarity: It uses different colors for different Macros (Blue, Red, Orange) to make them instantly distinguishable.

Đại Ka 3 ATR BandsĐại Ka 3 ATR Bands – The ultimate single-slot indicator that replaces three separate ATR plots.
Designed specifically for ICT/SMC traders in 2025:
• Light red band (±0.5 ATR) → fake moves, Judas Swing, Turtle Soup zone
• Gray band (±1.0 ATR) → normal price action
• Light green band (±2.0 ATR) → real displacement zone → Silver Bullet, SFT, high-probability entries
How to use:
– Price stuck inside red band → expect reversal/fakeout
– Price breaks and closes outside green band + volume spike → enter aggressively in that direction (85%+ win-rate inside Killzones)
Default ATR(14), subtle fills for instant visual filtering of real vs fake moves.
Perfect companion for Order Blocks, FVG, Breaker Blocks and NY/London Killzones.
Free forever – coded with love by Đại Ka & Vietnamese ICT crew.

Thiru-KillzonesThiru Killzones - Advanced Trading Session Indicator
Overview
Thiru Killzones is a comprehensive trading session indicator designed to help traders identify and analyze key market sessions throughout the trading day. It visualizes five major trading sessions (Asia, London, NY AM, Lunch, NY PM) with customizable opening range analysis, target levels, and statistical tracking.
Key Features
📊 Trading Sessions
5 Major Sessions: Asia, London, NY AM, Lunch, NY PM
Customizable Times: Configure each session's start and end time
Individual Colors: Each session can have its own color
Enable/Disable: Turn sessions on/off individually
Session Extension: Extend sessions beyond normal hours (especially useful for Asia session)
📈 Opening Range Analysis
Configurable Duration: Set opening range period (default: 60 minutes)
Breakout Flags: Visual indicators when price breaks target levels
Target Visualization: Optional boxes and lines at target levels
Performance Tracking: Statistics table showing hit rates for each target level
🎨 Visual Styles
Choose from 4 unique visual styles:
Frame: Full box with borders (default)
Shade: Background fill only (no borders)
Horizon: Horizontal lines marking session boundaries
Rails: Horizontal lines with vertical orientation option
🏷️ Labels & Display
Customizable Labels: Show session name, day, price range, or pips
Flexible Positioning: Top/Bottom/Center, Inside/Outside, Left/Center/Right
Auto-hide on Daily+: Automatically hides labels on daily timeframe and higher
Multiple Sizes: Auto/Tiny/Small/Normal/Large/Huge
📊 Statistics & Analysis
Session Statistics Table: Compare current session range vs average
Value Format: Display as Price or Pips
⚙️ Advanced Settings
Timezone Support: 27 timezone options (GMT-11 to GMT+12)
Timeframe Filtering: Hide indicator on higher timeframes
History Control: Control how many historical sessions to display
Unified Colors: Option to use same color for all sessions
Transparency Control: Separate transparency for boxes and borders
Border Customization: Solid/Dash/Dot styles with adjustable width
How to Use
Basic Setup
1. Add the indicator to your chart
2. Configure your timezone in Settings
3. Enable the sessions you want to track
4. Customize colors and visual style
Opening Range Analysis
1. Enable "Opening Range" for desired sessions
2. Set the duration (default: 60 minutes)
3. Enable target lines/boxes to see R1/R2/S1/S2 levels
4. Enable breakout flags to see when price breaks levels
5. Enable data table to track statistics
Session Extension
1. Enable "Extended Range" for sessions that cross midnight (like Asia)
2. The indicator automatically calculates the session end time
3. Opening range lines will stop exactly at session end time
Customization
- Use "Visual Style" section to change box appearance
- Use "Labels" section to customize label display
- Use "Unified Colors" to apply same color scheme to all sessions
- Adjust transparency for cleaner chart appearance
Default Session Times
- Asia: 18:00-00:00 (crosses midnight)
- London: 02:00-05:00
- NY AM: 08:30-10:00
- Lunch: 12:00-13:00
- NY PM: 13:30-16:00
*Note: Times are in your selected timezone*
Tips
- Use "History Periods" to control how many past sessions are displayed
- Enable "Hide on Daily+" for labels to keep daily charts clean
- Use "Current Only" in opening range to show only active session
- Enable statistics tables to track session performance over time
- Use session extension for Asia session to properly handle midnight crossover
Attribution
This indicator uses the following community libraries:
- boitoki/AwesomeColor/9 (color utilities)
- boitoki/Utilities/11 (utility functions)
All enhancements and features are original implementations.
Support
For questions or issues, please contact me @thirudinesh through TradingView.
---
© 2025 thirudinesh

Session Engine — Market Opens, Killzones & Levels — SMC/ICTSession Engine — Market Opens, Killzones & Institutional Levels (Tokyo • London • New York) — SMC/ICT — TradingATH (PueblaATH)
Precision. Sessions. Structure.
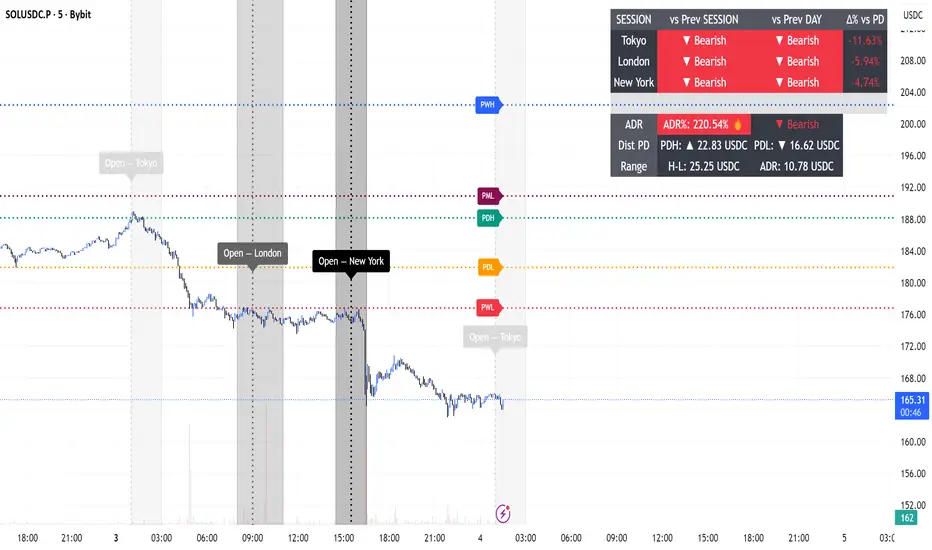
Session Engine maps the institutional heartbeat of the day across Tokyo , London , and New York . It draws timezone-accurate Market Open Lines , clean Killzones (incl. London–NY overlap), and a rock-solid, timeframe-safe suite of Previous High/Low Levels (PDH/PDL/PWH/PWL/PMH/PML). On top, a compact Session Comparison Table with an integrated ADR panel shows extension, momentum context, and distance to key levels — at a glance.
Designed for SMC/ICT Traders who demand clarity and reliability, this tool stays stable when you change timeframe, reload, or zoom.
Map the day like a Pro : timezone-true Opens, configurable Killzones, TF-safe PDH/PDL/PWH/PWL/PMH/PML , and a sleek ADR panel beneath a Session Comparison Table . Built for precision SMC/ICT Execution . Zero flicker, full control.
Why Traders Love It
Timezone-Accurate Session Engine — Tokyo, London, New York opens and the London–NY overlap, all resolved to bar-time for precise plotting on any symbol.
Killzones you can trust — choose full-column height or price-bounded height with custom top/bottom tick offsets and label placement.
Bulletproof Previous Levels — PDH, PDL, PWH, PWL, PMH, PML are cached and only refresh on true D/W/M boundaries, eliminating the classic “levels disappear on TF change” problem.
Actionable Context — a compact Session Comparison Table (vs previous session & vs previous day) plus an ADR panel with extension thresholds, distance to PDH/PDL, and current H-L range.
Serious Customization — dotted/solid lines, widths, label size & alignment, auto label backgrounds, block transparency, weekend & timeframe filters, and more.
Performance-Minded — persistent objects are updated in place (not spam-created) to keep your chart crisp and responsive.
What You’ll See
Market Opens — Vertical opens for TOK/LDN/NY with dotted/solid styling, width control, infinite or bounded height, and optional labels.
Killzones + Overlap — Transparent time boxes for session windows (and London–NY overlap). Optional labels, adjustable transparency, and height mode.
Institutional Levels — PDH / PDL / PWH / PWL / PMH / PML with length modes: Infinite, N bars, or End of day. Optional labels with typographic control.
Session Comparison Table — For each session: bias vs previous session and previous day, with optional Δ% column.
ADR Panel — 24h rolling ADR% consumption with two attention thresholds, distance to PDH/PDL (price units), and current H-L range.
How It Works
Session Timing uses explicit IANA timezones (Asia/Tokyo, Europe/London, America/New_York) then anchors to bar_time for pixel-perfect placement.
Killzones are persistent boxes that reset only on daily change, preventing redundant object creation.
Previous Levels are requested once per true period roll (D/W/M) and stored locally; this cache keeps lines stable when switching TFs or reloading charts.
Level Line Length is enforced per-object (Infinite, N bars, End of day) with dynamic x2 handling — no redraw flicker.
ADR uses a timeframe-agnostic 24h rolling window for H/L/range; ADR length is defined in “days” and mapped to bars for any timeframe.
How to Use
Set Session Times (defaults are standard). Adjust the London–NY overlap if your venue differs.
Style your Opens & Killzones — line width, dotted/solid, infinite or bounded height, label font size/align/background.
Choose Level Behavior — Infinite, N bars, or End of day for PD/ PW / PM lines; toggle labels as needed.
Read the Table and ADR — quick bias vs previous session/day, Δ% if you enable it; ADR panel highlights extension with blink thresholds and shows live distance to PDH/PDL.
Inputs
Schedules — Open times + killzone windows for TOK/LDN/NY, and London–NY overlap.
Style — Line width, dotted/solid, label sizes & alignment, auto backgrounds.
Heights — Infinite or tick-bounded line height; full-column or tick-bounded killzones.
Levels — Show/hide PDH/PDL/PWH/PWL/PMH/PML; length mode; label options.
Table & ADR — Font size, arrows, Δ% column, ADR length (days), blink thresholds, show/hide rows.
Filters — Hide visuals on specified timeframe ranges; optional weekend suppression.
Best Practices
Use “End of day” for tidy level lines that still convey right-hand context.
Set ADR thresholds to your instrument’s personality (e.g., 80/120 for FX, 100/150 for crypto).
On exotic trading sessions, verify the IANA timezone alignment and tweak inputs accordingly.
If you stack many tools, consider disabling unused sessions/rows to stay within object limits.
What Makes It Original
A cohesive Session Engine architecture that unifies timezone-true Opens, configurable Killzones/Overlap, and TF-safe previous levels — tailored for SMC/ICT execution.
Robust caching that eliminates TF-switch flicker and preserves dependent calculations (distance to PDH/PDL, ADR%) without gaps.
A unified ADR panel directly under the session table with real-time extension signaling and distance-to-PDH/PDL — pragmatic, trade-ready context you won’t find in generic session scripts.
Deep length & typography controls so visuals are informative and elegant.
Notes & Disclaimer (Originality & Rights)
Original Work Notice — Please read — This script/indicator is an original work created exclusively by TradingATH ( PueblaATH ). It is not derived from, copied from, or authored by any other person or entity. Any resemblance to other scripts is coincidental and limited to the use of public and widely known trading concepts.
Usage & Publication — Redistribution, cloning, or republishing this script (in whole or in part) without the explicit written permission of TradingATH ( PueblaATH ) is prohibited. By using this tool, you acknowledge the author’s exclusive authorship and associated rights.
No Financial Advice — This tool is for educational/informational purposes only and does not constitute financial advice. Markets carry risk; manage your risk and make your own decisions.
ICT Killzones Pro Suite — ICT & SMC Indicator with AlertsThe ICT Killzones Pro Suite is a complete ICT and Smart Money Concepts (SMC) indicator that brings together the most important institutional concepts into one single tool.
Instead of manually drawing sessions, structure breaks, liquidity levels or imbalances, this ICT indicator for TradingView automatically plots them with precision and full customization.
It is widely used by traders in Forex, Indices, Crypto and Commodities who want to study market structure the same way institutions do.
🔎 Features
✅ Killzones (Asia, London, New York)
Session boxes with customizable colors
50% midline level for equilibrium reference
Real-time status display (“In Killzone” / “Out of Killzone”)
✅ Equal Highs & Equal Lows (Liquidity zones)
Automatic detection of EQH/EQL
Equality tolerance parameter
Zone expiry (bars)
Rejection filter (2 consecutive closes)
Option to show only the latest active EQH/EQL
✅ Break of Structure (BOS) & Market Structure Shift (MSS)
Detects continuation (BOS) and reversal (MSS) structures
Customizable line styles and colors
“Body only” or “Body/Wick” break modes
Option to show only the latest signals
✅ Open Price Range (OPR)
Institutional daily open level in UTC
Historical OPR memory for backtesting
Optional labels for quick identification
✅ Previous Highs and Lows
Daily (PDH/PDL), Weekly (PWH/PWL), Monthly (PMH/PML)
Full label system
Customizable line width/style
Breakout alerts for each level
✅ Fair Value Gaps (FVGs)
Automatic imbalance detection
Wick or body detection modes
Highlighted imbalance candles in yellow
✅ Alerts Engine
One global alert condition
Modular alerts:
• Killzone opens/closes
• EQH/EQL created or broken
• BOS/MSS bullish & bearish signals
• Previous Highs/Lows breakouts
• FVGs
⚙️ Parameters Explained
Killzones: start/end times in UTC, colors, extension lines, 50% midline
EQH/EQL: tolerance (0 = strict equality, >0 = margin allowed), expiry age (bars), rejection filter, body/wick break type, latest only toggle
BOS/MSS: swing bars (pivots), body vs wick detection, line styles & widths, only-latest option
OPR: exact UTC time (HH:MM), history toggle, label size/color
Previous Highs/Lows: daily/weekly/monthly levels, line styles, label settings, breakout alerts
FVGs: wick vs body detection, candle highlight color
Alerts: global condition + per-module toggles (sessions, liquidity, BOS/MSS, FVG)
Every parameter is fully customizable, making this SMC indicator adaptable to any trading style or timeframe.
📌 Why use this ICT & SMC indicator?
Saves time by automating repetitive tasks
Provides an institutional framework directly on charts
Keeps analysis structured and consistent
Optimized for intraday scalping and swing trading
⚠️ Disclaimer
This script is for educational purposes only. It does not guarantee profits or predict markets with certainty. Always use proper risk management.
🔑 Access
This is an invite-only script on TradingView.
Click Request Access on this page to apply.

1H Open Level System-Lomeli indicatorsThis level system is a objective way of getting precise levels! Used by some of the trading goats

ICT Killzones x FVGs @dancizyeaaICT Killzones x FVGs Indicator
Last update: 19-SEP-2025
Creator: dancizyeaa
This indicator targets key session highs and lows combined with Fair Value Gaps (FVGs) visualization on TradingView charts. It integrates multiple market sessions (Asia, London, New York), drawing killzones, session separators, and key price levels with user-configurable alerts and filtering. It supports dynamic timeframe limits, coloring by FVG size, moving averages, and labels.
The ICT Killzones x FVGs indicator highlights major session high and low price zones with added fair value gaps, assisting traders in identifying potential reversal or breakout areas. It automatically draws session lines, pivot points, and dynamically colors FVG rectangles by size. It includes options for timezone offsets, alert setups for pivot breaks, and versatile visual configuration for clear session segmentation and market structure awareness.
Detailed Function Descriptions
Session Time and Date Handling:
Manages time offsets and date components to correctly align session boundaries and day separators considering timezone differences, including a weekday naming system for chart labeling.
FVG Detection and Coloring:
Detects bullish and bearish Fair Value Gaps based on recent candles, calculates gap size, and colors gaps differently if they are small or normal size to highlight relevant market inefficiencies.
Killzone (Session High/Low Zone) Management:
Creates and updates boxes, lines, and labels representing important market session zones from Asia to New York, including the ability to extend or limit these objects across timeframes and manage range averages.
Pivot Points and Midpoint Labels:
Draws session-specific pivot highs/lows and optional midpoint lines with alert conditions when these levels are broken, allowing traders to track and be notified of key market moves.
Session Separators and Open Lines:
Draws vertical and horizontal lines marking daily, weekly, and monthly open prices and session start/end boundaries with customizable styling, enhancing chart structure clarity.
Moving Average Overlay:
Optionally plots a user-defined simple moving average line for trend analysis, with customizable length and color.
Alert System:
Provides user-configurable alerts on pivot breaks and other key events, ensuring timely trading signals.
User Inputs and Settings:
Extensive input options to customize timezone offset, session visibility, line styles, transparency, label sizes and positions, and filter parameters for FVGs for a tailored trading experience.

NX - ICT Kill ZonesThis indicator highlights the three main ICT Kill Zones — Asian, London, and New York — directly on your chart using New York time (UTC‑4 with automatic DST adjustment).
Each zone is color‑coded for quick visual reference and only appears on intraday timeframes of 1 hour or less. The tool helps traders quickly identify high‑probability trading windows aligned with institutional market activity.

KILLZONE & CHECK LIST ICAKILLZONE & CHECK LIST ICA | The Inner Circle Alchemist
✨ Features:
Display of precise trading killzones on the chart
Marking the high, low, and mid-level of each killzone
Option to show/hide killzone names
Daily separators at custom times (e.g. 17:00 or 00:00)
Highlighting Midnight Open, 8:30 Open, and New York Stock Exchange Open
Display of previous day, week, and month highs & lows (optional)
A clean and practical trading checklist on the bottom-right of the chart
Visual customization, such as showing your name/brand on the chart
Clear indication of weekdays
⚡️ A perfect mix of professional tools & visual style to keep you one step ahead!
ID on All Platforms: TheInnerCircleAlchemist
#Forex #Trading #Indicator #Killzone #TradingChecklist #PriceAction #DayTrading #SwingTrading #SmartMoney #MarketStructure #TradingTools #ChartAnalysis #TechnicalAnalysis #ForexStrategy #TraderLife #ForexTrading

Killzone za Forex - @mladja123This indicator marks the Kill Zones for Forex pairs, identifying the most active trading sessions and price areas with increased volatility. It allows traders to focus on high-probability trading windows, improving timing for entries, exits, and trade management in the Forex market.

Forex Sessions(IST)📌 Forex Sessions (IST Version)
This indicator highlights the four major Forex market sessions — Asia, Frankfurt, London, and New York — automatically adjusted to Indian Standard Time (IST).
Session Timings in IST:
Asia: 02:30 – 10:30
🇩🇪 Frankfurt: 11:30 – 12:30
🇬🇧 London: 12:30 – 21:30
🇺🇸 New York: 17:30 – 02:30 (next day)
Trading Advantages:
Asia session → Spot the range high/low
Frankfurt → Detect inducement moves
London → Identify the main push/trend move
New York → Catch reversals & profit taking
Features:
Clean session highlights with custom colors
Optional tools: range, trendlines, mean, VWAP, max/min levels
Adjustable transparency and display settings
With this, you can easily track session overlaps, volatility shifts, and trade setups — all aligned with IST Forex timings.
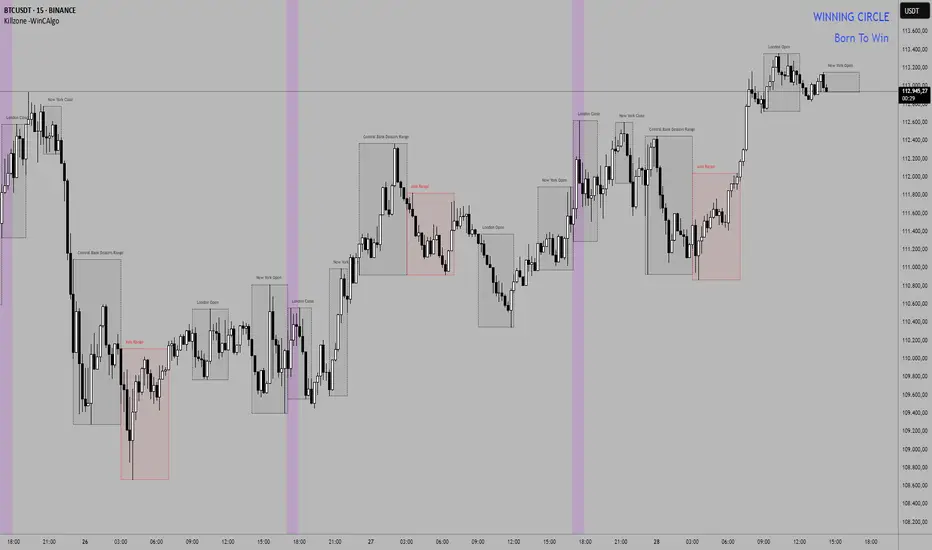
Killzone -WinCAlgoWhat is this Indicator?
The Killzone Trading Sessions Indicator is a comprehensive tool designed to identify and visualize the most important trading sessions across all financial markets. This indicator highlights key timeframes when institutional traders and market makers are most active, creating high-probability trading opportunities in stocks, crypto, commodities, and indices.
How to Use:
- Session Boxes: Each colored box represents a trading session's high and low range
- EQ-OTE Levels: Look for price reactions at 50% and 70% levels within sessions
- Silver Bullets: Purple background highlights high-probability reversal times
- CBDR Analysis: Use deviation levels to identify potential breakout targets
Trading Strategy:
- Wait for price to enter a killzone session
- Look for liquidity sweeps at session highs/lows
- Enter trades at EQ-OTE levels with proper risk management
- Use Silver Bullet times for precise entry timing
- Target deviation levels for profit-taking
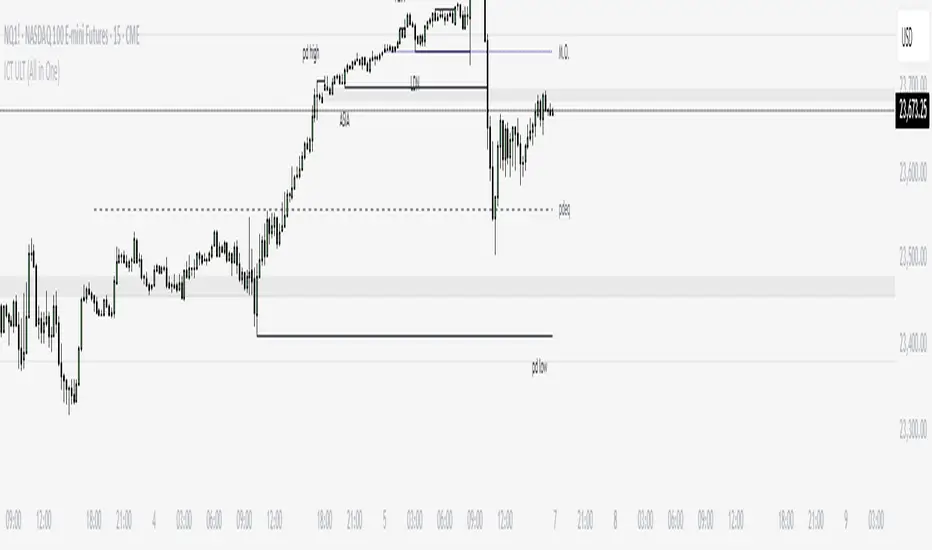
ICT ULT
This indicator is for lazy people like me who want to automate the process of marking certain ICT key levels using the indicator's features, such as:
Custom Killzone/Session Liquidity Levels in form of Highs and Lows
Killzone Drawings (Boxes)
Previous Day High/Low (PDH/PDL)
Previous Day Equlibrium (PDEQ)
Previous Week High/Low
New Day/Week Opening Gaps (NDOG/NWOG)
Custom Opening Prices (horizontal) (e.g. Midnight Open)
Custom Timestamps (vertical)
*Note: All features are completely customizable
inspired by: @tradeforopp
Bardhi's ICT Killzone & PivotsThis indicator is a complete ICT-style session and liquidity toolkit designed for precision trading. It automatically marks the most important trading windows (“Killzones”) and provides powerful tools for tracking price action around them.
Key Features:
Killzones: Automatically plots Asia, London, and New York (AM, Lunch, PM) sessions with customizable colors, transparency, and labels.
Session Highs, Lows & Midpoints: Dynamic lines for killzone highs/lows, optional midpoints, and alerts when levels are broken.
Range Statistics: Displays the real-time range of each session plus rolling averages in a customizable table.
Day / Week / Month Levels: Plots opens, highs, lows, and separators for higher-timeframe reference points with optional alerts.
Custom Opening Prices: Define up to 8 custom open lines (e.g., True Day Open, 06:00, 10:00) with cutoff times.
Vertical Timestamp Lines: Highlight important intraday times such as news events or personal strategy triggers.
Day-of-Week Labels: Clean labels for each day, with the option to hide weekends.
Full Customization: Adjustable label sizes, colors, line styles, transparency, and drawing limits.
Why Use It?
This tool combines killzone sessions, pivots, higher-timeframe opens/highs/lows, and range statistics into one clean, automated package. It saves time drawing manually, keeps charts organized, and helps traders apply ICT concepts consistently.

Session Volatility MonitorOverview
Session Volatility Monitor is a versatile volatility indicator tailored for intraday and session-based trading. It computes the average maximum price deviation (either up or down) from the session's opening price over a user-specified number of prior days, providing insights into expected "room to move" in the current session. This helps traders gauge potential exhaustion points, set realistic targets or stops, and identify when a directional move has reached historical norms (flagged as "REACHED" with the exact price level).
Displayed via a customisable table and optional horizontal target lines, it's ideal for markets like forex, crypto, futures, or stocks where session volatility matters. The indicator supports custom sessions with timezone adjustments, making it adaptable to global trading hours (e.g., London, NY, or Asia kill zones). For assets with small tick sizes (e.g., forex pairs at 0.0001), a multiplier scales values for readability (e.g., showing pips as 67.0 instead of 0.00670).
Key Features
Session-Based Calculations:
Defines sessions via presets (e.g., "NY Kill Zone: 07:00-10:00") or custom HHMM-HHMM inputs. (please note that preset sessions are mainly for futures e.g. "Full Day18:01-17:00", but also can be useful for forex and crypto)
Adjustable UTC offset (e.g., -5 for ET) to align with your asset's timezone—ensures accurate detection regardless of TradingView's UTC internal clock.
Tracks the max one-sided move (high - open or open - low) per session, averaging over 1–N previous days (default: 14).
Table Display:
Avg Max Move: Historical average deviation, labeled with days averaged and session time.
Current Move: Real-time displacement from session open (positive for up, negative for down).
Room to Go Up/Down: Remaining distance to reach the average, updating live; appends "REACHED (price)" if hit during the session.
Customisable: Text color, font size (tiny to huge), position (e.g., bottom_left), and value scaling via multiplier/decimal places.
Target Lines:
Optional horizontal lines at "Up Target" (open + avg move) and "Down Target" (open - avg move).
Lines start at the session open bar and extend only through the session duration (e.g., stops at 12:00 for a 07:00-12:00 session)—no further projection post-session.
Fully customisable: Toggle on/off, color, style (solid/dotted/dashed), width, label text/background.
Display Adjustments for Forex/Crypto:
Multiplier: Scales raw values (e.g., set to 10000 for EURUSD to show pips like 45.0 instead of 0.0045).
Decimals: Controls precision (0–5 places) for table values.
How to Use
Add to Chart: Search for "Session Volatility Monitor" in TradingView's indicators and apply to your symbol (e.g., EURUSD for forex, NQ1! for futures, BTCUSD for crypto).
Configure Settings:
Select a session preset or custom range; adjust UTC offset if needed (e.g., +0 for UTC symbols like crypto).
Set "Number of Previous Days to Average" (e.g., 14 for a two-week look back).
For small-tick assets, set Multiplier (e.g., 100 for crypto points, 10000 for forex pips) and Decimals (e.g., 0 for whole numbers).
Customise table position/size/color and target lines for visibility.
Interpret Outputs:
Monitor the table for "room to go"—if Room Up is low/negative, upside might be limited; "REACHED" signals a potential reversal or exhaustion.
Use target lines as visual S/R levels; they auto-start at session open and halt at close.
Combine with price action, volume, or other indicators for entries (e.g., buy near down target if bullish bias).
Example Scenario:
Forex (GBPUSD, 1-min): Set session to "London Kill Zone: 02:00-05:00" (UTC+0), multiplier=10000. Table shows pips; lines mark expected highs/lows.
Limitations and Tips
Historical Data Limits: Averages are capped by TradingView's bar history (e.g., ~14 days on 1-min for free plans). Upgrade for deeper look backs or use higher timeframes.
Session Accuracy: Ensure UTC offset matches your chart—test with the "In Session" plot (enable in Style tab, zoom y-axis if columns are tiny).
No Alerts/Signals: Purely informational; add custom alerts via TradingView for "REACHED" conditions.
Performance: On very low timeframes with long sessions, lines might consume line limits (max ~50)—toggle off if needed.
Tips: For crypto/forex, experiment with multiplier to match your preferred units (e.g., points vs. decimals). Hide debug plot in Style tab for clean charts. If "REACHED" doesn't trigger, verify on historical data where moves exceed averages.
This tool draws from concepts like Average Daily Range but focuses on directional, session-specific volatility for precise intraday decision-making. Feedback welcome!
Disclaimer
This indicator is for educational purposes only and does not constitute financial advice. Always consult a professional before trading.

Daily 6 AM & 8 AM CST Linesit help so you can figure out 6am and 8am on cst time in americas very fast.

Intraday Pivot Highs & Lows (Asia London NY)Intraday Pivot Highs & Lows (Asia London NY)
Script Description
This TradingView indicator is optimized for Forex, scalping, intraday, and day trading strategies. It accurately plots Pivot Points and levels, high/low, support and resistance levels. These are clearly identified to aid the trader during killzone sessions and session opens. Ideal for scalp trading, intraday sessions, and leveraging SMT (Smart Money Techniques). Utilize these Price Levels effectively during London Open, NY Open, and the Asia Session, utilizing Market Structure to pinpoint key levels and reversal zones for successful trading. Improve your Trade Setups, recognize reliable Chart Patterns, identify critical Price Pivots, and trade confidently off Institutional Levels.
This script marks the intraday pivot highs, lows and midpoints retracement levels for
Asia
London
New York
It also plots the previous day's high, low, midpoint, and 0.618 Fibonacci retracement levels, providing traders with critical price reference points for making intraday trading decisions.
Originality & Usefulness
This indicator uniquely integrates pivot calculations across three major Forex sessions (Asia, London, NY), clearly delineating session boundaries.
It enhances visibility by using distinct styling
solid for New York
dashed for London
dotted lines for Asia
And colour co-ordinated labeling, improving traders' ability to identify important intraday price action zones efficiently. Unlike standard pivot indicators, this script emphasizes session-specific trading dynamics.
### Key Features ###
Session-Based Levels: Automatically plots high, low, midpoint, and Fibonacci (.618) levels for each major session (Asia, London, NY).
Distinct Visual Cues: Lines and labels use session-specific styles and colors to easily differentiate between sessions.
Previous Day Reference: Clearly plots and labels yesterday's high, low, midpoint, and Fibonacci levels.
Flexible Visibility: Traders can set timeframe visibility to maintain clean charts on higher timeframes.
### How It Works
At the start of next day's session, previous session lines are cleared, ensuring the chart remains uncluttered.
High, low, midpoint, and Fibonacci retracement levels (.618) are dynamically calculated and displayed at the close of each session.
All session levels remain visible until the start of the next respective session, providing continuous actionable insights.
Trading Application:
Session highs and lows act as strong intraday support and resistance zones.
Midpoints and Fibonacci levels are effective for identifying potential reversal zones and retracements.
Daily levels provide a broader context, useful for gauging intraday volatility and range.
### Limitations and Considerations ##
Best used on liquid assets with clear session-based price action, such as Forex major pairs, if used on indexes make sure they contain 24 hour price action not just New York session.
This indicator is designed to streamline intraday trading by clearly marking essential pivot points and session-based levels, significantly improving traders' market context and decision-making accuracy. Can be used to enhance SMT decision making when scalping killzones.

Trading Sessions [BigBeluga]
This indicator brings Smart Money Concept (ICT) session logic to life by plotting key global trading sessions with volume and delta analytics. It not only highlights session ranges but also tracks their midpoints — which often act as intraday support/resistance levels.
🔵 KEY FEATURES
Visual session boxes: Plots boxes for Tokyo, London, New York, and Sydney sessions based on user-defined UTC+0 time ranges.
Volume & delta metrics: Displays total volume and delta volume (buy–sell difference) within each session.
Mid, High & Low Range Extension: Once a session ends, the high, low, and midpoint levels automatically extend — ideal for detecting SR zones.
Session labels: Each box includes a label with session name, time, volume, and delta for quick reference.
Custom session control: Enable or disable sessions individually and configure start/end times.
Clean aesthetics: Transparent shaded boxes with subtle borders make it easy to overlay without clutter.
Sessions Dashboard: Shows the time range of each session and tells you whether the session is currently active.
🔵 USAGE
Enable the sessions you want to monitor (e.g., New York or Tokyo) from the settings.
Use session volume and delta values to gauge the strength and direction of institutional activity.
Watch for price interaction with the extended range — it often acts as dynamic support/resistance after the session ends.
Overlay it with liquidity tools or breaker blocks for intraday strategy alignment.
🔵 EXAMPLES
Extended Future Range acted as resistance/support.
Delta value helped confirm bullish pressure during New York open.
Multiple sessions helped identify kill zone overlaps and high-volume turns.
Trading Sessions is more than just a visual scheduler — it's a precision tool for traders who align with session-based volume dynamics and ICT methodology. Use it to define high-probability zones, confirm volume shifts, and read deeper into the true intent behind market structure.

goose's session + killzone indicatorA powerful, multi-functional TradingView script designed for forex traders. It visually delineates major market sessions—Asia, London, and New York—on the chart, provides customizable session ranges, pip range counters, and configurable “killzone” markers. The indicator allows users to switch between a traditional line-and-fill style and a historical box style for session visualization, offering both real-time and historical context of market ranges.
Key Features:
1. Session Visualization Options:
• Lines & Fill Style:
• Highlights active sessions using dynamic lines and filled areas that update in real-time.
• Displays session high, low, and mid-range boundaries with customizable colors, border widths, and line styles.
• Historical Boxes Style:
• Creates and retains boxes for each past session, enabling users to review historical session ranges over extended periods.
• Each session box is drawn with user-defined fill and border colors, opacity, and line styles, anchored to the session’s high, low, and timeframe.
• Supports viewing multiple historical sessions at once, up to a configurable limit.
2. Pip Range Counters:
• Displays the range of pips for each active session, anchored to a fixed position near the bottom-right corner of the session.
• Uses arrow-style labels (label.style_label_up/down) to maintain a stable visual offset relative to the session, minimizing movement during vertical zoom.
• Customizable text size, color, and vertical offset, ensuring the pip counter remains legible and unobtrusive.
3. Killzone Lines:
• Allows users to define up to 15 custom “killzone” times with specific line colors, styles, and optional labels.
• Each killzone is drawn precisely when the price crosses the user-specified time, marking important market events or transitions.
4. User Configurations:
• Session Times: Fully adjustable start and end times for Asian, London, and New York sessions.
• Color & Style Settings:
• Customizable fill and border colors (with adjustable opacity) for each session style.
• User-friendly dropdowns and checkboxes for setting line styles, widths, and text sizes.
• Display Mode Selector:
• A dropdown (sessionStyle) lets users toggle between “Lines & Fill” and “Historical Boxes” for session visualization.
• Pip Counter and Killzone Settings:
• Options to show or hide pip counters, match label colors to session fills, and configure killzone appearance individually.
5. Robust Utility Functions:
• Functions to parse user-input times, determine if the current time falls within a session, and calculate session ranges.
• Historical session logic that detects session transitions and creates/upgrades boxes accordingly.
How It Works:
• Session Style Selection:
• Users choose their preferred visualization style via the sessionStyle dropdown.
• If “Lines & Fill” is selected, the indicator plots dynamic lines and fills during active sessions.
• If “Boxes” is selected, the indicator creates historical boxes that outline the range of each past session, persisting on the chart until session boundaries change.
• Pip Counter Labeling:
• During an active session, the pip counter calculates the range between the session’s high and low and displays it as text positioned just below the bottom-right corner of the session.
• The use of arrow-style labels ensures the text remains at a stable visual distance from the session’s outline, even when zooming vertically.
• Killzones:
• Users can define specific times (“killzones”) where important market events occur.
• When the price crosses these times, the script draws lines and optional labels with user-defined appearance settings.
Ideal Use Cases:
• Real-Time Trading: Quickly identify current session ranges, pip sizes, and crucial killzone markers during live trading.
• Historical Analysis: Switch to Historical Boxes to review past session ranges over days, weeks, or months, aiding in pattern recognition and strategy refinement.
• Customization: Tailor the appearance to match personal preferences or chart themes, including colors, styles, line widths, and label sizes.
This comprehensive indicator combines real-time session tracking with historical range visualization and customizable killzones. Its dual display modes, extensive settings, and stable pip counter labels make it a versatile tool for forex traders seeking to analyze market sessions both in the moment and retrospectively.

ICTProTools | ICT Insight - Time & Price Zones🚀 INTRODUCTION
The Time and Price Zones indicator builds upon the foundational concepts of ICT (Inner Circle Trader) and Smart Money Concepts (SMC). These methodologies analyze the behavior of institutional traders (known as "smart money") by focusing on liquidity, key price levels, and market timing.
Liquidity refers to areas with high concentrations of pending orders (stops, take-profits, entries) in the market. Large institutions efficiently need to execute their massive orders without causing excessive slippage. To achieve this, they strategically create and exploit liquidity pools by driving the price toward areas where retail traders cluster their positions.
Then, through "liquidity grabs" or "stop hunts,” institutions accumulate or distribute positions at optimal prices . This strategy allows them to fill large orders with minimal market impact, typically clearing out retail traders' positions before the price reverses.
This indicator helps traders apply these principles by merging time-based and price-based analysis tools for better market understanding. By combining high-impact sessions like Kill Zones with pivotal price markers such as Previous Highs and Lows, traders can see where institutional activity intersects with liquidity pools, improving their decision-making.
This powerful combination allows users to monitor market dynamics in real time, helping them spot sentiment shifts and identify crucial turning points more effectively.
💎 FEATURES
Kill Zones
Kill Zones are critical periods of the trading day characterized by heightened institutional activity, resulting in increased liquidity and significant price movements. By recognizing these zones, you can strategically focus your efforts on the most advantageous moments for trading.
The Asian Session , which runs from 5 PM to 1 AM New York time, serves as an essential liquidity provider before the onset of more volatile trading periods. This session is intricately linked to the Smart Money Tool (SMT - See below), as the highs and lows established during this period provide foundational liquidity levels. You can set alerts when these levels are breached , allowing you to stay informed without constant chart monitoring and make timely trading decisions.
Transitioning into the London Kill Zone from 2 to 5 AM New York time marks the beginning of the European session, often associated with increased volatility. Following this, the New York Kill Zone , occurring from 7 to 10 AM , sees significant overlap between the London and New York sessions, where liquidity flows intensify and frequently correlate with notable price reversals. Finally, the London Close from 10 to 12 PM signifies the end of the European session, often ending the day with a retracement in the daily range.
Thanks to the timezone you can select relative to a region, Kill Zones will automatically adapt to time changes throughout the year and between different brokers , ensuring accurate Kill Zone timings without manual adjustments.
Incorporating our advanced Kill Zones indicator into your trading strategy gives you unparalleled insights and enhanced functionality. With integrated alerts for breaches of key levels, you can stay informed and ready to act without the need for constant chart monitoring, allowing you to focus on executing your trading strategies effectively.
We can see on this chart the identified Kill Zones during the trading day on EURUSD , including the Asian Session in gray, which tends to consolidate slightly (creating liquidity), the London Kill Zone in orange, which tends to move fast, often taking Asian quickly, the New York Kill Zone in green, with always a lot of movements, and the London Close in blue, seeming rather to retrace.
The midline indicates the 50% mark of the session, serving as a reference point for potential price reactions. Additionally, the highs and lows established during the Asian Session are linked to the Smart Money Tool (SMT) and can trigger alerts when breached. Here, you could have received an alert when Asian Low (marked AL) and Asian High (marked AH) were swept.
Previous & Open Levels
Previous and Open levels are key elements in ICT methodology, showing important price points from major timeframes (Daily, Weekly, Monthly). These levels (Previous High, Low, Open, and their separators) help traders understand price dynamics and anticipate market shifts.
The Previous levels connect directly to the Smart Money Tool (SMT - See below) as they provide foundational liquidity levels. In ICT methodology, previous are levels where many traders place their Stop Loss, thus creating liquidity. This helps you understand potential market reactions and whether prices will likely continue their trend or reverse.
You’ll be instantly notified whenever the price interacts with any of these Previous levels. This means you can stay informed about critical market movements without the need to monitor your charts constantly.
The indicator also displays Opening prices and includes separators for daily, weekly, and monthly levels, offering a clear market overview.
Open levels can act as simplified indicators of Premium and Discount Zones. To be above the opening price can be considered as the Premium Zone , where the market offers higher prices, typically suitable for selling opportunities. Conversely, to be below this price can be considered as the Discount Zone , where prices are relatively lower, offering potential buying opportunities.
These visual elements help you identify crucial market zones that reflect both past price action and current market dynamics.
Our indicator offers you the exclusive ability to integrate the True Day Range, as described by ICT. Based on institutional logic, this concept defines the trading day starting at 00:00 New York time. You can adapt this flexible feature to match your trading style and analysis needs.
By incorporating our advanced Previous levels indicator into your trading arsenal, you gain powerful insights and enhanced functionality.
The chart above displays key Previous and open levels on EURUSD , including the Month, Week, and Day lines, along with separators for enhanced clarity. All levels are based on the True Day Range Mode. The notes indicate significant price points, highlighting how the price interacts with these important levels, which helps us to understand it…
We can start with the biggest liquidity, the Previous Month. In this example, we can see the PMH, and the price seems to have used this level as a reversal point. The PM levels are indeed significant liquidity zones. We can observe the creation of wicks that interact with this level, signaling a liquidity grab.
Following this, the price drops quickly before rebounding, creating a liquidity range, that will probably be liquidated then… This is why it rises again to form what is now the PDH (Previous Day High), using it as liquidity (inducement) while using the PWH (Previous Week High) as a rebound level. The PWH is indeed a High Resistance (HR) area since there is only a few liquidity at this point thanks to the liquidity grab. The price has no reason to move higher.
Looking ahead, we can forecast that the price may continue its decline, potentially targeting lower liquidity levels. There is likely additional liquidity beneath the current range, particularly near the PDL (Previous Day Low) and PWL (Previous Week Low).
Additionally, we can note that at this point, the price was above the D.O.P (Daily Open) and W.O.P (Weekly Open), areas where selling would be more favorable. The price reacts significantly around these levels, creating large wicks, demonstrating their importance.
SMT Dashboard (Smart Money Tool)
The Smart Money Tool (SMT) is a powerful concept within the ICT methodology that enables you to compare various assets based on liquidity uptake from significant price levels.
By utilizing the SMT, you can analyze any asset , whether it’s a currency pair, stock, cryptocurrency, or other financial instruments. The dashboard helps you identify the strongest and weakest assets by analyzing their interactions with critical liquidity levels and identifying divergences , including those related to the Previous Month, Previous Week, Previous Day, and Asian Session Highs and Lows. By doing so, he identifies the most bullish symbol. It will therefore tend to rise more easily, or at least fall less, than the other one.
The SMT includes alert functionality that notifies you whenever a new SMT is created or has changed , allowing you to stay informed about which asset is currently the strongest. This means you can react promptly to market changes without constantly monitoring your charts.
Additionally, since the SMT relies on the Previous levels, it is influenced by the selected mode, whether based on traditional Previous levels or the True Day Range . This flexibility ensures that you are using the most relevant information available for your trading decisions. Asian High and Asian Low levels are also calculated according to the schedules configured in the Kill Zones section.
In summary, the Smart Money Tool displays the strongest and weakest assets based on liquidity uptake, providing you with clear information on which asset to prioritize, so you can maximize your potential profits. By incorporating this concept into your approach, you align your decisions with prevailing market dynamics, offering you unparalleled insights and features tailored to enhance your trading strategy.
This chart displays the Smart Money Tool (SMT) dashboard on the GBPUSD symbol, which compares the liquidity uptake for EURUSD and GBPUSD pairs. The indicator shows that both Previous Month's and Week's High and Low were taken for both pairs. However, the Asian High (AH) has been breached on GBPUSD but not on EURUSD, while the Asian Low (AL) has been taken by EURUSD. As a result, GBPUSD is identified as the stronger asset, indicating that traders should focus on buying opportunities with GBPUSD rather than EURUSD. This analysis helps traders prioritize the best symbol for their strategies based on the most relevant liquidity divergences.
✨ SETTINGS
Kill Zones: Customize the display options for the Asian (with lines), London, New York, and London Close Kill Zones. Configure timezone options, midlines, and color preferences.
Previous & Open Levels: Adjust how Previous High/Low levels, Open and separators are displayed. Select between Classic or True Day Range Mode based on your trading preferences.
SMT: Choose the correlated assets for the SMT comparison and select which liquidity (Monthly, Weekly, Daily, Asian) to use and display. Configure settings like liquidity sweeps and strongest pair emojis.
Alerts: Configure alerts for key events such as the Asian High/Low or Previous Levels liquidity sweep, and SMT divergences.
🎯 CONCLUSION
The Time and Price Zones indicator offers a practical and insightful approach to market analysis by combining major principles of ICT and Smart Money Concepts into a cohesive tool. It empowers traders to understand key price levels, liquidity dynamics, and institutional activity with ease. By helping traders avoid being the liquidity of the market and instead align with institutional flows, the indicator can significantly enhance performances. While its features provide a valuable edge, it’s essential to remember that none should be used on its own and many more factors go into being a profitable trader.

Macros ICT KillZones [TradingFinder] Times & Price Trading Setup🔵 Introduction
ICT Macros, developed by Michael Huddleston, also known as ICT (Inner Circle Trader), is a powerful trading tool designed to help traders identify the best trading opportunities during key time intervals like the London and New York trading sessions.
For traders aiming to capitalize on market volatility, liquidity shifts, and Fair Value Gaps (FVG), understanding and using these critical time zones can significantly improve trading outcomes.
In today’s highly competitive financial markets, identifying the moments when the market is seeking buy-side or sell-side liquidity, or filling price imbalances, is essential for maximizing profitability.
The ICT Macros indicator is built on the renowned ICT time and price theory, which enables traders to track and leverage key market dynamics such as breaks of highs and lows, imbalances, and liquidity hunts.
This indicator automatically detects crucial market times and optimizes strategies for traders by highlighting the specific moments when price movements are most likely to occur. A standout feature of ICT Macros is its automatic adjustment for Daylight Saving Time (DST), ensuring that traders remain synced with the correct session times.
This means you can rely on accurate market timing without the need for manual updates, allowing you to focus on capturing profitable trades during critical timeframes.
🔵 How to Use
The ICT Macros indicator helps you capitalize on trading opportunities during key market moments, particularly when the market is breaking highs or lows, filling Fair Value Gaps (FVG), or addressing imbalances. This indicator is particularly beneficial for traders who seek to identify liquidity, market volatility, and price imbalances.
🟣 Sessions
London Sessions
London Macro 1 :
UTC Time : 06:33 to 07:00
New York Time : 02:33 to 03:00
London Macro 2 :
UTC Time : 08:03 to 08:30
New York Time : 04:03 to 04:30
New York Sessions
New York Macro AM 1 :
UTC Time : 12:50 to 13:10
New York Time : 08:50 to 09:10
New York Macro AM 2 :
UTC Time : 13:50 to 14:10
New York Time : 09:50 to 10:10
New York Macro AM 3 :
UTC Time : 14:50 to 15:10
New York Time : 10:50 to 11:10
New York Lunch Macro :
UTC Time : 15:50 to 16:10
New York Time : 11:50 to 12:10
New York PM Macro :
UTC Time : 17:10 to 17:40
New York Time : 13:10 to 13:40
New York Last Hour Macro :
UTC Time : 19:15 to 19:45
New York Time : 15:15 to 15:45
These time intervals adjust automatically based on Daylight Saving Time (DST), helping traders to enter or exit trades during key market moments when price volatility is high.
Below are the main applications of this tool and how to incorporate it into your trading strategies :
🟣 Combining ICT Macros with Trading Strategies
The ICT Macros indicator can easily be used in conjunction with various trading strategies. Two well-known strategies that can be combined with this indicator include:
ICT 2022 Trading Model : This model is designed based on identifying market liquidity, structural price changes, and Fair Value Gaps (FVG). By using ICT Macros, you can identify the key time intervals when the market is seeking liquidity, filling imbalances, or breaking through important highs and lows, allowing you to enter or exit trades at the right moment.
Silver Bullet Strategy : This strategy, which is built around liquidity hunting and rapid price movements, can work more accurately with the help of ICT Macros. The indicator pinpoints precise liquidity times, helping traders take advantage of market shifts caused by filling Fair Value Gaps or correcting imbalances.
🟣 Capitalizing on Price Volatility During Key Times
Large market algorithms often seek liquidity or fill Fair Value Gaps (FVG) during the intervals marked by ICT Macros. These periods are when price volatility increases, and traders can use these moments to enter or exit trades.
For example, if sell-side liquidity is drained and the market fills an imbalance, the price might move toward buy-side liquidity. By identifying these moments, which may also involve breaking a previous high or low, you can leverage rapid market fluctuations to your advantage.
🟣 Identifying Liquidity and Price Imbalances
One of the important uses of ICT Macros is identifying points where the market is seeking liquidity and correcting imbalances. You can determine high or low liquidity levels in the market before each ICT Macro, as well as Fair Value Gaps (FVG) and price imbalances that need to be filled, using them to adjust your trading strategy. This capability allows you to manage trades based on liquidity shifts or imbalance corrections without needing a bias toward a specific direction.
🔵 Settings
The ICT Macros indicator offers various customization options, allowing users to tailor it to their specific needs. Below are the main settings:
Time Zone Mode : You can select one of the following options to define how time is displayed:
UTC : For traders who need to work with Universal Time.
Session Local Time : The local time corresponding to the London or New York markets.
Your Time Zone : You can specify your own time zone (e.g., "UTC-4:00").
Your Time Zone : If you choose "Your Time Zone," you can set your specific time zone. By default, this is set to UTC-4:00.
Show Range Time : This option allows you to display the time range of each session on the chart. If enabled, the exact start and end times of each interval are shown.
Show or Hide Time Ranges : Toggle on/off for visual clarity depending on user preference.
Custom Colors : Set distinct colors for each session, allowing users to personalize their chart based on their trading style.These settings allow you to adjust the key time intervals of each trading session to your preference and customize the time format according to your own needs.
🔵 Conclusion
The ICT Macros indicator is a powerful tool for traders, helping them to identify key time intervals where the market seeks liquidity or fills Fair Value Gaps (FVG), corrects imbalances, and breaks highs or lows. This tool is especially valuable for traders using liquidity-based strategies such as ICT 2022 or Silver Bullet.
One of the key features of this indicator is its support for Daylight Saving Time (DST), ensuring you are always in sync with the correct trading session timings without manual adjustments. This is particularly beneficial for traders operating across different time zones.
With ICT Macros, you can capitalize on crucial market opportunities during sensitive times, take advantage of imbalances, and enhance your trading strategies based on market volatility, liquidity shifts, and Fair Value Gaps.

Session Range Breakouts With Targets [AlgoAlpha]⛓️💥Session Range Breakouts With Targets 🚀
Introducing the "Session Range Breakouts With Targets" indicator by AlgoAlpha, a powerful tool for traders to capitalize on session-based range breakouts and identify precise target zones using ATR-based calculations! Whether you trade the Asian, American, European, or Oceanic sessions, this script highlights key breakout levels and targets that adapt to market volatility, ensuring you're always prepared for those crucial price movements. 🕒📊
Session-based Trading : The indicator highlights session-specific ranges, offering clear breakouts for Asian, American, European, Oceanic, and even custom sessions 🌍.
Adaptive Volatility Zones : Uses ATR to determine dynamic zone widths, filtering out fakeouts and adjusting to market conditions ⚡.
Precise Take-Profit Targets : Set multiple levels of take-profits based on ATR multipliers, ensuring you can manage both aggressive and conservative trades 🎯.
Customizable Appearance : Tailor the look with customizable colors for session highlights and breakout zones to fit your chart style 🎨.
Alerts on Key Events : Built-in alert conditions for breakouts and take-profit hits, so you never miss a trading opportunity 🔔.
🚀 Quick Guide to Using the Indicator
🛠 Add the Indicator : Add the indicator to favorites by pressing the star icon. Choose your session (Asia, America, Europe, Oceana, or Custom) and adjust the ATR length, zone width multiplier, and target multipliers to suit your strategy.
📊 Analyze Breakouts : Watch for the indicator to plot upper and lower range boxes based on session highs and lows. Price breaking through these boxes will signal a potential entry.
📈 Monitor Targets : Track bullish and bearish targets as price moves, with up to three take-profit levels based on ATR multipliers.
🔔 Set Alerts : Enable alerts for session breakouts or when price hits your designated take-profit targets.
🔍 How It Works
This script operates by identifying session-specific ranges based on highs and lows from the beginning of the selected session (Asia, America, Europe, or others). After a user-defined wait period (default: 120 bars), it calculates the highest and lowest points and creates upper and lower zones using the Average True Range (ATR) to adapt to market volatility. If the price breaks above or below these zones, it is identified as a breakout, and the script dynamically calculates up to three take-profit targets for both bullish and bearish scenarios using an ATR multiplier. The indicator also includes alerts for breakouts and take-profit hits, providing real-time trading signals.
