Multi-Optimized Linear Regression ChannelA take on alexgrover 's Optimized Linear Regression Channel script which allows users to apply multiple linear regression channel with unique multiplicative factors.
Multiplicative Factors
Adjust the amount of channels and multiplicative factors of existing or additional channels using the "Mults" input.
An input of "1" creates a single linear regression channel with the multiplicative factor of one.
An input of "4" creates a single linear regression channel with the multiplicative factor of four.
An input of "1,4" creates two linear regression channels with multiplicative factors of one and four.
An input of "1,2,3" creates three linear regression channels with multiplicative factors of one, two, and three.
Linear
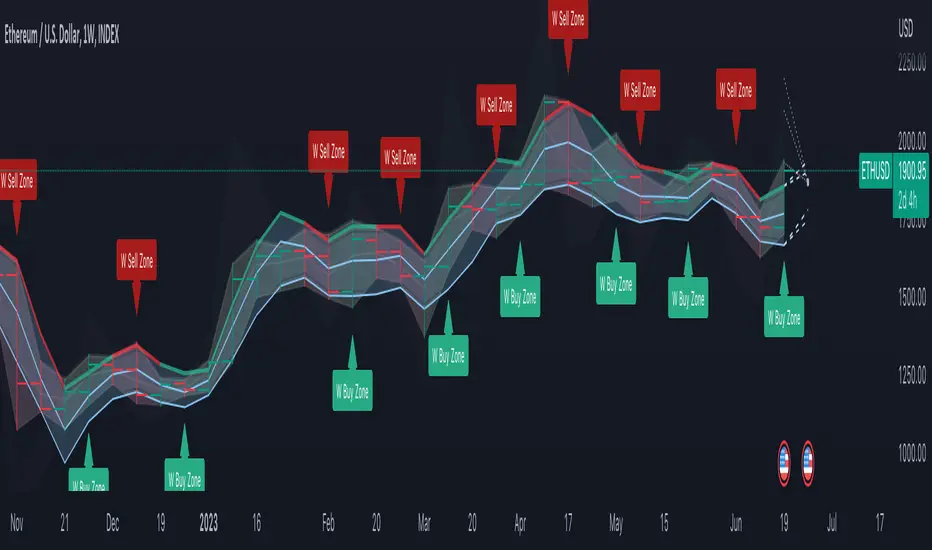
DB Change Forecast ProDB Change Forecast Pro
What does the indicator do?
The DB Change Forecast Pro is a unique indicator that uses price change on HLC3 to detect buy and sell periods along with plotting a linear regression price channel with oversold and undersold zones. It also has a linear regression change forecast mode to optionally project market direction.
Change is calculated by taking a two-bar change of HLC3 and dividing that by the price or, optionally, a fixed divisor.
A fast-moving change cloud is then calculated and displayed as the "regular version" plot (shown in light gray). When the cloud bottom is above low, a buy zone is detected. When the cloud top is below the high, a sell zone is detected.
The linear regression price channel is calculated similarly but using a much slower change rate. The linear regression price channel shows reasonable high, low and HLC3 ranges. At the bar's opening, the channel will be more compact and come fairly accurate about 1/4 into the bar timeframe.
The change forecasted price is projected on the right side of the current bar to indicate the current timeframe direction. Please note this forecasting feature is shown in orange when it's early in the timeframe and gray when the timeframe is more likely to produce an accurate direction forecast for the upcoming bar.
You can use these projected dashed lines to see possible market movements for the Current bar and possible market direction for the next bar. Kindly note these projects change; they should be used to understand possible extreme highs/lows for the current bar or market direction.
The indicator includes an optional change forecast projection feature hidden by default. It will project the market forecast channel with an offset of 1. The forecast is defaulted to an offset of 1 to show market direction. However, you can modify to zero the offset to show the current bar forecast and forecast history.
How should this indicator be used?
First, very important,
1. Settings > Set Symbol to Desired
2. Settings > Set High Timeframe to "Chart"
3. Settings > Ensure "Use price as divisor" is checked.
It's recommended to use this indicator in higher timeframes. Buy and sell signals are displayed in real-time. However, waiting until 1/4 to 1/2 into the current bar is recommended before taking action, and change can happen.
The buy/sell signals (zones) provide recommendations on playing a long vs. a short. When in a buy sone, only play longs. When in a sell zone, only play shorts.
Then use the linear regression price channel oversold and undersold zones to optionally open and close positions within the buy/sell zones.
For example, consider opening a long in a buy zone when the linear regression price channel shows undersold. Then consider closing the long when the price moves into the linear regression oversold or higher. Then repeat as long as it's in the buy zone. Then vice versa for sell zones and shorting.
At basic design, buy in the buy zone, sell or short in the sell zone. If you are up for higher trading frequencies, use the linear regression price channel as described in the example above.
Please note, as, with all indicators, you may need to adjust to fit the indicator to your symbol and desired timeframe.
This is only an example of use. Please use this indicator as your own risk and after doing your due diligence.
Does the indicator include any alerts?
Yes,
"DB CFHLC3: Signal BUY" - Is triggered when a buy signal is fired.
"DB CFHLC3: Signal SELL" - Is triggered when a sell signal is fired.
"DB CFHLC3: Zone BUY" - Is triggered when a buy zone is detected.
"DB CFHLC3: Zeon SELL" - Is triggered when a sell zone is detected.
"DB CFHLC3: Oversold SELL" - Is triggered when the price exceeds the oversold level.
"DB CFHLC3: Undersold BUY" - Is triggered when the price goes below the undersold level.
Any other tips?
Once you have configured the indicator for your symbol and chart timeframe. Meaning the plots are displayed over the price. Check out larger timeframes such as W, 2W, 3W, 4W, M, and 4M. It works wonderfully for showing market lows and highs for long-term investing too!
Another, tip is to combine it with your favorite indicator, such as TTM Squeeze or MACD for confirmation purposes. You may be surprised how fast the indicator shows market direction changes on higher timeframes.
You can just as easily use a high timeframe such as D, 2D, or 3D for day trading due to how the linear price channel works.
Why am I not selling this indicator?
I would like to bless the TradingView community, and I enjoy publishing custom indicators.
If you enjoy this indicator, please consider leaving a thumbs up or a comment for others to know about your experience or recommendations.
Enjoy!
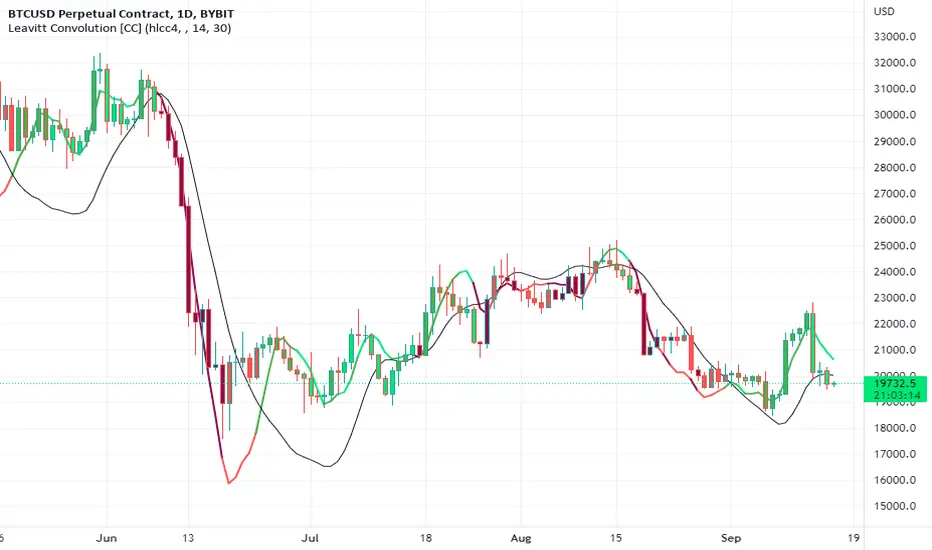
Leavitt Convolution [CC]The Leavitt Convolution indicator was created by Jay Leavitt (Stocks and Commodities Oct 2019, page 11), who is most well known for creating the Volume-Weighted Average Price indicator. This indicator is very similar to my Leavitt Projection script and I forgot to mention that both of these indicators are actually predictive moving averages. The Leavitt Convolution indicator doubles down on this idea by creating a prediction of the Leavitt Projection which is another prediction for the next bar. Obviously this means that it isn't always correct in its predictions but it does a very good job at predicting big trend changes before they happen. The recommended strategy for how to trade with these indicators is to plot a fast version and a slow version and go long when the fast version crosses over the slow version or to go short when the fast version crosses under the slow version. I have color coded the lines to turn light green for a normal buy signal or dark green for a strong buy signal and light red for a normal sell signal, and dark red for a strong sell signal.
This is another indicator in a series that I'm publishing to fulfill a special request from @ashok1961 so let me know if you ever have any special requests for me.
Regression Channel, Candles and Candlestick Patterns by MontyRegression Candles by ugurvu
Regression Channel by Tradingview
All Candlestick Patterns By Tradingview
This script was combined for a friend of mine who needed this.
This Script has regression candles by ugurvu, Regression channel and Candlestick patterns by tradingview.
The intention was to fuse these together so more information can be processed on the cost of a single indicator.

Leavitt Projection [CC]The Leavitt Projection indicator was created by Jay Leavitt (Stocks and Commodities Oct 2019, page 11), who is most well known for creating the Volume-Weighted Average Price indicator. This indicator is very simple but is also the building block of many other indicators, so I'm starting with the publication of this one. Since this is the first in a series I will be publishing, keep in mind that the concepts introduced in this script will be the same across the entire series. The recommended strategy for how to trade with these indicators is to plot a fast version and a slow version and go long when the fast version crosses over the slow version or to go short when the fast version crosses under the slow version. I have color coded the lines to turn light green for a normal buy signal or dark green for a strong buy signal and light red for a normal sell signal, and dark red for a strong sell signal.
I know many of you have wondered where I have been, and my personal life has become super hectic. I was recently hired full-time by TradingView, and my wife is pregnant with twins, and she is due in a few months. I will do my absolute best to get back to posting scripts regularly, but I will post a bunch today in the meantime to fulfill a special request from one of my loyal followers (@ashok1961).

RSI + MA, LinReg, ZZ (HH HL LH LL), Div, Ichi, MACD and TSI HistRelative Strength Index with Moving Average, Linear Regression, Zig Zag (Highs and Lows), Divergence, Ichimoku Cloud, Moving Average Convergence Divergence and True Strength Index Histogram
This script is based on zdmre's RSI script, I revamped a lot of things and added a few indicators from ParkF's RSI script.
Disable Labels in the Style tab and the histogram if you don't enlarge the indicator and it seems too small.
Look to buy in the oversold area and bounce of the support of the linear regression.
Look to sell in the overbought area and bounce of the resistance of the linear regression.
Look for retracement to the moving average or horizontal lines, and divergences for potential reversal.
RSI
The Relative Strength Index (RSI) is a well versed momentum based oscillator which is used to measure the speed (velocity) as well as the change (magnitude) of directional price movements.
Moving Average
Moving Average (MA) is a good way to gauge momentum as well as to confirm trends, and define areas of support and resistance.
Linear Regression
The Linear Regression indicator visualizes the general price trend of a specific part of the chart based on the Linear Regression calculation.
Zig Zag (Highs and Lows)
The Zig Zag indicator is used to identify price trends, and in doing so plots points on the chart to mark whenever prices reverse by a larger percentage point than a predetermined variable or marker.
Divergence
The divergence indicator warns traders and technical analysts of changes in a price trend, oftentimes that it is weakening or changing direction.
Ichimoku Cloud
The Ichimoku Cloud is a package of multiple technical indicators that signal support, resistance, market trend, and market momentum.
MACD and TSI Histogram
MACD can be used to identify aspects of a security's overall trend.
The True Strength Index indicator is a momentum oscillator designed to detect, confirm or visualize the strength of a trend.

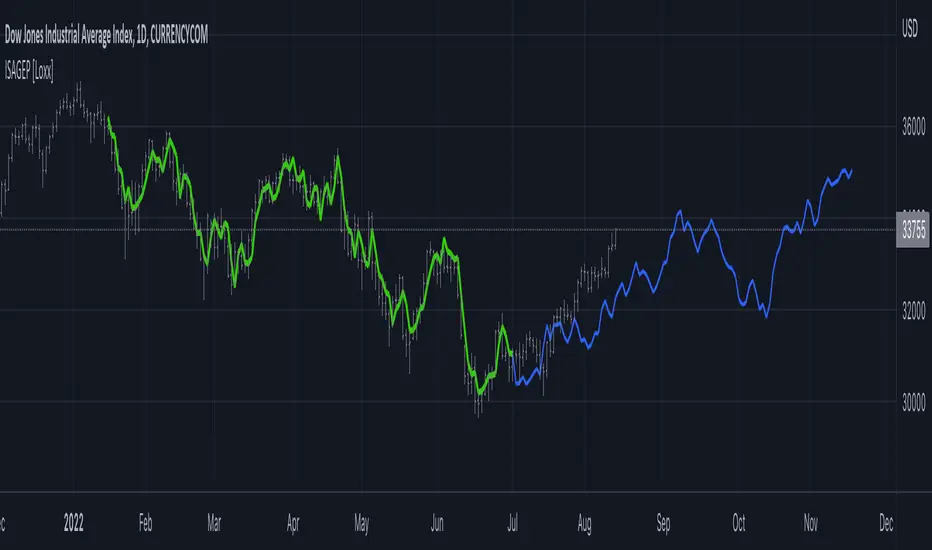
Itakura-Saito Autoregressive Extrapolation of Price [Loxx]Itakura-Saito Autoregressive Extrapolation of Price is an indicator that uses an autoregressive analysis to predict future prices. This is a linear technique that was originally derived or speech analysis algorithms.
What is Itakura-Saito Autoregressive Analysis?
The technique of linear prediction has been available for speech analysis since the late 1960s (Itakura & Saito, 1973a, 1970; Atal & Hanauer, 1971), although the basic principles were established long before this by Wiener (1947). Linear predictive coding, which is also known as autoregressive analysis, is a time-series algorithm that has applications in many fields other than speech analysis (see, e.g., Chatfield, 1989).
Itakura and Saito developed a formulation for linear prediction analysis using a lattice form for the inverse filter. The Itakura–Saito distance (or Itakura–Saito divergence) is a measure of the difference between an original spectrum and an approximation of that spectrum. Although it is not a perceptual measure it is intended to reflect perceptual (dis)similarity. It was proposed by Fumitada Itakura and Shuzo Saito in the 1960s while they were with NTT. The distance is defined as: The Itakura–Saito distance is a Bregman divergence, but is not a true metric since it is not symmetric and it does not fulfil triangle inequality.
read more: Selected Methods for Improving Synthesis Speech Quality Using Linear Predictive Coding: System Description, Coefficient Smoothing and Streak
Data inputs
Source Settings: -Loxx's Expanded Source Types. You typically use "open" since open has already closed on the current active bar
LastBar - bar where to start the prediction
PastBars - how many bars back to model
LPOrder - order of linear prediction model; 0 to 1
FutBars - how many bars you want to forward predict
Things to know
Normally, a simple moving average is calculated on source data. I've expanded this to 38 different averaging methods using Loxx's Moving Avreages.
This indicator repaints
Related Indicators (linear extrapolation of price)
Levinson-Durbin Autocorrelation Extrapolation of Price
Weighted Burg AR Spectral Estimate Extrapolation of Price
Helme-Nikias Weighted Burg AR-SE Extra. of Price
Relative Andean ScalpingThis is an experimental signal providing script for scalper that uses 2 of open source indicators.
First one provides the signals for us called Andean Oscillator by @alexgrover . We use it to create long signals when bull line crosses over signal line while being above the bear line. And reverse is true for shorts where bear line crosses over signal line while being above bull line.
Second one is used for filtering out low volatility areas thanks to great idea by @HeWhoMustNotBeNamed called Relative Bandwidth Filter . We use it to filter out signals and create signals only when the Relative Bandwith Line below middle line.
The default values for both indicators changed a bit, especially used linreg values to create relatively better signals. These can be changed in settings. Please be aware that i did not do extensive testing with this indicator in different market conditions so it should be used with caution.

Linear Regression ChannelsThese channels are generated from the current values of the linear regression channel indicator, the standard deviation is calculated based off of the RSI . This indicator gives an idea of when the linear regression model predicts a change in direction.
You are able to change the length of the linear regression model, as well as the size of the zone. A negative zone size will make the zone stretch away from the center, and a positive zone size will make it stretch towards the centerline.

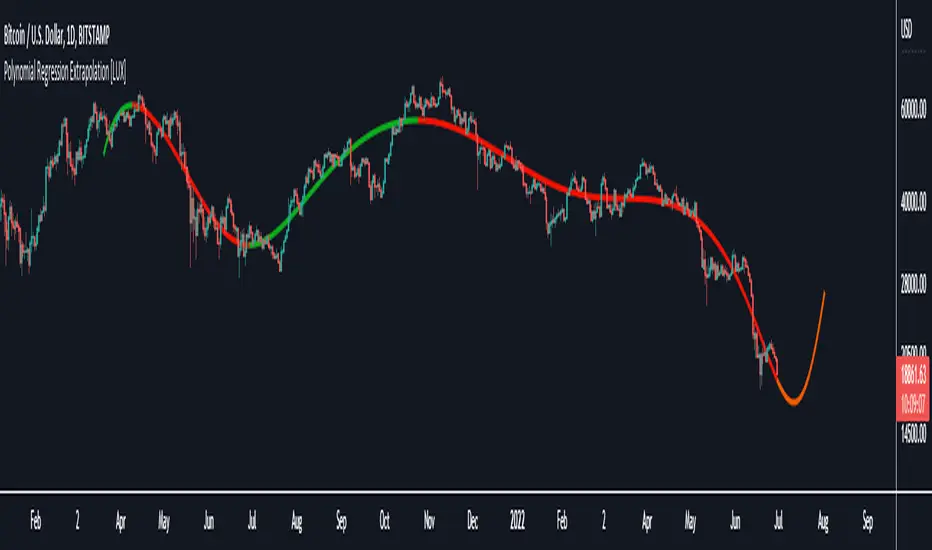
Polynomial Regression Extrapolation [LuxAlgo]This indicator fits a polynomial with a user set degree to the price using least squares and then extrapolates the result.
Settings
Length: Number of most recent price observations used to fit the model.
Extrapolate: Extrapolation horizon
Degree: Degree of the fitted polynomial
Src: Input source
Lock Fit: By default the fit and extrapolated result will readjust to any new price observation, enabling this setting allow the model to ignore new price observations, and extend the extrapolation to the most recent bar.
Usage
Polynomial regression is commonly used when a relationship between two variables can be described by a polynomial.
In technical analysis polynomial regression is commonly used to estimate underlying trends in the price as well as obtaining support/resistances. One common example being the linear regression which can be described as polynomial regression of degree 1.
Using polynomial regression for extrapolation can be considered when we assume that the underlying trend of a certain asset follows polynomial of a certain degree and that this assumption hold true for time t+1...,t+n . This is rarely the case but it can be of interest to certain users performing longer term analysis of assets such as Bitcoin.
The selection of the polynomial degree can be done considering the underlying trend of the observations we are trying to fit. In practice, it is rare to go over a degree of 3, as higher degree would tend to highlight more noisy variations.
Using a polynomial of degree 1 will return a line, and as such can be considered when the underlying trend is linear, but one could improve the fit by using an higher degree.
The chart above fits a polynomial of degree 2, this can be used to model more parabolic observations. We can see in the chart above that this improves the fit.
In the chart above a polynomial of degree 6 is used, we can see how more variations are highlighted. The extrapolation of higher degree polynomials can eventually highlight future turning points due to the nature of the polynomial, however there are no guarantee that these will reflect exact future reversals.
Details
A polynomial regression model y(t) of degree p is described by:
y(t) = β(0) + β(1)x(t) + β(2)x(t)^2 + ... + β(p)x(t)^p
The vector coefficients β are obtained such that the sum of squared error between the observations and y(t) is minimized. This can be achieved through specific iterative algorithms or directly by solving the system of equations:
β(0) + β(1)x(0) + β(2)x(0)^2 + ... + β(p)x(0)^p = y(0)
β(0) + β(1)x(1) + β(2)x(1)^2 + ... + β(p)x(1)^p = y(1)
...
β(0) + β(1)x(t-1) + β(2)x(t-1)^2 + ... + β(p)x(t-1)^p = y(t-1)
Note that solving this system of equations for higher degrees p with high x values can drastically affect the accuracy of the results. One method to circumvent this can be to subtract x by its mean.
Standard deviation channel of linear regression distance [AbAh]The indicator calculates the distance between linear regression line and the data point (price) as a percentage , then calculates the standard deviation for the linear regression distance , then draw the channel of two lines depending on the values of standard deviation .
///////// How to use ////////////////
1 - for Best result , indicator should be used on 2H frame Time of less : like 1H or 30 min
2 - The upper line and the lower line, both play a role as a support and resistance area, when the price bounces from the upper zone or lower zone, there is a high probability that it will move to the other line.
3 - The price breakout of one of the lower or upper lines may indicate a major price movement coming in the direction of the breakout
/////////////////////////////////////
Relative slopeRelative slope metric
Description:
I was in need to create a simple, naive and elegant metric that was able to tell how strong is the trend in a given rolling window. While abstaining from using more complicated and arguably more precise approaches, I’ve decided to use Linearly Weighted Linear Regression slope for this goal. Outright values are useful, but the problem was that I wasn’t able to use it in comparative analysis, i.e between different assets & different resolutions & different window sizes, because obviously the outputs are scale-variant.
Here is the asset-agnostic, resolution-agnostic and window size agnostic version of the metric.
I made it asset agnostic & resolution agnostic by including spread information to the formula. In our case it's weighted stdev over differenced data (otherwise we contaminate the spread with the trend info). And I made it window size agnostic by adding a non-linear relation of length to the output, so finally it will be aprox in (-1, 1) interval, by taking square root of length, nothing fancy. All these / 2 and * 2 in unexpected places all around the formula help us to return the data to it’s natural scale while keeping the transformations in place.
Peace TV
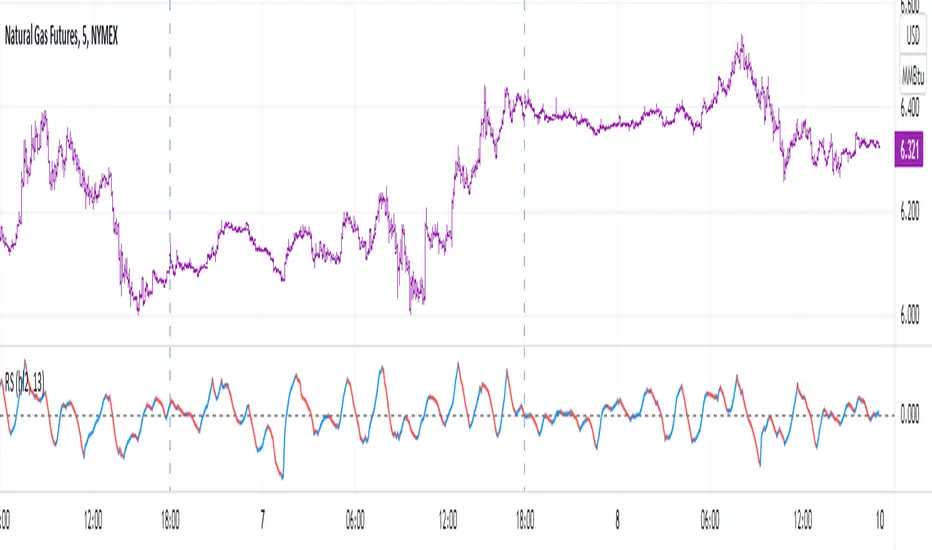
StrengthA mathematically elegant, native & modern way how to measure velocity/ strength/ momentum. As you can see it looks like MACD, but !suddenly! has N times shorter code (disregard the functions), and only 1 parameter instead of 3. OMG HOW DID HE DO IT?!?
MACD: "Let's take one filter (1 parameter), than another filter (2 parameters), then let's take dem difference, then let's place another filter over the difference (3rd parameter + introduction of a nested calculation), and let's write a whole book about it, make thousands of multi-hours YouTube videos about it, and let's never mention about the amount of uncertainty being introduced by multiple parameters & introduction of the nested calculation."
Strength: "let's get real, let's drop a weighted linear regression & usual linear regression over the data of the same length, take dem slopes, then make the difference over these slopes, all good. And then share it with people w/o putting an ® sign".
Fyi, regressions were introduced centuries ago, maybe decades idk, the point is long time ago, and computational power enough to calculate what I'm saying is slightly more than required for macd.
Rationale.
Linearly weighted linear regression has steeper slope (W) than the usual linear regression slope (S) due to the fact that the recent datapoints got more weight. This alone is enough of a metric to measure velocity. But still I've recalled macd and decided to make smth like it cuz I knew it'll might make you happy. I realized that S can be used instead of smoothing the W, thus eliminating the nested calculation and keeping entropy & info loss in place. And see, what we get is natural, simple, makes sense and brings flex. I also wanna remind you that by applying regression we maximize the info gain by using all the data in the window, instead of taking difference between the first and the last datapoints.
This script is dedicated to my friend Fabien. Man, you were the light in the darkness in that company. You'll get your alien green Lambo if you'll really want it, no doubts on my side bout that.
Good hunting

Linear Regression & RSI Multi-Function Screener with Table-LabelHi fellow traders..
Happy to share a Linear Regression & RSI Multi-Function Custom Screener with Table-Labels...
The Screener scans for Linear Regression 2-SD Breakouts and RSI OB/OS levels for the coded tickers and gives Summary alerts
Uses Tables (dynamica resizing) for the scanner output instead of standard labels!
This Screener cum indicator collection has two distinct objectives..
1. Attempt re-entry into trending trades.
2. Attempt Counter trend trades using linear regression , RSI and Zigzag.
Briefly about the Screener functions..
a. It uses TABLES as Labels a FIRST for any Screener on TV.
b. Tables dynamically resize based on criteria..
c. Alerts for breakouts of the UPPER and the LOWER regression channels.(2 SD)
d. In addition to LinReg it also Screens RSI for OB/OS levels so a multifunction Screener.
e. Of course has the standard summary Alerts and programmable format for Custom functions.
f. Uses only the inbuilt Auto Fib and Lin Reg code for the screener.(No proprietary stuff)
g. The auto Zigzag code is derived(Auto fib).
Question what are all these doing in a single screener ??
ZigZag is very useful in determining Trend Up or Down from one Pivot to another.
So Once you have a firm view of the Current Trend for your chosen timeframe and ticker…
We can consider few possible trading scenarios..
a. Re-entry in an Up Trend - Combination of OS Rsi And a Lower Channel breach followed by a re-entry back into the regression channel CAN be used as an effective re-entry.
b. Similarily one can join a Down Trend on OB Rsi and Upper Channel line breach followed by re-entry into the regression channel.
If ZigZag signals a range-bound market, bound within channel lines then the Upper breakout can be used to Sell and vice-versa!
In short many possibilities for using these functions together with Scanner and Alerts.
This facilitates timely PROFITABLE Trending and Counter trend opportunities across multiple tickers.
You must give a thorough READ to the various available tutorials on ZigZag / Regression and Fib retracements before attempting counter trend trades using these tools!!
A small TIP – Markets are sideways or consolidating 70% of the time!!
Acknowledgements: - Thanks a lot DGTRD for the Auto ZigZag code and also for the eagerness to help wherever possible..Respect!!
Disclaimer: The Alerts and Screener are just few tools among many and not any kind of Buy/Sell recommendations. Unless you have sufficient trading experience please consult a Financial advisor before investing real money.
*The alerts are set for crossovers however for viewing tickers trading above or below the channel use code in line 343 and 344 after setting up the Alerts!
** RSI alerts are disabled by default to avoid clutter, but if needed one can activate code lines 441,442,444 and 445
Wish you all, Happy Profitable Trading!

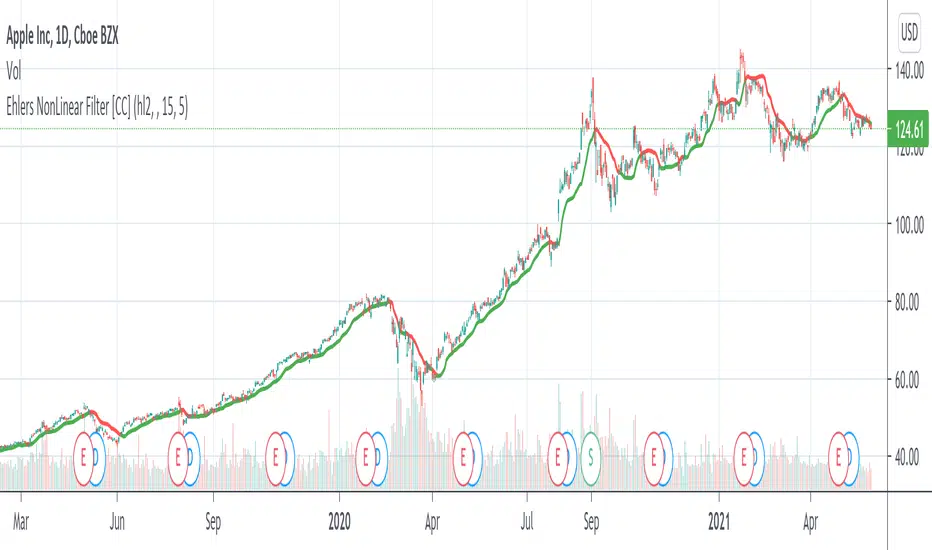
Ehlers NonLinear Filter [CC]The NonLinear Filter was created by John Ehlers and this one of his more unknown filters that work very well as a trendline and moving average. This is one of my favorites along with the instantenous trendlines that he created. Buy when the line turns green and sell when it turns red.
Let me know if there are any other indicators you would like to see me publish scripts for!
Linreg RSIThis oscillator is based on RSI combined with linear regression. The calculation of RSI is based on the linear regression value, not on simple "src" as usual. Otherwise, everything remains as usual: overbought and oversold values (which are painted in green and red).

Linear Regression CandlesThere are many linear regression indicators out there, most of them draw lines or channels, but this one actually draws a chart.
Linear Regression ChannelHello Traders,
There are several nice Linear Regression Channel scripts in the Public Library. and I tried to make one with some extra features too. This one can check if the Price breaks the channel and it shows where is was broken. Also it checks the momentum of the channel and shows it's increasing/decreasing/equal in a label, shape of the label also changes. The line colors change according to direction.
using the options, you can;
- Set the Source (Close, HL2 etc)
- Set the Channel length
- Set Deviation
- Change Up/Down Line colors
- Show/hide broken channels
- Change line width
meaning of arrows:
⇑ : Uptrend and moment incresing
⇗ : Uptrend and moment decreasing
⇓ : Downtrend and moment incresing
⇘ : Downtrend and moment decreasing
⇒ : No trend
An example for how color of lines, arrow direction and shape of label change.
Enjoy!

TF Segmented Linear RegressionFit a line at successive intervals, where the interval period is determined by a user-selected time frame, this allows the user to have an estimate of the intrinsic trend within various intervals.
Settings
Timeframe : Determine the period of the interval, if the timeframe is weekly then a new line will be fit at the start each weeks, by default "Daily"
Mult : Multiplication factor for the RMSE, determine the distance between the upper and lower extremities
Src : Input data for the indicator
Plot Extremities : Logical value, if true then the extremities of the channel are plotted, if false only the midline is plotted, true by default.
Usage
The timeframe setting should be higher than the current chart timeframe, note however that too large values of timeframe might return an error. Since the maximum number of lines that can be plotted is 54, using the extremities will only return 18 channels.
The indicator can be compared to the "regression trend" drawing tool
Main tf = 5 min with the indicator using a daily timeframe, the filled area is produced by the regression trend drawing tool using the same interval as the indicator, and coincide with it.
Main tf = 15 min with the indicator using a weekly timeframe, wider channel indicate that the values tend to be farther away from the fitted line.
A line with a significant slope indicates a strong trend, in that case, the width of the channel is determined by the amplitude of the retracements in the trend, with a narrower channel indicating a cleaner trend.
When the fitted line has a low slope value and the channel is wide, it means that there were two or more variations of opposite directions with large amplitudes within the interval, this also indicates that a linear model is not appropriate.
A slope approximately equal to 0 with a low channel width indicates a trendless market with cyclical variations of low amplitude in it.
Refrences
Determining the starting and ending points of the fitted line was done using a linear combination between the wma and sma
The wma and sma functions both use a series as period by making use of the Wma and Sum functions in the following script

LWMA: Linear Weighted Moving AverageCouldn't find searching for Linearly Weighted Moving Average (LWMA) in tradingview. Found one with the LWMA title, but it uses plain WMA calculation without the linearity which more heavily weights recent price data, which I need, so I try to made one.
LWMAs are also quicker to react to price changes than SMA and EMA. If you want a moving average with less lag than an SMA, try a LWMA.
It kind of also have a more clarity in defining the price trend and reversals. Trade signals usually based on crossovers, they can also indicate areas of potential support or resistance. But beware though, multiple false signals may also occur before a significant trend develops. Use a filter, some decent volatility oscillator might do the job.
--
The formula for this Linearly Weighted Moving Average is:
LWMA = (( P n∗ W 1)+( P n−1∗ W 2)+( P n−2∗ W 3)...) / ∑W
P = Price for the period
n = The most recent period, n-1 is the prior period, and n-2 is two periods prior
W = The assigned weight to each period, with the highest weight going first and then descending linearly based on the number of periods being used.
I hope I'm doing right translating it to Pine Script 4. Let me know if I miss something.

[RS]Shotgun ForecastsExperimental:
its a play at linear forecasting.
use replay feature to see it in action:
streamable.com

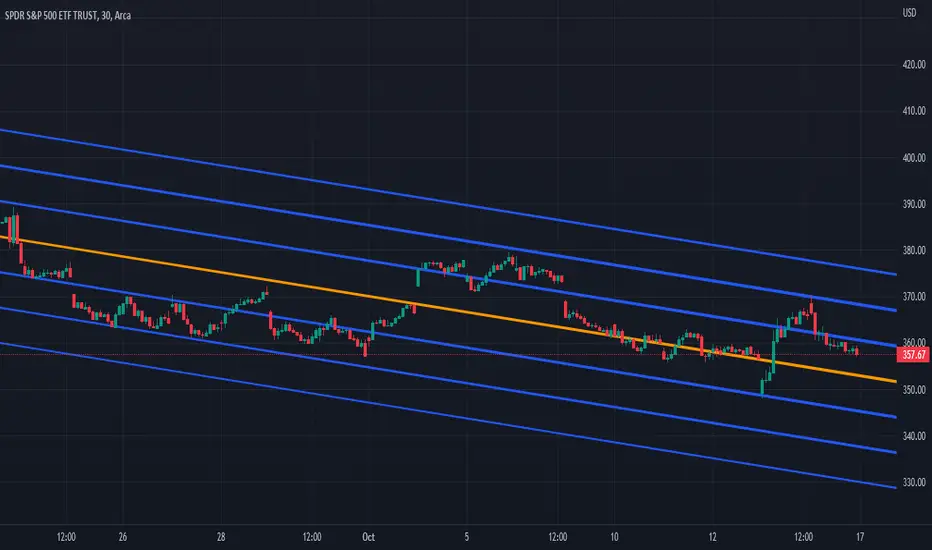
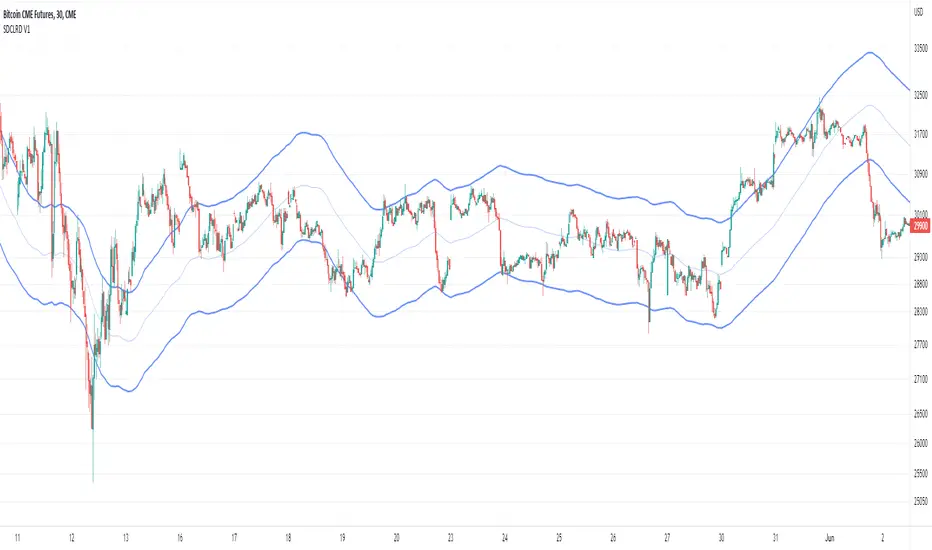
Price-Line Channel - A Friendly Support And Resistance IndicatorIntroduction
Lines are the most widely used figures in technical analysis, this is due to the linear trends that some securities posses (daily log SP500 for example), support and resistances are also responsible for the uses of lines, basically linear support and resistances are made with the assumption that the line connecting two local maximas or minimas will help the user detect a new local maxima or minima when the price will cross the line.
Technical indicators attempting to output lines have always been a concern in technical analysis, the mostly know certainly being the linear regression, however any linear models would fit in this category. In general those indicators always reevaluate their outputs values (repainting), others non repainting indicators returning lines are sometimes to impractical to set-up. This is what has encouraged me to make a simpler indicator based on the framework used in the recursive bands indicator that i published.
The proposed indicator aim to be extremely flexible and easy to use while returning linear support and resistances, an option that allow readjustment is also introduced, thus allowing for a "smarter" indicator.
The Indicator
The indicator return two extremities, the upper one aim to detect resistance points while the lower one aim to detect support points. The length setting control the steepness of the line, with higher values of length involving a lower slope, this make the indicator less reactive and interact with the price less often.
The name "price-line" comes from the fact that the channel is dependent on its own interaction with the price, therefore a breakout methodology can also be used, where price is up-trending when crossing with the upper extremity and down trending when crossing with the lower one.
Readjusted Option
The line steepness can be readjusted based on the market volatility, it make more sense for the line to be more steep when the market is more volatile, thus making it converge faster toward the price, this of course is done at the cost of some linearity. This is achieved by checking the "readjustment" option. The effects can be shown on BTCUSD, below the indicator without the readjusted option :
when the "readjustment" option is checked we have the following results :
The volatile down movement on BTCUSd make the upper extremity converge faster toward the price, this option can be great for volatile markets.
Conclusion
The recursive bands indicator prove to be an excellent framework that allow for the creation of lots of indicators, the proposed indicator is extremely efficient and provide an easy solution for returning linear support and resistances without much drawbacks, the readjusted option allow the indicator to adapt to the market volatility at the cost of linearity.
The performance of the indicator is relative to the motion of the price, however the indicator show signs of returning accurate support and resistances points. I hope the indicator find its use in the community.
Thanks for reading !
Note
Respect the house rules, always request permission before publishing open source code. This is an original work, requesting permission is the least you can do.

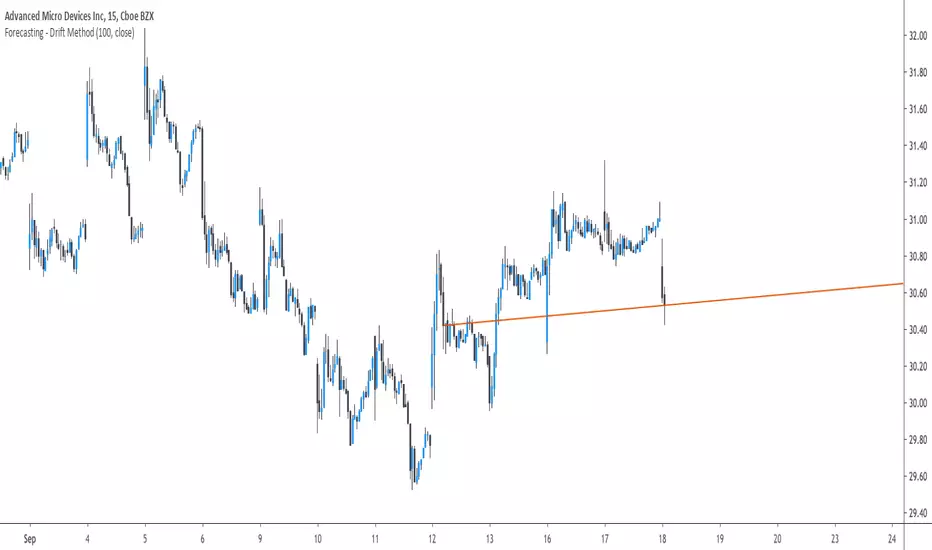
Forecasting - Drift MethodIntroduction
Nothing fancy in terms of code, take this post as an educational post where i provide information rather than an useful tool.
Time-Series Forecasting And The Drift Method
In time-series analysis one can use many many forecasting methods, some share similarities but they can all by classified in groups and sub-groups, the drift method is a forecasting method that unlike averages/naive methods does not have a constant (flat) forecast, instead the drift method can increase or decrease over time, this is why its a great method when it comes to forecasting linear trends.
Basically a drift forecast is like a linear extrapolation, first you take the first and last point of your data and draw a line between those points, extend this line into the future and you have a forecast, thats pretty much it.
One of the advantage of this method is first its simplicity, everyone could do it by hand without any mathematical calculations, then its ability to be non-conservative, conservative methods involve methods that fit the data very well such as linear/non-linear regression that best fit a curve to the data using the method of least-squares, those methods take into consideration all the data points, however the drift method only care about the first and last point.
Understanding Bias And Variance
In order to follow with the ability of methods to be non-conservative i want to introduce the concept of bias and variance, which are essentials in time-series analysis and machine learning.
First lets talk about training a model, when forecasting a time-series we can divide our data set in two, the first part being the training set and the second one the testing set. In the training set we fit a model to the training data, for example :
We use 200 data points, we split this set in two sets, the first one is for training which is in blue, and the other one for testing which is in green.
Basically the Bias is related to how well a forecasting model fit the training set, while the variance is related to how well the model fit the testing set. In our case we can see that the drift line does not fit the training set very well, it is then said to have high bias. If we check the testing set :
We can see that it does not fit the testing set very well, so the model is said to have high variance. It can be better to talk of bias and variance when using regression, but i think you get it. This is an important concept in machine learning, you'll often see the term "overfitting" which relate to a model fitting the training set really well, those models have a low to no bias, however when it comes to testing they don't fit well at all, they have high variance.
Conclusion On The Drift Method
The drift method is good at forecasting linear trends, and thats all...you see, when forecasting financial data you need models that are able to capture the complexity of the price structure as well as being robust to noise and outliers, the drift method isn't able to capture such complexity, its not a super smart method, same goes for linear regression. This is why more peoples are switching to more advanced models such a neural networks that can sometimes capture such complexity and return decent results.
So this method might not be the best but if you like lines then here you go.