Liquidity Void Detector (Zeiierman)█ Overview
Liquidity Void Detector (Zeiierman) is an oscillator highlighting inefficient price displacements under low participation. It measures the most recent price move (standardized return) and amplifies it only when volume is below its own trend.
Positive readings ⇒ strong up-move on low volume → potential Buy-Side Imbalance (void below) that often refills.
Negative readings ⇒ strong down-move on low volume → potential Sell-Side Imbalance (void above) that often refills.
This tool provides a quantitative “void” proxy: when price travels far with unusually thin volume, the move is flagged as likely inefficient and prone to mean-reversion/mitigation.
█ How It Works
⚪ Volume Shock (Participation Filter)
Each bar, volume is compared to a rolling baseline. This is then z-scored.
// Volume Shock calculation
volTrend = ta.sma(volume, L)
vs = (volume > 0 and volTrend > 0) ? math.log(volume) - math.log(volTrend) : na
vsZ = zScore(vs, vzLen) // z-scored volume shock
lowVS = (vsZ <= vzThr) // low-volume condition
Bars with VolShock Z ≤ threshold are treated as low-volume (thin).
⚪ Prior Return Extremeness
The 1-bar log return is computed and z-scored.
// Prior return extremeness
r1 = math.log(close / close )
retZ = zScore(r1, rLen) // z-scored prior return
This shows whether the latest move is unusually large relative to recent history.
⚪ Void Oscillator
The oscillator is:
// Oscillator construction
weight = lowVS ? 1.0 : fadeNoLow
osc = retZ * weight
where Weight = 1 when volume is low, otherwise fades toward a user-set factor (0–1).
Osc > 0: up-move emphasized under low volume ⇒ Buy-Side Imbalance.
Osc < 0: down-move emphasized under low volume ⇒ Sell-Side Imbalance.
█ Why Use It
⚪ Targets Inefficient Moves
By filtering for low participation, the oscillator focuses on moves most likely driven by thin books/noise trading, which are statistically more likely to retrace.
⚪ Simple, Robust Logic
No need for tick data or order-book depth. It derives a practical void proxy from OHLCV, making it portable across assets and timeframes.
⚪ Complements Price-Action Tools
Use alongside FVG/imbalance zones, key levels, and volume profile to prioritize voids that carry the highest reversal probability.
█ How to Use
Sell-Side Imbalance = aggressive sell move (price goes down on low volume) → expect price to move up to fill it.
Buy-Side Imbalance = aggressive buy move (price goes up on low volume) → expect price to move down to fill it.
█ Settings
Volume Baseline Length — Bars for the volume trend used in VolShock. Larger = smoother baseline, fewer low-volume flags.
Vol Shock Z-Score Lookback — Bars to standardize VolShock; larger = smoother, fewer extremes.
Low-Volume Threshold (VolShock Z ≤) — Defines “thin participation.” Typical: −0.5 to −1.0.
Return Z-Score Lookback — Bars to standardize the 1-bar log return; larger = smoother “extremeness” measure.
Fade When Volume Not Low (0–1) — Weight applied when volume is not low. 0.00 = ignore non-low-volume bars entirely. 1.00 = treat volume condition as irrelevant (pure return extremeness).
Upper Threshold (Osc ≥) — Trigger for Sell-Side Imbalance (void below).
Lower Threshold (Osc ≤) — Trigger for Buy-Side Imbalance (void above).
-----------------
Disclaimer
The content provided in my scripts, indicators, ideas, algorithms, and systems is for educational and informational purposes only. It does not constitute financial advice, investment recommendations, or a solicitation to buy or sell any financial instruments. I will not accept liability for any loss or damage, including without limitation any loss of profit, which may arise directly or indirectly from the use of or reliance on such information.
All investments involve risk, and the past performance of a security, industry, sector, market, financial product, trading strategy, backtest, or individual's trading does not guarantee future results or returns. Investors are fully responsible for any investment decisions they make. Such decisions should be based solely on an evaluation of their financial circumstances, investment objectives, risk tolerance, and liquidity needs.
Liquidity

Key Levels: Daily, Weekly, Monthly [BackQuant]Key Levels: Daily, Weekly, Monthly
Map the market’s “memory” in one glance—yesterday’s range, this week’s chosen day high/low, and D/W/M opens—then auto-clean levels once they break.
What it does
This tool plots three families of high-signal reference lines and keeps them tidy as price evolves:
Chosen Day High/Low (per week) — Pick a weekday (e.g., Monday). For each past week, the script records that day’s session high and low and projects them forward for a configurable number of bars. These act like “memory levels” that price often revisits.
Daily / Weekly / Monthly Opens — Plots the opening price of each new day, week, and month with separate styling. These opens frequently behave like magnets/flip lines intraday and anchors for regime on higher timeframes.
Auto-pruning — When price breaks a stored level, the script can automatically remove it to reduce clutter and refocus you on still-active lines. See: (broken levels removed).
Why these levels matter
Liquidity pockets — Prior day’s high/low and the daily open concentrate stops and pending orders. Mapping them quickly reveals likely sweep or fade zones. Example: previous day highs + daily open highlighting liquidity:
Context & regime — Monthly opens frame macro bias; trading above a rising cluster of monthly opens vs. below gives a clean top-down read. Example: monthly-only “macro outlook” view:
Cleaner charts — Auto-remove broken lines so you focus on what still matters right now.
What it plots (at a glance)
Past Chosen Day High/Low for up to N prior weeks (your choice), extended right.
Current Daily Open , Weekly Open , and Monthly Open , each with its own color, label, and forward extension.
Optional short labels (e.g., “Mon High”) or full labels (with week/month info).
How breaks are detected & cleaned
You control both the evidence and the timing of a “break”:
Break uses — Choose Close (more conservative) or Wick (more sensitive).
Inclusive? — If enabled, equality counts (≥ high or ≤ low). If disabled, you need a strict cross.
Allow intraday breaks? — If on, a level can break during the tracked day; if off, the script only counts breaks after the session completes.
Remove Broken Levels — When a break is confirmed, the line/label is deleted automatically. (See the demo: )
Quick start
Pick a Day of Week to Track (e.g., Monday).
Set how many weeks back to show (e.g., 8–10).
Choose how far to extend each family (bars to the right for chosen-day H/L and D/W/M opens).
Decide if a break uses Close or Wick , and whether equality counts.
Toggle Remove Broken Levels to keep the chart clean automatically.
Tips by use-case
Intraday bias — Watch the Daily Open as a magnet/flip. If price gaps above and holds, pullbacks to the daily open often decide direction. Pair with last day’s high/low for sweep→reversal or true breakout cues. See:
Weekly structure — Track the week’s chosen day (e.g., Monday) high/low across prior weeks. If price stalls near a cluster of old “Monday Highs,” look for sweep/reject patterns or continuation on reclaim.
Macro regime — Hide daily/weekly lines and keep only Monthly Opens to read bigger cycles at a glance (BTC/crypto especially). Example:
Customization
Use wicks or bodies for highs/lows (wicks capture extremes; bodies are stricter).
Line style & thickness — solid/dashed/dotted, width 1–5, plus global transparency.
Labels — Abbreviated (“Mon High”, “D Open”) or full (month/week/day info).
Color scheme — Separate colors for highs, lows, and each of D/W/M opens.
Capacity controls — Set how many daily/weekly/monthly opens and how many weeks of chosen-day H/L to keep visible.
What’s under the hood
On your selected weekday, the script records that session’s true high and true low (using wicks or body-based extremes—your choice), then projects a horizontal line forward for the next bars.
At each new day/week/month , it records the opening price and projects that line forward as well.
Each bar, the script checks your “break” rules; once broken, lines/labels are removed if auto-cleaning is on.
Everything updates in real time; past levels don’t repaint after the session finishes.
Recommended presets
Day trading — Weeks back: 6–10; extend D/W opens: 50–100 bars; Break uses: Close ; Inclusive: off; Auto-remove: on.
Swing — Fewer daily opens, more weekly opens (2–6), and 8–12 weeks of chosen-day H/L.
Macro — Show only Monthly Opens (1–6 months), dashed style, thicker lines for clarity.
Reading the examples
Broken lines disappear — decluttering in action:
Macro outlook — monthly opens as cycle rails:
Liquidity map — previous day highs + daily open:
Final note
These are not “signals”—they’re reference points that many participants watch. By standardising how you draw them and automatically clearing the ones that no longer matter, you turn a noisy chart into a focused map: where liquidity likely sits, where price memory lives, and which lines are still in play.

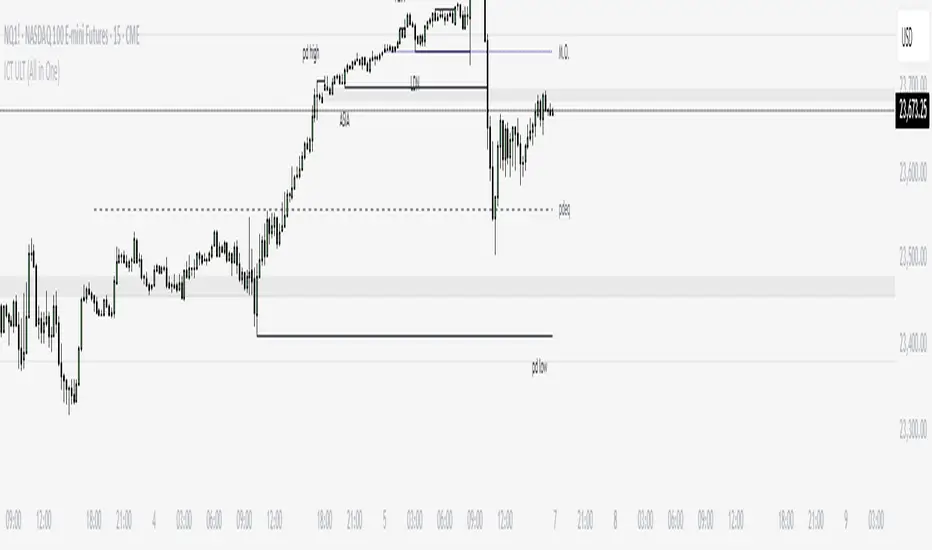
ICT Daily+Weekly BiasPrevious Day & Week Levels — Daily+Weekly Bias Visualizer
Plots previous-day (PDH/PDL/PDEQ) and previous-week (PWH/PWL) reference levels.
Use them to frame bias and identify the Draw on Liquidty.
Definitions
• PDH/PDL: Prior day high/low.
• PDEQ: Prior day equilibrium = (PDH + PDL) / 2.
• PWH/PWL: Prior week high/low.
Features
• PDH/PDL lines with optional labels at left or right edge.
• PDEQ line (0.5 of PD Range) with optional label.
• PWH/PWL lines with optional labels.
• Custom colors, styles, and width controls.
• Optional Price Labels
• Timeframe visibility limit.
• Lines extend and stop on mitigation (when breached).
*Also included in ICT ULT (All In One) Indicator
*Feel free to suggest improvement in the comments
Swing High/Low Levels (Auto Remove)Plots untapped swing high and low levels from higher timeframes. Used for liquidity sweep strategy. Cluster of swing levels are a magnet for price to return to and reverse. Indicator gives option for candle body or wick for sweep to remove lines.

Hopiplaka Goldbach System with SignalsThis tool builds a dynamic price framework around the current market using a PO3 range and a set of mathematically derived Goldbach levels. It then scores nearby levels for quality (reliability) and produces Buy/Sell signals only when multiple, independent factors line up (price level quality, trend/“Tesla Vortex” state, ICT AMD phase, time confluence, volume bias, and momentum). The goal is to identify high-confluence inflection points rather than constant signals.
Core Concepts & Why They’re Combined
1. PO3 Range Framework
Price is segmented into a primary range (lower → upper) determined by a configurable size (3× ladder: 3, 9, 27, …, 2187).
⦁ If price sits near a boundary (configurable sensitivity), the range can auto-expand to the next 3× size to better fit current volatility.
⦁ This gives a stable “map” of the active trading area and its boundaries.
2. Goldbach Levels (Pure Hopiplaka implementation)
For each even number ≤ your precision limit, the script evaluates all prime-sum partitions (Goldbach partitions) and converts their prime ratios into price levels inside the PO3 range.
⦁ Levels are classified as Premium / Standard / Discount based on properties of the prime pair and a mathematical weighting.
⦁ Strict minimum spacing rules (exact %, OB %, liquidity-void %) prevent clutter and keep only the most meaningful levels.
3. Tesla Vortex (trend/phase strength)
A volatility/trend-aware state machine estimates whether market is in MMxM (accumulation/mean-revert like) or TREND conditions and maps price interaction with high-quality levels to phases (e.g., Order Block Formation, Distribution).
⦁ This helps filter signals: buys favored in MMxM near supportive levels; sells favored in TREND near premium/liquidity levels, etc.
4. ICT Integration (AMD, IPDA bias hooks)
A lightweight AMD phase detector classifies the recent window into Accumulation / Manipulation / Distribution and marks market structure bias. This is used as confluence with level quality and trend state.
5. Time Confluence (Goldbach time)
Swing highs/lows are checked against Goldbach-valid timestamps (based on hour+minute sums decomposable into prime pairs). Repeated alignment adds time-bias confidence. When price and time align, level reliability is boosted.
6. Volume & Liquidity Context
A rolling volume baseline marks High/Low Volume Bias; levels can be volume-weighted (raising or lowering their reliability). Proximity to PO3 extremes flags pending liquidity sweeps.
Why this mashup?
The system blends price geometry (PO3 + Goldbach), state/trend (Tesla Vortex), market-microstructure (ICT AMD), time confluence, and volume/liquidity into one numerically scored signal. Each component answers a different question; together they reduce false positives and favor high-quality trades near meaningful levels.
What You’ll See on the Chart
⦁ PO3 Range Boundaries: two dashed lines (“lower” and “upper”). Auto-expand darkens the boundary style slightly.
⦁ Goldbach Levels: horizontal lines colored by classification and context:
⦁ Premium (strong premium band), Standard, Discount
⦁ OB (Order-Block candidate), LV (Liquidity Void)
⦁ TESLA node (trend/phase aligned)
⦁ Heavier width = higher reliability; dashed/dotted styles encode class differences.
⦁ PO3 Liquidity Boxes: narrow yellow shaded bands above/below each level (configurable pip distance).
⦁ Markers
⦁ ▲ Buy arrow below bar when a Buy signal triggers
⦁ ▼ Sell arrow above bar when a Sell signal triggers
⦁ ● Small dot when price touches a Goldbach level
⦁ Data-window plots:
⦁ Tesla Vortex Strength (numeric)
⦁ Time Bias (positive = bullish, negative = bearish)
⦁ Volume Bias (+1 high / −1 low)
⦁ Signal Strength (+ for buy / − for sell, zero when no signal)
⦁ Label Legend (on level tags)
⦁ TESLA – Tesla-aligned level node
⦁ OB – Order-block-quality zone
⦁ LV – Liquidity-void zone
⦁ Premium / Standard / Discount – Level class
⦁ Gxx – Even number used to build the level (Goldbach reference)
⦁ Reliability – Final score after time/volume/tesla weighting
⦁ Optional extras: Vol (relative volume weight), Time (time-confluence strength)
How Signals Are Generated
A signal is proposed when price comes within a minimum distance of a high-reliability level. It is then accepted only if enough of these independent checks pass (you control the required count):
1. Tesla Vortex state matches direction (e.g., MMxM with buy; TREND with sell).
2. ICT AMD phase aligns (Accumulation → buy bias; Distribution → sell bias).
3. Goldbach time bias supports the direction.
4. Volume bias supportive (high-volume context boosts conviction).
5. Level quality (TESLA node or Premium class) is high.
6. Momentum alignment (recent 2–3 bars in the same direction).
Only when confluence ≥ your threshold and confidence ≥ 0.5 (scaled by sensitivity) will a Buy/Sell arrow print. Cooldown prevents rapid repeats.
Inputs (key ones)
⦁ PO3 Settings: range size, auto-expansion toggle, expansion sensitivity, liquidity band distance.
⦁ Goldbach Mathematics: precision limit, exact spacing rules, spacing for OB/LV classes.
⦁ Trading Signals: master toggle, sensitivity, min reliability, confluence required, cooldown, min distance to level, markers on/off.
⦁ Tesla Vortex / ICT: enable Vortex, sensitivity; enable AMD/IPDA analysis and lookback.
⦁ Time & Volume: enable Goldbach time and weighting; volume lookback; liquidity-pool detection.
⦁ Display: show historical/future projections, number of future bars, labels, path/phase overlays.
⦁ Colors: full palette per class/context (premium/discount/OB/LV/Tesla/time/volume, buy/sell/goldbach hit).
Alerts Included
⦁ Signals: “BUY Signal Generated”, “SELL Signal Generated”
⦁ Level Interactions: “Goldbach Level Hit”; “Near Goldbach Level”; “Tesla Vortex Node”; “Premium Level Alert”
⦁ PO3: “PO3 Upper Break”, “PO3 Lower Break”, “PO3 Range Expansion”
⦁ State Changes: “Tesla Vortex Phase Change”
⦁ Context: “Liquidity Sweep Imminent”, “Strong Time Confluence”
You can wire these to webhooks or notifications.
Suggested Workflow
1. Choose PO3 size that matches your instrument’s volatility; keep Auto-Expansion ON initially.
2. Set confluence threshold (start at 3–4) and cooldown (e.g., 10 bars).
3. Keep Time and Volume modules ON for additional reliability weighting.
4. Use arrows as filters, not blind entries—confirm with your execution plan and risk rules.
5. Prefer signals near Premium/Discount TESLA nodes that also show time confluence and supportive volume.
Practical Notes & Limitations
⦁ The mathematical framework is deterministic, but market execution is not—always manage risk.
⦁ Future projections and heavy labeling can be resource-intensive; tune visibility if performance drops.
⦁ If a market is extremely illiquid or gap-prone, spacing/filters may hide many levels (by design).
Disclaimer
This script is for educational and research purposes only and is not financial advice. Trading involves risk. You are responsible for your own decisions.

Silent Trigger Silent Trigger combines widely used concepts under one scoring engine. Each module adds weight only when its conditions are met:
1. Higher-Timeframe (HTF) context
• Requests 1H and the next HTF up (e.g., 4H/D) with request.security(...) on confirmed bars only.
• Uses RSI(14) and a MACD line (EMA12–EMA26 difference) for bias.
• By default HTF weights the score. There is an option to require HTF alignment if you prefer a hard filter.
2. Market regime
• ADX for trend strength.
• Bollinger Band width and a fractal-energy proxy to detect squeeze/coiling vs expansion.
3. Smart-money / Wyckoff structure
• High-volume narrow bars, absorption, spring/upthrust, and liquidity grabs past recent swing highs/lows.
4. Momentum & divergences
• RSI and MACD-line divergences (regular + hidden) and simple exhaustion checks.
5. Fair Value Gaps (FVG)
• 3-bar gap with mid-gap revisit confirmation.
6. Volume context
• Relative volume and a compact 10-bin rolling volume profile to locate HVN proximity.
7. Sessions / time filter
• Optional London/NY “kill zone” participation filter.
8. Correlation (optional)
• Simple BTC trend check for USD-quoted markets.
Pre-Move (yellow) logic:
Triggers only when the market is compressed (squeeze/low fractal energy), ADX is rising, the MACD histogram is near zero (pressure building), and there is a money-flow impulse (MFI slope and/or OBV Z-score spike).
The yellow diamond is plotted on the side of the expected move:
• Below for bullish reversals / Above for bullish breakouts.
• Above for bearish reversals / Below for bearish breakouts.
A built-in cooldown keeps yellows from spamming.
⸻
What appears on the chart
• Bull diamond (green): Total score ≥ your threshold and > bear score.
• Bear diamond (magenta): Mirror of the above.
• Pre-move (yellow): Early heads-up; use it with HTF context and structure.
All diamonds are intentionally tiny to minimize clutter.
⸻
Key settings
• Signal Mode & Min Probability – tighten/loosen confirmations.
• Use Higher TF in Scoring – soft weighting (default).
• Require HTF Alignment – optional hard gate.
• Module toggles – Smart Money, Wyckoff, FVG, Correlation, Sessions.
• Pre-Move – enable, cooldown bars, MFI levels, OBV Z-score threshold.
⸻
How to use (practical)
1. Choose a TF that matches your style (5–15m intraday, 1H–4H swing).
2. Read HTF bias first; trade in that direction unless structure clearly supports a reversal.
3. Treat yellow as “get ready.” Act only when a green/magenta prints with structure (S/R, FVG, HVN) and acceptable risk.
4. Place stops beyond the liquidity level or FVG midpoint; size positions conservatively.
⸻
Repainting & HTF policy
• No lookahead is used anywhere.
• request.security is called on confirmed bars; the HTF MACD line is computed inside the HTF context (single series), not by indexing a tuple.
• Signals are designed for bar-close confirmation. Intra-bar alerts can change until the bar closes.
⸻
Limitations (honest)
• Money-flow features depend on volume quality; thin/synthetic volume reduces reliability.
• Pre-moves can fail during unscheduled news shocks or when HTF trend is dominant.
• This is not financial advice. You are responsible for entries, exits, and risk.
⸻
Alerts
Built-in bull/bear alerts include direction and a probability bucket (Basic/Moderate/Strong/Extreme).
Pre-move yellows are primarily visual; you can still set an alert on their plot condition if desired.
⸻
Why this isn’t a “mashup”
• A single probability engine blends HTF bias, structure (liquidity/Wyckoff/FVG), regime, and volume into a score, rather than stacking unrelated indicators.
• A pre-move detector that requires compression + rising trend energy + money-flow impulse, and places the marker on the side of the expected move, with cooldown control.
• A lightweight rolling HVN check to bias continuation vs mean-reversion near key nodes.
⸻
Changelog (summary)
• Current release: pre-move module, HTF hard-gate option, tiny diamonds, clarified HTF/no-repaint policy, session filter tidy-up.

Valid Monthly LevelsValid Monthly Levels (No Sweeps) + Smart Labels
This tool automatically plots the highs and lows of each completed monthly candle and tracks their validity in real time. A level is considered valid until it has been swept (price trades strictly beyond that high or low). Once swept, the line and label can either be removed or dimmed depending on your settings.
Key features:
Monthly highs and lows: Each month’s range is marked with horizontal levels that extend forward.
Valid vs. swept logic: Levels are only valid until breached; swept levels can be hidden or kept as dotted/grey lines.
Smart labels: Each level is labeled with the month and year (e.g., Sep ’25 H/L). On higher timeframes, labels sit at the candle; on lower timeframes, labels automatically shift to the right edge so they don’t disappear off-screen.
Customizable appearance: Choose colors for highs, lows, and swept levels; adjust line styles; and limit how many past months are shown.
Clutter control: Cap the maximum number of labels, so your chart stays readable even on small intraday timeframes.
This indicator is useful for traders who track monthly supply/demand extremes, liquidity sweeps, and higher-timeframe context when executing on lower timeframes.

RB — Rejection Blocks (Price Structure)This indicator detects and visualizes Rejection Blocks (RBs) using pure price action logic.
A bullish RB occurs when a down candle forms a lower low than both its neighbors. A bearish RB occurs when an up candle forms a higher high than both its neighbors.
Validated RBs are displayed as boxes, optional lines, or labels. Blocks are automatically removed when invalidated (price closes through them), keeping the chart uncluttered and focused.
How to use
• Apply on any timeframe, from intraday to higher timeframes.
• Watch how price reacts when revisiting RB zones.
• Treat these zones as contextual areas, not entry signals.
• Combine with your own trading methods for confirmation.
Originality
Unlike generic support/resistance tools, this indicator isolates a specific structural pattern (rejection blocks) and renders it visually on the chart. This selective focus allows traders to study structural reactions with more clarity and precision.
⚠️ Disclaimer: This is not a trading system or a signal provider. It is a visual analysis tool designed for structural and educational purposes.

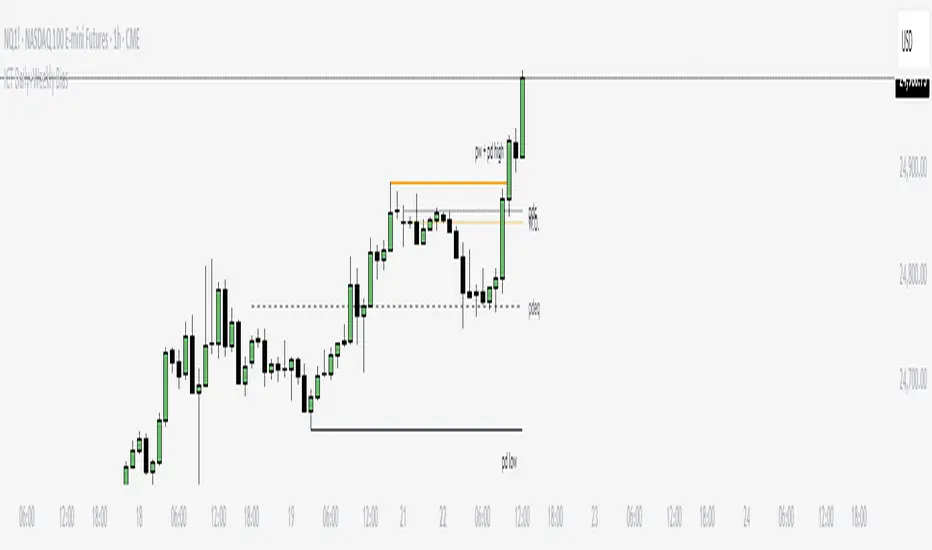
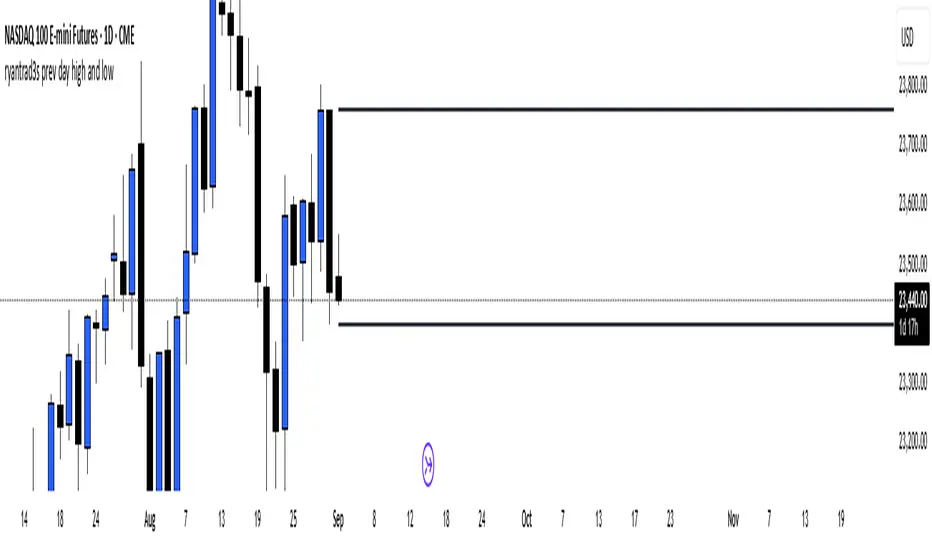
ryantrad3s prev day high and lowThis indicator can help you find the Daily high and low a lot faster than what it usually does, having this indicator equipped will make it a lot more convenient for any trader that uses anything to do with Daily highs and lows. Hope this helps.
B A N K $ - Breaks & SweepsThis indicator automatically maps on Breaks of Structure & Liquidity Sweeps. It works by calculating pivot points based on how many candles are above/below either side of a pivot.
The user can manually set how many candles need to be above/below either side of a pivot if they would prefer to change it.
The indicator will dynamically adjust the lines as the user changes timeframe to allow for seamless analysis.
Features
Break of Structure lines
Liquidity Sweep lines
Dealing Range - this allows the user to visualise the current dealing range
Explanation
A sweep is determined by whether a candle closes through a pivot point with a body closure or not. If the candle wicks this level but fails to close through it, the line will turn red to indicate a liquidity sweep.
If the following 3 candles go on to close through the break line, this will then update it from a red sweep line to the normal break line again. (sometimes the initial candle that touches a level will not close through it but price will continue to break that level in the next few candles).

Balanced Big Wicks (50/50) HighlighterThis open-source indicator highlights candles with balanced long wicks (50/50 style)—that is, candles where both upper and lower shadows are each at least 30–60% of the full range and within ~8% of each other, while retaining a substantial body. This specific structure often reflects indecision or liquidity sweeps and can precede strong breakout moves.
How It Works (Inputs and Logic)
Min wick % (each side): 30–60% of candle range
Max body %: up to 60% of range (preserves strong body presence)
Equality tolerance: wicks within 8% of each other
ATR filter (multiples of ATR14): ensures only significant-range candles are flagged
When a “50/50” candle forms, it’s visually colored and labeled; audibly alertable.
How to Use It
Long setup: price closes above the wick-high → potential long entry (SL below wick-low, TP = 1:1).
Short setup: price closes below wick-low → potential short entry (SL above wick-high, TP = 1:1).
Especially effective on 5–15 minute scalping charts when aligned with high-volume sessions or HTF trend context.
Why This Indicator Is Unique
Unlike standard wick or doji voters, this script specifically filters for candles with a strong body and symmetrical wicks, paired with a range filter, reducing noise significantly.
Important Notes
No unrealistic claims: backtested setups indicate high occurrence of clean breakouts, though performance depends on market structure.
Script built responsibly: uses real-time calculations only, no future-data lookahead.
Visuals on the published chart reflect default input values exactly.

Liquidity Swing Points [BackQuant]Liquidity Swing Points
This tool marks recent swing highs and swing lows and turns them into persistent horizontal “liquidity” levels. These are places where resting orders often accumulate, such as stop losses above prior highs and below prior lows. The script detects confirmed pivots, records their prices, draws lines and labels, and manages their lifecycle on the chart so you can monitor potential sweep or breakout zones without manual redrawing.
What it plots
LQ-H at confirmed swing highs
LQ-L at confirmed swing lows
Horizontal levels that can optionally extend into the future
Timed removal of old levels to keep the chart clean
Each level stores its price, the bar where it was created, its type (high or low), plus a label and a line reference for efficient updates.
How it works
Pivot detection
A swing high is confirmed when the highest high has swing_length bars on both sides that are lower.
A swing low is confirmed when the lowest low has swing_length bars on both sides that are higher.
Pivots are only marked after they are confirmed, so they do not repaint.
Level creation
When a pivot confirms, the script records the price and the creation bar (offset by the right lookback).
A new line is plotted at that price, labeled LQ-H or LQ-L.
Rendering and extension
Levels can be drawn to the most recent bar only or extended to the right for forward reference.
Label size and line color/transparency are configurable.
Lifecycle management
On each confirmed bar, the script checks level age.
Levels older than a chosen bar count are removed automatically to reduce clutter.
How it can be used
Liquidity sweeps: Watch for price to probe beyond a level then close back inside. That behavior often signals a potential fade back into the prior range.
Breakout validation: If price pushes through a level and holds on closes, traders may treat that as continuation. Retests of the level from the other side can serve as structure checks.
Context for entries and exits: Use nearby LQ-H or LQ-L as reference for stop placement or partial-take zones, especially when other tools agree.
Multi-timeframe mapping: Plot swing points on higher timeframes, then drill down to time entries on lower timeframes as price interacts with those levels.
Why liquidity levels matter
Prior swing points are focal areas where many strategies set stops or pending orders. Price often revisits these zones, either to “sweep” resting liquidity before reversing, or to absorb it and trend. Marking these areas objectively helps frame scenarios like failed breaks, successful breakouts, and retests, and it reduces the subjectivity of eyeballing structure.
Settings to know
Swing Detection Length (swing_length), Controls sensitivity. Lower values find more local swings. Higher values find more significant ones.
Bars until removal (removeafter), Deletes levels after a fixed number of bars to prevent buildup.
Extend Levels Right (extend_levels), Keeps levels projected into the future for easier planning.
Label Size (label_size), Choose tiny to large for chart readability.
One color input controls both high and low levels with transparency for context.
Strengths
Objective marking of recent structure without hand drawing
No repaint after confirmation since pivots are locked once the right lookback completes
Lightweight and fast with simple lifecycle management
Clear visuals that integrate well with any price-action workflow
Practical tips
For scalping: use smaller swing_length to capture more granular liquidity. Keep removeafter short to avoid clutter.
For swing trading: increase swing_length so only more meaningful levels remain. Consider extending levels to the right for planning.
Combine with time-of-day filters, ATR for stop sizing, or a separate trend filter to bias trades taken at the levels.
Keep screenshots focused: one image showing a sweep and reversal, another showing a clean breakout and retest.
Limitations and notes
Levels appear after confirmation, so they are delayed by swing_length bars. This is by design to avoid repainting.
On very noisy or illiquid symbols, you may see many nearby levels. Increasing swing_length and shortening removeafter helps.
The script does not assess volume or session context. Consider pairing with volume or session tools if that is part of your process.

SMC - Institutional Confidence Oscillator [PhenLabs]📊 Institutional Confidence Oscillator
Version: PineScript™v6
📌 Description
The Institutional Confidence Oscillator (ICO) revolutionizes market analysis by automatically detecting and evaluating institutional activity at key support and resistance levels using our own in-house detection system. This sophisticated indicator combines volume analysis, volatility measurements, and mathematical confidence algorithms to provide real-time readings of institutional sentiment and zone strength.
Using our advanced thin liquidity detection, the ICO identifies high-volume, narrow-range bars that signal institutional zone formation, then tracks how these zones perform under market pressure. The result is a dual-wave confidence oscillator that shows traders when institutions are actively defending price levels versus when they’re abandoning positions.
The indicator transforms complex institutional behavior patterns into clear, actionable confidence percentiles, helping traders align with smart money movements and avoid common retail trading pitfalls.
🚀 Points of Innovation
Automated thin liquidity zone detection using volume threshold multipliers and zone size filtering
Dual-sided confidence tracking for both support and resistance levels simultaneously
Sigmoid function processing for enhanced mathematical accuracy in confidence calculations
Real-time institutional defense pattern analysis through complete test cycles
Advanced visual smoothing options with multiple algorithmic methods (EMA, SMA, WMA, ALMA)
Integrated momentum indicators and gradient visualization for enhanced signal clarity
🔧 Core Components
Volume Threshold System: Analyzes volume ratios against baseline averages to identify institutional activity spikes
Zone Detection Algorithm: Automatically identifies thin liquidity zones based on customizable volume and size parameters
Confidence Lifecycle Engine: Tracks institutional defense patterns through complete observation windows
Mathematical Processing Core: Uses sigmoid functions to convert raw market data into normalized confidence percentiles
Visual Enhancement Suite: Provides multiple smoothing methods and customizable display options for optimal chart interpretation
🔥 Key Features
Auto-Detection Technology: Automatically scans for institutional zones without manual intervention, saving analysis time
Dual Confidence Tracking: Simultaneously monitors both support and resistance institutional activity for comprehensive market view
Smart Zone Validation: Evaluates zone strength through volume analysis, adverse excursion measurement, and defense success rates
Customizable Parameters: Extensive input options for volume thresholds, observation windows, and visual preferences
Real-Time Updates: Continuously processes market data to provide current institutional confidence readings
Enhanced Visualization: Features gradient fills, momentum indicators, and information panels for clear signal interpretation
🎨 Visualization
Dual Oscillator Lines: Support confidence (cyan) and resistance confidence (red) plotted as percentage values 0-100%
Gradient Fill Areas: Color-coded regions showing confidence dominance and strength levels
Reference Grid Lines: Horizontal markers at 25%, 50%, and 75% levels for easy interpretation
Information Panel: Real-time display of current confidence percentiles with color-coded dominance indicators
Momentum Indicators: Rate of change visualization for confidence trends
Background Highlights: Extreme confidence level alerts when readings exceed 80%
📖 Usage Guidelines
Auto-Detection Settings
Use Auto-Detection
Default: true
Description: Enables automatic thin liquidity zone identification based on volume and size criteria
Volume Threshold Multiplier
Default: 6.0, Range: 1.0+
Description: Controls sensitivity of volume spike detection for zone identification, higher values require more significant volume increases
Volume MA Length
Default: 15, Range: 1+
Description: Period for volume moving average baseline calculation, affects volume spike sensitivity
Max Zone Height %
Default: 0.5%, Range: 0.05%+
Description: Filters out wide price bars, keeping only thin liquidity zones as percentage of current price
Confidence Logic Settings
Test Observation Window
Default: 20 bars, Range: 2+
Description: Number of bars to monitor zone tests for confidence calculation, longer windows provide more stable readings
Clean Break Threshold
Default: 1.5 ATR, Range: 0.1+
Description: ATR multiple required for zone invalidation, higher values make zones more persistent
Visual Settings
Smoothing Method
Default: EMA, Options: SMA/EMA/WMA/ALMA
Description: Algorithm for signal smoothing, EMA responds faster while SMA provides more stability
Smoothing Length
Default: 5, Range: 1-50
Description: Period for smoothing calculation, higher values create smoother lines with more lag
✅ Best Use Cases
Trending market analysis where institutional zones provide reliable support/resistance levels
Breakout confirmation by validating zone strength before position entry
Divergence analysis when confidence shifts between support and resistance levels
Risk management through identification of high-confidence institutional backing
Market structure analysis for understanding institutional sentiment changes
⚠️ Limitations
Performs best in liquid markets with clear institutional participation
May produce false signals during low-volume or holiday trading periods
Requires sufficient price history for accurate confidence calculations
Confidence readings can fluctuate rapidly during high-impact news events
Manual fallback zones may not reflect actual institutional activity
💡 What Makes This Unique
Automated Detection: First Pine Script indicator to automatically identify thin liquidity zones using sophisticated volume analysis
Dual-Sided Analysis: Simultaneously tracks institutional confidence for both support and resistance levels
Mathematical Precision: Uses sigmoid functions for enhanced accuracy in confidence percentage calculations
Real-Time Processing: Continuously evaluates institutional defense patterns as market conditions change
Visual Innovation: Advanced smoothing options and gradient visualization for superior chart clarity
🔬 How It Works
1. Zone Identification Process:
Scans for high-volume bars that exceed the volume threshold multiplier
Filters bars by maximum zone height percentage to identify thin liquidity conditions
Stores qualified zones with proximity threshold filtering for relevance
2. Confidence Calculation Process:
Monitors price interaction with identified zones during observation windows
Measures volume ratios and adverse excursions during zone tests
Applies sigmoid function processing to normalize raw data into confidence percentiles
3. Real-Time Analysis Process:
Continuously updates confidence readings as new market data becomes available
Tracks institutional defense success rates and zone validation patterns
Provides visual and numerical feedback through the oscillator display
💡 Note:
The ICO works best when combined with traditional technical analysis and proper risk management. Higher confidence readings indicate stronger institutional backing but should be confirmed with price action and volume analysis. Consider using multiple timeframes for comprehensive market structure understanding.

ICT ULT
This indicator is for lazy people like me who want to automate the process of marking certain ICT key levels using the indicator's features, such as:
Custom Killzone/Session Liquidity Levels in form of Highs and Lows
Killzone Drawings (Boxes)
Previous Day High/Low (PDH/PDL)
Previous Day Equlibrium (PDEQ)
Previous Week High/Low
New Day/Week Opening Gaps (NDOG/NWOG)
Custom Opening Prices (horizontal) (e.g. Midnight Open)
Custom Timestamps (vertical)
*Note: All features are completely customizable
inspired by: @tradeforopp
ICT Session High/Low LevelsThis indicator automatically plots the Highs and Lows of completed sessions and draws lines for the Asian session and London session. Levels are displayed only after each session has closed. A simple tool for liquidity work and intraday context (SMC/ICT).

Svl - Trading SystemPrice can tell lies but volume cannot, so keeping this in mind I have created this indicator in which you see sell order block and buy order block on the basis of price action + volume through which we execute our trade
First of all, let us know its core concepts and logic, which will help you in taking the right decisions in it.
core concept of the " Svl - Trading System " TradingView indicator is based on professional price action, volume, and swing structure. This indicator smartly gives real-time insights of important price turning points, reversal zones, and trend continuation. Its deep explanation is given below.
Edit - default swing length -5 , change according your nature , tested With 7 For 5 minute timeframe
Core Concept:
1. Swing Structure Detection
The indicator automatically detects swing highs (HH/LH) and swing lows (HL/LL) on the chart.
HH: Higher High
HL: Higher Low
LH: Lower High
LL: Lower Low
These swings are the backbone of price action – signaling a change in trend, a bounce, reversal or trend continuation.
2. Order Block (OB) Mapping
Buy Order Block (Buy OB): When the indicator detects the HL/LL swing, we declare Buy OB, the lowest point of the swing.
Sell Order Block (Sell OB): On HH/LH swing, the highest point of our swing is called Sell OB.
Order Blocks are those important zones of price where historically price has reacted strongly – where major clusters of buyers/sellers are located in the market.
3. Volume Analysis (Optional Dashboard/Barcolor)
The candle color depends on the volume ranking on the chart (most high/low, normal, pressure blue shade).
Highest/lowest volume candles are a special highlight, which helps to spot liquidity spikes, exhaustion, or big orders.
4. Live Dashboard
There is an automated dashboard in the top-right of the chart, which shows this in real-time:
Last swing type (HH/HL/LH/LL)
Reversal price (last swing level)
Swing direction (Bull/Bear/Neutral)
Volume, Buy OB, Sell OB, etc.
This helps the trader understand the market situation at a glance.
5. Smart Plotting/Labels
Buy/Sell are plotted as distinct lines on the OB chart.
The Labels option gives clear visual swing points.
All calculations are fast and automated – the user does not need to mark manually.
This indicator is an advanced, fully-automated price action tool that combines
trend, reversal, volume, liquidity and zone detection in one smart system,
makes entry/exit decisions objective and error-free,
and provides complete trading confidence with a live monitor/dashboard.
All of its functions/properties such as: swing detect, OB plot, volume color, dashboard follow best practice for professional chart analysis!

Volume Spikes + Daily VWAP SD BandsVolume Spikes + Daily VWAP SD Bands
This indicator combines volume spike detection to help traders identify potential absorption zones with daily VWAP and standard deviation bands , key price levels, continuation opportunities, and possible institutional bias.
Features:
Volume Spike Detection
Highlights candles with unusually high volume relative to a configurable SMA.
Optional filters:
Local highs/lows only (Only Use Valid Highs & Lows)
Candle shapes: Hammer / Shooter only
Candle color match: bullish spikes on green, bearish on red
Plots small circles above/below bars for bullish and bearish volume spikes.
Alerts available for both bullish and bearish spikes.
Interpretation: Volume spikes at local highs/lows can indicate absorption, where one side absorbs aggressive buying/selling pressure.
Daily VWAP
Calculates volume-weighted average price (VWAP) for the current day.
Optionally shows previous day’s VWAP for reference.
Plot lines are customizable with optional circles on lines for visual clarity.
Labels on the last bar show exact VWAP values.
Institutional Bias Insight: Price above both current and previous VWAPs may indicate bullish positioning; price below both VWAPs may indicate bearish positioning. Many professional traders consider this a clue to institutional bias, but it’s not guaranteed. Always confirm with volume, delta, or orderflow analysis.
Standard Deviation Bands
Optional x1 and x2 SD bands around the daily VWAP.
Visual fill between bands shows price volatility zones.
Can be used to identify potential support/resistance or absorption zones.
Use Case: Price bounces off first SD band may indicate continuation signals, especially when volume spikes occur at those levels.
Customizable Visuals
Colors for bullish and bearish volume spikes
VWAP and SD band colors and thickness
Optional circles and filled bands for better readability
Alerts
Bullish / Bearish Volume Spikes
Supports TradingView alert system for automated notifications
Advanced Use Cases:
Combine with Cumulative Delta or Orderflow tools to confirm true absorption zones.
Identify high-volume rejection candles signaling possible trend continuation.
Use VWAP positioning relative to price to assess potential institutional bias, keeping in mind it is probabilistic, not guaranteed.
Visualize intraday VWAP levels and volatility with SD bands for better trade timing.
Settings: Fully customizable, including volume multiplier, SMA length, session filter, candle shape, color options, and VWAP/SD display preferences.

Lumiere’s Indicator BundleThe Lumiere’s Indicator Bundle combines three of Lumiere’s most used tools into one script:
🔹 BOS Mark-out – Marks Breaks of Structure with clear bullish/bearish levels and optional alerts.
🔹 Liquidity Mark-ou t – Draws significant swing highs/lows and automatically removes them once swept.
🔹 Trading Session High/Low – Tracks Asia, London, and New York session ranges with customizable timezone.
Why this bundle?
I made this bundle so everyone can run all my indicators at once without having to pick and choose between them or worry about chart space limits.
Instead of loading 3 separate indicators, this package gives you everything in one place. You can toggle each module (BOS, Liquidity, Sessions) on or off from the settings. All inputs are kept clean and organized in their own sections for easy adjustments.
What to expect
BOS lines always plotted on top for maximum clarity.
Liquidity highs/lows update in real time and get removed when taken out.
Session ranges show the active session’s high/low and can mark sweeps after the session closes.
Default timezone is New York (UTC-4), but you can switch to any TradingView-supported timezone.
BOS alerts are included, so you’ll never miss a structural break.

BTC Regime Phase [HY|YC|GLI]The correlation between global liquidity and INDEX:BTCUSD has attracted a lot of attention. Building on this insight, I developed an indicator that not only tracks global liquidity but also integrates the high‑yield spread and yield‑curve slope to capture credit risk and growth expectations.
Essence and Logic
At its core, the Risk‑On Composite Z‑Score converts three macro factors global liquidity momentum, the US high‑yield spread and the slope of the US yield curve into standardized Z‑scores, weights them, and tracks moving‑average crossovers. Each factor has a rationale: high‑yield spreads are powerful business‑cycle indicators and often outperform other financial variables (Gertler & Lown, 2000). Yield‑curve steepness reflects investor optimism and prompts shifts toward riskier assets global liquidity drives cross‑border flows and risk sentiment (Goldberg, 2023; Lee, 2024). Combining these measures gives a composite signal that has historically aligned well with Bitcoin’s tops and bottoms. Usable also for other crypto coins: INDEX:ETHUSD CRYPTO:SOLUSD CRYPTO:LINKUSD
Limitations and My Current Model Outlook
I want to be transparent: the three model sections are highly correlated. Currently, the high‑yield spread and yield curve data come only from the US; I may add Euro or Japanese spreads later. I’m also aware that macro dynamics are evolving. Fiscal policy and political choices could shorten bear markets and make the current sell signals less relevant. In a stagflationary world, inflation‑adjusted liquidity may swing more violently and require an asset‑inflation adjustment. Yet, the model has captured Bitcoin’s tops and bottoms almost to the week—future patterns may rhyme, not repeat.
Questions and Ideas:
Do you think this model will still be useful as fiscal and monetary regimes shift?
Should I add a stagnation modulation perhaps real yields or inflation‑adjusted liquidity—to better capture a stagflation scenario?
Are there high‑yield spreads on TV beyond the US that I should include? (Euro and Japan indices do exist.)
Would it make sense to incorporate Bitcoin halving events or a stock‑to‑flow module?
The indicator is free to use. If it brings you value, you’re welcome to follow for updates. I appreciate your support and feedback. When you are interested in the source code, feel free to contact me for more details. When you feel like supporting me with some sats, contact me and I will give you a Lightning address. I am a student and that would help a lot – but please only if you can afford it!
♡ Thanks to everyone who contributes insight on TradingView ♡
© Robinhodl21
Features: Users can enable or disable each component, adjust weights and choose a short‑tenor (1‑year or 2‑year) for the yield curve. The script automatically scales lookback windows based on the chart timeframe (daily, weekly or monthly). It offers visual plots of each Z‑score, the composite score, and smoothed moving averages, with background colours highlighting regimes and markers for entries and exits. Trade logic includes optional dip‑buy triggers when the composite falls below a threshold, Friday‑only execution on daily charts to reduce whipsaws. A trend table summarises current Z‑scores and their trends. Settings are tuned for BTC weekly data but should be adjusted for other assets or timeframes. Because some inputs (e.g., GLI weights) have limited historical data, long backtests may be less reliable when using on other Risk On Assets like NASDAQ:NDX NCDEX:COPPER
‼ Disclaimer: This indicator is for educational purposes and does not constitute investment advice. Markets involve risk; past performance is not indicative of future results. Users should not rely solely on this script for trading decisions. Always test and adapt settings to your asset, timeframe and risk tolerance. The author assumes no liability for any trading losses.
Literature:
Gertler, M., & Lown, C. S. (2000). The information in the high yield bond spread for the business cycle: Evidence and some implications. NBER Working Paper 7549.
Lee, B. (2024). Staying ahead of the yield curve. CME Group.
McCauley, R. N. (2012). Risk‑on/risk‑off, capital flows, leverage and safe assets. BIS Working Paper 382.
Goldberg, L. (2023). Global liquidity: Drivers, volatility and toolkits. Federal Reserve Bank of New York Staff Report 1064.
FRED (2025). ICE BofA Euro High Yield Index Option‑Adjusted Spread (BAMLHE00EHYIOAS). St. Louis Fed Data.
Office of Financial Research (2025). Financial Stress Index sources: High yield indices..
Tashev, T. (2025). The Bitcoin Stock‑to‑Flow Model: A comprehensive guide. Webopedia.

Previous Day High & Low (PDH / PDL) with HistoryThis indicator automatically plots the Previous Day High (PDH) and Previous Day Low (PDL) on your chart.
✨ Features:
📅 Multiple days of history (choose how many days to keep, or unlimited).
🎨 Custom colors and line styles (solid, dashed, dotted).
🔎 Show or hide levels once touched by price.
🏷️ Optional labels (“PDH” and “PDL”) that follow the line to the right edge.
🚀 Works on any market, any timeframe.
🔧 Use cases:
Identify key liquidity levels.
Track daily ranges for intraday trading.
Combine with other strategies for confluence.

FX4M by fx4_livingFX4M Simplified by fx4_living
1. Previous Period Framework
Selectable Period: Prior Daily, Weekly, or Monthly.
Range Box: Full high-to-low span of the prior period, shaded by up/down close.
Body Box: Open-to-close section within the range box.
High/Low Lines: Horizontal lines at the previous period’s high/low.
Equilibrium Line: Midpoint between the previous high and low.
2. Intraday Opening Lines
Plots reference price lines for:
Daily Open
(00:00 New York) Midnight Open
09:30 AM Open
13:30 PM Open
Current-Hour Open; plus Weekly/Monthly Opens when Weekly/Monthly is selected.
Each line has its own color, style, and time/price label.
3. Intraday High/Low Tracking
Marks the current day’s highest and lowest prices.
“D-H” and “D-L” labels with time in tooltip.
4. Accumulation Range
Definition: First one-third of the selected reference period.
Shows full range (high-to-low) and body (open-to-close), shaded by up/down close.
After it ends, the Accumulation High/Low/EQ are drawn as horizontal lines.
Optional alerts mark the first time the Accumulation High or Low is reached.
5. Accumulation Range Deviation Levels
After the Accumulation period ends, horizontal levels are drawn at ±0.5, ±1.0, ±1.5 … ±3.5 of the Accumulation range size from its High/Low. Optional small labels show the level value.
Optional alerts mark the first time each deviation level is reached.
6. Previous Period Hit Detection
Marks the first time price reaches the prior period’s High, Low, or Equilibrium during the current period.
Optional alerts are possible.
7. Pre-Market Zone
Marks 05:00–06:59 New York time with a shaded box and dotted midline; color reflects up/down close. The midline can extend forward.
Displayed on intraday charts up to 15 minutes.
8. Status Table
Daily High (time & price)
Daily Equilibrium (current deviation % and price)
Daily Low (time & price)
MWD Institutional order flow (optional): shows Daily/Weekly/Monthly closes vs. their respective opens (directional arrows in colored cells).
Customizable Watermark (optional).
Enjoy
fx4_living
Liquidity Sweep Scanner [TradingFinder]🔵 Introduction
Recognizing how liquidity develops and how price reacts at key structural levels is critical for spotting precise, low-risk trade entries. The Liquidity Sweep Scanner is an advanced tool built to track market activity in real time, pinpoint liquidity sweeps, define reaction zones, and identify confirmation candles across multiple instruments and timeframes.
Key Advantages :
Detects high-probability reversal points with precision.
Combines liquidity analysis, market structure, and candle confirmation.
Works seamlessly across multiple symbols and timeframes.
This screener can scan a broad watchlist or analyze every timeframe of a single asset to find optimal reversal zones. It starts by identifying a clear swing point either a swing high or swing low and marking a reaction zone between that point and the candle’s highest or lowest open/close value.
If price revisits the zone, performs a liquidity grab, and forms an indecision candle such as a doji or narrow-bodied bar that closes inside the zone, this may indicate rejection of the level and a failed breakout attempt. Based on the surrounding market context, the screener then flags a potential bullish or bearish reversal and generates the appropriate Long or Short signal.
By focusing on precise entry timing, institutional order flow alignment, and filtering out false breakouts, the Liquidity Sweep Scanner zeroes in on the market areas where liquidity engineering, reversal potential, and inefficiency overlap. This makes it an indispensable tool for price action traders who rely on clear, high-quality setups without the distraction of market noise.
🔵 How to Use
The Liquidity Sweep Scanner continuously evaluates market structure, issuing alerts when a potential reversal setup emerges. It merges liquidity behavior, swing point analysis, and candle confirmation within predefined reaction zones.
To illustrate, imagine price forms a swing high or low, then later returns to that level. If it sweeps the prior extreme and produces a qualifying candle inside the reaction zone, the tool signals a possible reversal.
🟣 Long Setup
For a bullish scenario, the screener first spots a valid swing low a level often packed with sell-side liquidity. From there, it defines a reaction zone stretching from the swing low to the candle’s lowest open/close point.
If price retests this area with a wick dipping below the swing low but then closes back inside the zone, it signals absorption of selling pressure and rejection of further downside. The screener then awaits a confirmation candle commonly a doji or small-bodied bar closing inside the zone. Once these conditions align, a Long signal is logged and, if alerts are active, the trader receives a notification.
🟣 Short Setup
For bearish opportunities, the process begins by locating a valid swing high typically an area dense with buy-side liquidity. The reaction zone is drawn from the swing high to the candle’s highest open/close value.
When price retests this zone, sweeps above the swing high, and fails to close higher, it suggests a bull trap and waning upward momentum. The screener then requires a confirmation candle often a doji or rejection bar that closes back within the zone before confirming a Short signal.
These bearish setups help traders pinpoint likely institutional sell zones, offering a clear view of where price may reverse following a liquidity event.
🔵 Settings
🟣 Logical settings
Liquidity Swing period : You can set the swing detection period.
Market Structure Period :You can set the Pivot Period to determine the detection direction.
Max Swing Back Method : It is in two modes "All" and "Custom". If it is in "All" mode, it will check all swings, and if it is in "Custom" mode, it will check the swings to the extent you determine.
Max Swing Back : You can set the number of swings that will go back for checking.
Maximum Distance Between Swing and Signal : The maximum number of candles allowed between the swing point and the potential signal. The default value is 50, ensuring that only recent and relevant price reactions are considered valid.
🟣 Display Settings
Table on Chart : Allows users to choose the position of the signal dashboard either directly on the chart or below it, depending on their layout preference.
Number of Symbols : Enables users to control how many symbols are displayed in the screener table, from 10 to 20, adjustable in increments of 2 symbols for flexible screening depth.
Table Mode : This setting offers two layout styles for the signal table :
Basic : Mode displays symbols in a single column, using more vertical space.
Extended : Mode arranges symbols in pairs side-by-side, optimizing screen space with a more compact view.
Table Size : Lets you adjust the table’s visual size with options such as: auto, tiny, small, normal, large, huge.
Table Position : Sets the screen location of the table. Choose from 9 possible positions, combining vertical (top, middle, bottom) and horizontal (left, center, right) alignments.
🟣 Symbol Settings
Each of the 10 symbol slots comes with a full set of customizable parameters :
Symbol : Define or select the asset (e.g., XAUUSD, BTCUSD, EURUSD, etc.).
Timeframe : Set your desired timeframe for each symbol (e.g., 15, 60, 240, 1D).
🟣 Alert Settings
Alert : Enables alerts for LSS.
Message Frequency : Determines the frequency of alerts. Options include 'All' (every function call), 'Once Per Bar' (first call within the bar), and 'Once Per Bar Close' (final script execution of the real-time bar). Default is 'Once per Bar'.
Show Alert Time by Time Zone : Configures the time zone for alert messages. Default is 'UTC'.
🔵 Conclusion
The Liquidity Sweep Scanner equips traders with a precise, structured method for spotting high-probability reversals by merging liquidity sweeps, reaction zone mapping, and candle confirmation.
It not only filters out market noise but also highlights price areas where inefficiency and reversal potential align. Beyond identifying clean entry points, the tool includes a market direction detection feature allowing traders to quickly determine the prevailing trend and align their trades accordingly.
With adjustable settings such as the Pivot Period for fine-tuning detection direction, it adapts to various trading styles and timeframes, making it a powerful and versatile addition to any trader’s strategy.
付费脚本

Apex Edge – Liquidity RaiderApex Edge – Liquidity Raider
The Predator That Hunts Where Retail Never Looks
The Liquidity Raider is not your average liquidity line plotter.
This is an institutional-grade hunting system that tracks the pools of liquidity Smart Money algos stalk — and tells you exactly when price is circling in for the strike.
Where most retail tools simply mark lines, this one acts like a predator:
Scans the chart dynamically to detect clustered highs & lows (pivot-based liquidity zones).
Filters noise with sensitivity & price rounding so you only get real liquidity levels — not every random swing.
Plots live BSL (Buy-Side Liquidity) & SSL (Sell-Side Liquidity) lines in clean dotted format.
Auto-deletes levels when swept, so your chart stays clean and focused.
Triggers directional arrows when price comes within your specified % distance to the target liquidity pool — before the market moves.
EMA confluence layer lets you align with institutional flow (customizable Fast & Slow EMAs).
Core Power
Cluster Logic – Finds high-probability liquidity zones using repeated pivot levels.
Sweep Awareness – Lines vanish the moment liquidity is taken, keeping focus on the next pool.
Proximity Strike Detection – Arrow signals only when price is within striking range.
Directional Clarity – Red arrows = targeting BSL, Green arrows = targeting SSL.
Scalable Across Timeframes – Adapts to your chart’s timeframe with dynamic lookback scaling.
Institutional Flow Filter – Optional EMA confirmation keeps you aligned with the real trend.
How to Use
Identify liquidity pools – Dotted green = buy-side, dotted red = sell-side.
Watch proximity arrows – These mean price is in range and hunting that pool.
Align with EMA bias – Enter only in the direction of institutional momentum.
Target the sweep – Your take profit is where the liquidity is resting.
Why Liquidity Raider Wins
This is not a lagging signal system.
It’s a real-time, clean, predictive tool designed to mimic the targeting logic of high-frequency algos.
By removing swept levels and focusing only on the next available pools, Liquidity Raider keeps you one step ahead of the crowd — and perfectly positioned for the kill shot.
