Daily Bias Trade Manager [MarkitTick]💡 The Daily Bias Trade Manager is a sophisticated technical analysis suite designed to automate the identification of high-probability intraday setups based on liquidity concepts and structural shifts. By synthesizing Previous Day High/Low (PDH/PDL) interactions with momentum confirmation and strict risk management protocols, this tool assists traders in navigating the "Daily Bias." It moves beyond simple signal generation by offering a complete trade management visualization system, projecting entries, stop losses, and take-profit levels directly onto the chart in real-time.
✨ Originality and Utility
This script distinguishes itself by integrating institutional price action theory—specifically Liquidity Sweeps and Change in State of Delivery (CISD)—with mechanical filtering. While many indicators simply highlight highs and lows, the Daily Bias Trade Manager validates these levels by analyzing what happens *after* price tests them.
It solves a common problem for intraday traders: "Analysis Paralysis." By automating the detection of structure breaks (MSS) and Fair Value Gaps (FVG) following a sweep of daily liquidity, it provides an objective framework for entry. Furthermore, the built-in "Position Box" feature removes the guesswork from trade execution by instantly calculating risk-to-reward ratios and visualizing them, allowing traders to see the feasibility of a trade before execution.
🔬 Methodology and Concepts
The core logic operates on a sequential detection model:
Liquidity Identification: The script first plots the Previous Day High (PDH) and Previous Day Low (PDL). These are critical institutional reference points where stop-loss orders (liquidity) often reside.
The Sweep: A "Sweep" is confirmed when price breaches a PDH/PDL but fails to sustain the breakout, closing back inside the previous day's range. This suggests a "Fake-out" or liquidity grab, often a precursor to a reversal.
Change in State of Delivery (CISD): Following a sweep, the script monitors local market structure. It looks for a decisive close past a recent swing point (Swing High for shorts, Swing Low for longs) within a user-defined bar window. This confirms that the counter-trend move has momentum.
Confluence Filtering: To reduce false positives, the engine applies optional filters:
RVOL (Relative Volume): Ensures the sweep occurred on significant volume (Climax behavior).
RSI Momentum: Verifies that momentum supports the reversal direction.
Trend Filter: Uses a long-term EMA to ensure trades align with the broader market direction.
Entry Model: Upon validation, the script calculates an entry at the close (or optionally at a Fair Value Gap), places a Stop Loss at the sweep extreme, and projects three Take Profit targets based on configurable R:R ratios.
🎨 Visual Guide
The indicator uses a distinct color-coded system to keep the chart clean yet informative:
● Liquidity Levels & Sweeps
Orange/Blue Lines: Represent the PDH (Previous Day High) and PDL (Previous Day Low).
Teal Shaded Zones: Indicate a "Buy-Side Sweep" (Price took highs and rejected).
Red Shaded Zones: Indicate a "Sell-Side Sweep" (Price took lows and rejected).
● Position Management Boxes
When a signal triggers, a structured box appears:
Solid Gray Line: The theoretical Entry Price.
Solid Red Line: The Stop Loss (SL), typically placed at the swing high/low of the sweep.
Dashed Blue Lines: Represent TP1, TP2, and TP3 targets based on Reward-to-Risk settings.
Labels: Data tags on the right side of the box show exact price coordinates for Entry, SL, and Targets.
● Signals & Clouds
Green "BUY" Labels: Appear below the bar when a bullish sweep and structural shift are confirmed.
Red "SELL" Labels: Appear above the bar when a bearish sweep is validated.
Yellow Clouds: Highlight Fair Value Gaps (FVG) used for entry confluence or retests.
● Multi-Timeframe (MTF) Dashboard
A panel (default: Top Right) displays the status of up to three higher timeframes.
Trend: Shows "BULL" or "BEAR" based on EMA alignment.
Liquidity: Indicates if the timeframe is "Taking Buy Liq", "Taking Sell Liq", or "Inside Range".
📖 How to Use
● Bullish Reversal Setup
Wait for price to drop below the Blue PDL Line.
Look for a Red Sell-Side Sweep Zone to form, indicating price has rejected lower prices.
Wait for the Green BUY Signal . This confirms a shift in structure (CISD) back to the upside.
Observe the Position Box. If the Risk/Reward is favorable (targets are within reasonable reach), consider the trade.
Optional: Use the "Dynamic Targets" setting to target the previous swing high instead of a fixed ratio.
● Bearish Reversal Setup
Wait for price to rally above the Orange PDH Line.
Look for a Teal Buy-Side Sweep Zone .
Wait for the Red SELL Signal confirming the rejection.
Ensure the dashboard shows alignment (e.g., Higher Timeframe Trend is Bearish) for higher probability.
● Trade Management
Enable the "ATR Trailing Stop" in settings to have the Stop Loss line dynamically adjust as price moves in your favor, locking in potential gains.
⚙️ Inputs and Settings
● General & Display
Show Daily Liquidity: Toggles the PDH/PDL lines.
Max Signals/Zones: Limits the visual clutter by restricting historical shapes.
● Detection Logic
Swing Detection Length: Controls the sensitivity of pivot points. Higher numbers = fewer, more significant swings.
CISD Window: How many bars after a sweep are allowed for the structure shift to occur.
Use FVG Entry: If true, the signal waits for a retest of a gap rather than entering immediately at the close.
● Filters
Volume (RVOL): Requires the sweep candle volume to be X times larger than average.
Trend Filter: Only allows Buy signals above the EMA and Sell signals below it.
Session Filter: Restricts signals to specific hours (e.g., New York Killzone).
● Targets & Management
Target R:R: Sets the multiplier for TP1, TP2, TP3 relative to the stop loss distance.
Use Dynamic Targets: Targets structural liquidity (Previous Highs/Lows) instead of fixed math ratios.
ATR Trailing Stop: Activates the trailing stop mechanism.
🔍 Deconstruction of the Underlying Scientific and Academic Framework
This indicator is grounded in the principles of Market Microstructure and Mean Reversion theory .
1. Liquidity Pools & Stop Runs:
Academic literature on market microstructure suggests that order flow clusters around obvious visual references (PDH/PDL). Large market participants often utilize this "resting liquidity" to fill large block orders with minimal slippage. The "Sweep" logic detects this absorption phase.
2. Volatility Breakout vs. Fake-out:
The script differentiates between a genuine breakout and a mean-reverting "fake-out" by analyzing the Close relative to the Range . A close back within the prior day's range after a breach signifies a failure of auction in the new territory, statistically increasing the probability of a reversion to the mean (equilibrium).
3. Momentum Validation (RSI & RVOL):
By integrating Relative Volume (RVOL) and RSI, the script applies statistical significance testing to the price action. High volume at a range extreme without price progress (the sweep) indicates "Stopping Volume" or absorption, a key concept in Volume Spread Analysis (VSA).
🙏 Gratitude
I would like to express my gratitude to harry040708 for sharing the insightful idea that made this script possible.
⚠️ Disclaimer
All provided scripts and indicators are strictly for educational exploration and must not be interpreted as financial advice or a recommendation to execute trades. I expressly disclaim all liability for any financial losses or damages that may result, directly or indirectly, from the reliance on or application of these tools. Market participation carries inherent risk where past performance never guarantees future returns, leaving all investment decisions and due diligence solely at your own discretion.
Liquiditysweep

Blockcircle FTR - Follow Through ReversalWHAT THIS INDICATOR DOES
Blockcircle FTR identifies failed directional moves followed by quality reversals. The indicator tracks structural pivot levels, monitors price interactions with those levels, and validates reversal sequences against a configurable threshold.
A trend filter provides macro context so you can evaluate whether signals align with or oppose the broader direction.
KEY FEATURES
Reversal quality filtering via delivery threshold requirement
Sweep confirmation when reversals follow liquidity grabs at structural levels
ATR-adaptive origin zones marking reversal starting points
Trend alignment indicator comparing signal bias to moving average direction
Volume validation filter for participation confirmation
Real-time dashboard with signal statistics and alignment status
DETAILED BREAKDOWN
Structural Level Tracking
The indicator identifies pivot highs and lows based on the Structure Lookback parameter. These pivots serve as reference levels where liquidity typically accumulates. Levels remain active until price interacts with them or they exceed the Level Lifespan setting.
When the price reaches a structural level, this interaction is logged. If a reversal then forms in the opposite direction within the Sweep Window, the signal qualifies as sweep-confirmed, indicating that stops were likely triggered before the move reversed.
FTR Detection Logic
The core detection looks for a specific sequence: a directional attempt that fails to follow through, followed by a counter-move that meets the Delivery Threshold ratio. This ratio measures the quality of the reversal relative to the failed move's structure.
Higher threshold values (closer to 1.0) require cleaner, more convincing reversals. Lower values (closer to 0.1) allow weaker setups through. The default of 0.7 provides reasonable filtering without being overly restrictive.
Trend Context Filter
A moving average (EMA or SMA, configurable period) provides simple trend context. The dashboard displays three related metrics:
Trend: Current price position relative to the MA (Bullish/Bearish)
FTR Bias: Direction of the most recent confirmed signal (Long/Short)
Aligned: Whether these two readings match (Yes/No)
This helps identify situations where the FTR bias has become stale or is positioned against the prevailing trend.
Signal Classification
Standard signals appear as small triangles and represent FTR patterns that passed the delivery threshold and any active filters.
Sweep-confirmed signals appear with an "S" label and represent the subset of signals where price swept a structural level shortly before the reversal formed. These carry higher conviction due to the additional liquidity context.
Dashboard Metrics
The information panel provides:
Current trend direction and FTR bias
Alignment status between the two
Bars elapsed since the last signal
Running totals for long and short signals
Sweep-confirmed counts in parentheses
Volume filter status
Configuration Parameters
Structure Lookback: Bars used for pivot detection. Higher values capture more significant swings.
Delivery Threshold: Minimum ratio for valid reversals. Range 0.1 to 1.0.
Level Lifespan: The maximum bars a structural level remains active.
Sweep Window: Lookback period for sweep confirmation.
Trend MA Period: Moving average length for trend context.
Volume Spike Multiple: Required volume ratio when volume filter is active.
Zone Depth: Origin zone width as ATR multiple.
Practical Application
Sweep-confirmed signals with trend alignment represent the highest-conviction setups. These combine a quality reversal pattern, liquidity sweep context, and trend support.
Standard signals without sweep confirmation remain valid FTR patterns but warrant additional discretion.
Counter-trend signals (Aligned showing NO) can still produce valid moves, but historically carry lower probability. Consider position sizing adjustments accordingly.
Origin zones serve as potential support/resistance areas for subsequent price returns.
Important Limitations
The indicator may remain biased in the wrong direction during extended trends if no qualifying reversal pattern forms. The trend filter helps identify these situations, but does not automatically override the FTR bias.
Signal counts are calculated on visible chart history and will vary based on the loaded timeframe and bar count.
As with any technical tool, signals should be evaluated within the broader market context rather than traded mechanically.
Hope you find it useful! If you have any questions, please don't hesitate to ask them!

Liquidity OS [PyraTime]Trading the lower timeframes (1m-15m) often feels like navigating a minefield. Charts become cluttered with noise, making it nearly impossible to distinguish random price action from genuine institutional intent. Traders frequently suffer from "Analysis Paralysis," struggling to spot clean setups or reacting too slowly to calculate risk accurately in fast-moving markets.
The Solution: A Clean Operating SystemPyraTime: Liquidity OS was engineered to solve this specific problem. It is not just a signal tool; it is a complete visual operating system designed to declutter your workspace and enforce discipline. By filtering price action through a strict confluence of Structure, Time, and Momentum, it highlights only high-probability liquidity sweeps while automating the complex mental math of risk management.
How to Use This Indicator
This tool is designed for Scalpers and Day Traders utilizing liquidity concepts (ICT/SMC).
Wait for the Signal: The indicator automatically identifies valid "Unicorn" setups—a confluence of a Liquidity Sweep followed by a displacement (Breaker) and a Fair Value Gap.
Verify the Context: Look for the "Elite Glass" Capsule.
Cyan Glass: Bullish Setup (Long Opportunity).
Pink Glass: Bearish Setup (Short Opportunity).
Note: The capsule physically covers messy wicks, forcing your eye to focus solely on the clear path to profit or invalidation.
Consult the Dashboard: Glance at the "Monitor" panel (bottom right). It instantly displays the Position Size required to trade the setup based on your pre-defined account risk (e.g., 1%).
Execute & Focus: Use the visual TP (Take Profit) and SL (Stop Loss) lines provided by the capsule to set your orders. The system automatically dims old trades ("Smart Spotlight") so only the current opportunity competes for your attention.
Key Features
🦁 "Elite Glass" Visual Engine: A proprietary rendering system that displays trade setups as high-transparency, polished capsules. This creates a "Focus-First" environment, reducing chart noise and visual fatigue.
🧠 Smart Spotlight: Automatically manages visual history. The two most recent active zones remain bright, while older setups automatically dim to reduce clutter. Mitigated zones can be set to turn into "Ghosts" or disappear entirely.
🛡️ Risk OS Dashboard: A real-time, persistent monitor that calculates:
Dynamic Position Sizing: Tells you exactly how many units/contracts to trade.
Session Metrics: Tracks Win Rate, Total R, and Expectancy live.
Safety Warnings: Highlights "High Risk" inputs in red if you exceed safety thresholds.
⚡ Logic Filters:
Killzones: Restrict signals to specific sessions (e.g., London/NY) with a custom timezone selector.
Trend Flow: Filters signals to align with the 4H Trend (EMA 50).
Deep Value: Ensures buys occur in Discount and sells in Premium zones.
Specifications & Settings
Risk OS: Customizable Target R:R, Stop Loss Padding (ATR Multiplier), and Risk Per Trade %.
Liquidity Filters: "1m Scalp Mode" (increased sensitivity), Killzone Time/Timezone selector, and Force Reset button.
Visual Interface: Fully customizable colors. Toggles for "Show Midlines" (50% of FVG) and "Show Structure Breaks" (BOS lines) to further reduce noise.
Performance: Built on Pine Script v6 with null-safe execution and optimized garbage collection for zero-lag performance on all timeframes.
Disclaimer: Risk metrics, position sizing, and performance data displayed by this indicator are for informational and educational purposes only. This tool does not execute trades, manage funds, or guarantee future results. Always trade with a regulated broker and verify calculations independently.

FVG Finder | NRP | ProjectSyndicate🥇 ProjectSyndicate Fair Value Gap (FVG) Finder — Pine Script v6 • NRP Non-Repainting
📌 SMC Imbalance Zones Built for Clean Entries, Targets & Mitigation Tracking
The ProjectSyndicate FVG Finder is a professional TradingView indicator designed for traders who want clean, high-probability Fair Value Gaps price imbalances mapped instantly on-chart—without manual marking or clutter.
Fair Value Gaps form during aggressive displacement when price delivers inefficiently, leaving a void that price often returns to rebalance. This tool helps you spot those zones fast, track whether they’re still fresh, and plan entries with confidence. ✅
________________________________________
🚀 Why Traders Like It
✅ NRP Logic (Non-Repainting): Signals are built to remain stable once confirmed
✅ Real-Time FVG Detection: Automatically identifies bullish + bearish FVG zones as they form
📦 Clean Zone Visualization: Boxed imbalance areas that are easy to trade from
🧹 Auto-Cleanup (Mitigation): Zones update based on your chosen fill rule (Touch / 50% / Full)
🎛️ Anti-Noise Filtering: Minimum size + optional ATR filter to remove weak gaps
⚡ Pine Script v6: Built on the latest TradingView engine for stability and performance
🔔 Alerts + Markers: Get notified when new FVGs print + optional triangle signals
________________________________________
Gold H1 TF active FVGs
Eur Usd M30 TF active FVGs
NQ H1 TF active FVGs
🧠 Detection Logic — Simple, Effective, Battle-Tested
📈 Bullish Fair Value Gap (Demand Imbalance):
A 3-candle imbalance where the low of Candle 3 is above the high of Candle 1
➡️ Signals strong buy-side displacement / inefficient delivery
📉 Bearish Fair Value Gap (Supply Imbalance):
A 3-candle imbalance where the high of Candle 3 is below the low of Candle 1
➡️ Signals strong sell-side displacement / inefficient delivery
________________________________________
🧹 Mitigation Options — Choose How Filled Works
Your strategy decides what counts as used:
👆 Touch: Zone considered mitigated on first interaction
🎯 50% Fill: Mitigated once price fills half the gap
✅ Full Fill: Mitigated only when the entire zone is filled
Optional: Keep mitigated zones visible or hide them for ultra-clean charts.
________________________________________
🛠 Recommended Settings (ATR Multiplier Presets)
Use these as solid starting points on M30 / H1:
•🥇 XAUUSD (Gold) M30/H1: 0.5
•💻 NQ (Nasdaq) M30/H1: 0.25
•🛢️ USOIL M30/H1: 0.25
•₿ BTCUSD M30/H1: 0.25
•💶 EURUSD / GBPUSD M30/H1: 0.25 – 0.50
✅ Other markets are supported too just adjust the ATR Multiplier based on how many signals you want:
•More signals → lower multiplier
•Higher quality → higher multiplier
________________________________________
✅ Best Use-Cases
🎯 Mark imbalance zones instantly without manual drawing
🧲 Wait for price to return to FVG for cleaner entries
🛡️ Use zone boundaries for clear invalidation / stop placement
📊 Combine with trend bias + BOS/CHoCH + premium/discount for higher confirmation
🎯 Use FVGs as both entries and profit targets
________________________________________
⭐ How You Can Support ProjectSyndicate (3 Steps)
1. ✅ Click “Add to Favorites” to save this script to your TradingView Favorites
2. 🔎 Check out our other scripts to complete your SMC toolkit
3. 👤 Follow ProjectSyndicate for the latest updates, upgrades, and new releases
Order Block Finder | Gold | ProjectSyndicate
Breaker Blocks Finder | Gold | ProjectSyndicate

Smart Fixed Volume Profile [MarkitTick]💡 This comprehensive analysis suite integrates Auction Market Theory, structural gap analysis, and statistical liquidity strain modeling into a single, cohesive toolkit. Designed for traders who require a granular view of institutional order flow, this indicator overlays a Fixed Range Volume Profile with intelligent price gap classification and a volatility-adjusted exhaustion detector. By combining these three distinct analytical dimensions, it allows users to identify value consensus, structural breakouts, and potential market turns driven by liquidity shortages.
✨ Originality and Utility
While standard Volume Profiles display where trading occurred, this script advances the concept by contextually analyzing *how* price arrived at those levels. It solves the problem of isolated analysis by fusing three disparate methodologies:
Contextual Integration: It does not merely show support and resistance; it qualifies moves using "Smart Gaps" (classifying gaps based on market structure) and "Liquidity Strain" (identifying unsustainable price velocity).
Institutional Footprint: The inclusion of an "Unusual Volume" highlighter within the profile bars helps traders spot hidden institutional accumulation or distribution blocks that standard profiles miss.
Hybrid Logic: By combining a fixed-time profile (anchored to specific dates) with dynamic, developing gap analysis, it provides both a static roadmap of the past and a dynamic interpretation of current price action.
🔬 Methodology and Concepts
• Fixed Volume Profile Engine
The core of the indicator constructs a volume distribution histogram over a user-defined time window. It utilizes a custom aggregation engine that:
Fetches higher-timeframe volume and price data to ensure accuracy.
Segments the price range into specific "bins" or rows.
Allocates volume to these bins based on price action within the bar, separating Buying Volume (Up bars) from Selling Volume (Down bars).
Calculates the Point of Control (POC) —the price level with the highest traded volume—and the Value Area , which contains 70% (customizable) of the total volume centered around the POC.
• Smart Gap Logic
The script systematically identifies price gaps and classifies them based on their location relative to market pivots (Highs/Lows):
Breakaway Gaps: Occur when price gaps beyond a significant structural pivot (Lookback High/Low), signaling a potential trend initiation.
Runaway Gaps: Occur within an existing trend without breaking structure, indicating trend continuation.
Exhaustion Gaps: Identified when a gap occurs late in a mature trend (measured by bar count since the last pivot) accompanied by a volume spike, suggesting the trend is overextended.
• Liquidity Strain Detector
This module utilizes a statistical approach to measure market stress. It calculates "Illiquidity" by analyzing the ratio of True Range to Volume (Price Impact).
It applies a Logarithmic transformation to normalize the data.
It calculates a Z-Score (Standard Deviation from the mean) of this impact.
If the Z-Score exceeds a threshold (e.g., 2.0 Sigma) while the trend opposes the price move, it triggers an exhaustion signal, indicating that price is moving too easily on too little volume (thin liquidity).
🎨 Visual Guide
• Volume Profile Elements
Histogram Bars: Horizontal bars representing volume at price. Cyan indicates bullish volume; Red indicates bearish volume.
Unusual Volume Highlight: Bars with volume exceeding the average by a set factor (default 2x) are highlighted with brighter, distinct overlays to denote institutional interest.
POC Line: A solid Yellow line marking the price level with the highest volume.
VAH / VAL Lines: Dashed Blue lines marking the Value Area High and Value Area Low.
Background Box: A grey shaded area encapsulating the entire time and price range of the profile.
• Smart Gap Boxes
Blue Box (Breakaway): Marks the start of a new structural move.
Orange Box (Runaway): Marks continuation gaps in the middle of a trend.
Red Box (Exhaustion): Marks potential trend termination points.
Dotted Lines: Extend from the center of gap boxes to serve as future support/resistance levels. These boxes are automatically deleted if price "fills" or violates the gap level.
Note: This tool incorporates core components from [ Smart Gap Concepts ], optimized for this specific strategy.
• Liquidity Signals
Green Label (SE): "Seller Exhaustion" – Appears below bars in a downtrend when selling pressure is statistically overextended.
Red Label (BE): "Buyer Exhaustion" – Appears above bars in an uptrend when buying pressure is statistically overextended.
Note: This tool incorporates core components from [ Liquidity Strain Detector ], optimized for this specific strategy.
📖 How to Use
• Interactive Range Selection: This indicator features a flexible, interactive input system. Upon adding the script to your chart, execution is paused until the analysis range is defined. You will be prompted to click on the chart twice: first to establish the Start Date and second to establish the End Date. Once these anchor points are confirmed, the indicator will automatically load the data and generate the profile for the selected specific period.
● Strategies for Optimal Anchoring
the optimal starting and ending points for high-probability setups:
Swing Highs and Lows (Trend Analysis):
Anchor the Start Date at a major structural swing high or low and the End Date at the current price using the Extend to Present feature. This identifies the "Fair Value" for the entire price move .
Consolidation/Range Anchoring:
Set the Start Date at the first bar of a sideways range and the End Date at the breakout candle. This reveals the high-node volume clusters that will act as future support or resistance.
Session-Based Anchoring (Intraday):
Align the Start Date with the session open (e.g., London or New York open) to track institutional flow for that specific day .
Event-Driven Anchoring:
Place the Start Date on a significant news event or a Breakaway Gap identified by the script's Gap Engine. This helps determine if the new volume supports the direction of the gap.
Correction Cycles:
During a pullback, anchor the Start Date at the start of the correction to find the Value Area Low (VAL), which often serves as a tactical entry point for a trend continuation.
• Identifying Value:
Use the Value Area to gauge market consensus. Acceptance of price within the VA indicates balance. A breakout above VAH or below VAL suggests the market is searching for new value. The POC often acts as a magnet for price correction.
• Trading Breakouts:
Watch for Breakaway Gaps (Blue) that align with a move out of the Volume Profile's Value Area. This confluence increases the probability of a sustained trend.
• Spotting Reversals:
Combine Exhaustion Gaps (Red) with Liquidity Strain Signals (SE/BE) . If price gaps up into a low-volume node on the profile and prints a "Buyer Exhaustion" signal, it suggests the move is unsupported by liquidity and liable to reverse.
• Support and Resistance:
The extended dotted lines from the Smart Gap boxes act as dynamic support/resistance. A retest of a "Runaway Gap" is often a viable entry point for trend continuation.
⚙️ Inputs and Settings
• Global Profile:
Start/End Date: Define the exact window for the volume profile calculation.
Extend to Present: If checked, the profile updates with live data beyond the end date.
• Profile Settings:
Number of Rows: Determines the vertical resolution (granularity) of the histogram.
Value Area %: Default is 70%, representing one standard deviation of volume distribution.
Placement: Position the profile on the Left or Right of the defined range.
• Liquidity & Gaps:
Unusual Threshold: Multiplier of average volume to highlight institutional bars (default 2.0x).
Structure Lookback: Adjusts the sensitivity of pivot detection for gap classification.
Stress Threshold (Sigma): The Z-Score limit for triggering Liquidity Strain signals (default 2.0).
🔍 Deconstruction of the Underlying Scientific and Academic Framework
• Auction Market Theory (AMT):
The script is grounded in AMT, which posits that the market's primary function is to facilitate trade. The Volume Profile visualizes this by displaying a bell curve of price distribution. The Value Area (typically 70%) corresponds to the First Standard Deviation in a normal Gaussian distribution, representing the area of "Fair Value" where buyers and sellers agree.
• Market Microstructure & Kyle’s Lambda:
The Liquidity Strain module draws conceptually from Kyle’s Lambda, a metric in market microstructure that measures market depth and price impact (Illiquidity). By calculating the ratio of price change (True Range) to Volume, the script approximates the "cost" of moving the market.
• Statistical Z-Score Normalization:
To make the liquidity data actionable, the script applies Z-Score normalization: Z = (X - μ) / σ . This converts raw illiquidity values into standard deviations from the mean. A Z-Score above +2.0 signifies a statistically significant anomaly—an outlier event where price moved excessively relative to the volume traded, often preceding a mean-reversion event.
⚠️ Disclaimer
All provided scripts and indicators are strictly for educational exploration and must not be interpreted as financial advice or a recommendation to execute trades. I expressly disclaim all liability for any financial losses or damages that may result, directly or indirectly, from the reliance on or application of these tools. Market participation carries inherent risk where past performance never guarantees future returns, leaving all investment decisions and due diligence solely at your own discretion.

eBacktesting - Learning: Liquidity GrabseBacktesting - Learning: Liquidity Grabs highlights moments when price pushes just beyond a recent swing high or swing low (where many stops tend to sit) and then quickly returns back inside the level. This behavior is often called a stop run, sweep, or liquidity grab.
Traders study these events because they can reveal:
- Where liquidity is “resting” (obvious highs/lows)
- A quick sweep and rejection (often a wick)
- When a breakout attempt is actually a trap
- A full candle close through the level, followed by an immediate reversal back inside (classic breakout trap)
- Potential areas where price may reverse or accelerate after stops are taken
Use it as a training tool to build pattern recognition and improve your patience around key levels, especially during active sessions where sweeps happen frequently.
These indicators are built to pair perfectly with the eBacktesting extension, where traders can practice these concepts step-by-step. Backtesting concepts visually like this is one of the fastest ways to learn, build confidence, and improve trading performance.
Educational use only. Not financial advice.

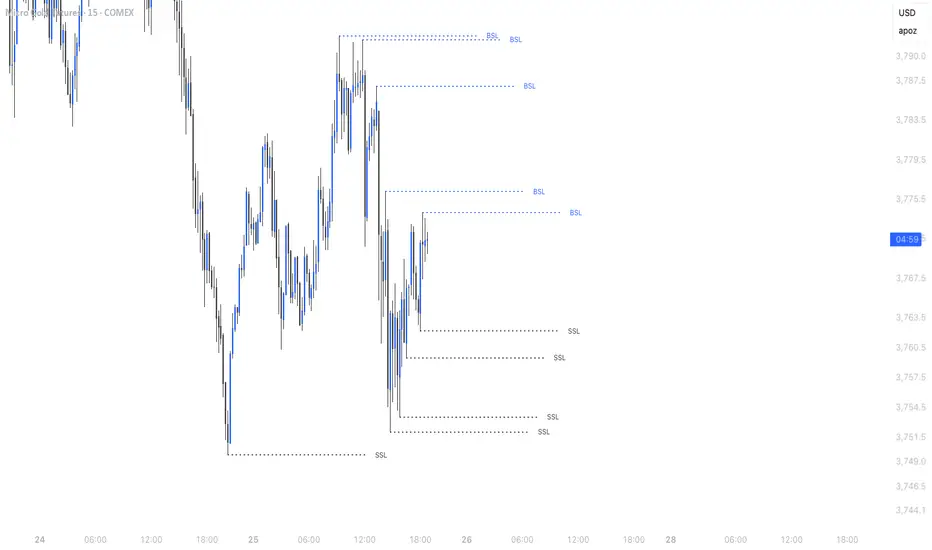
Liquidity Sweeps [Kodexius]Liquidity Sweeps is a price action indicator built to visualize and react to common “stop run” behavior around recent swing highs and swing lows. It continuously detects pivot-based liquidity levels (recent resistance and support), extends them forward in time, and then classifies the interaction when price probes beyond a level but fails to hold through it.
The script focuses on two outcomes:
Buy-Side Liquidity Sweep (BSL): price takes liquidity above a recent swing high (high breaks above the level) but closes back at or below the level.
Sell-Side Liquidity Sweep (SSL): price takes liquidity below a recent swing low (low breaks below the level) but closes back at or above the level.
To support real trading workflows, it keeps charts readable by limiting active levels, offers clean styling options, and optionally filters sweep signals using relative volume (RVOL) so you can require participation before a sweep is considered valid.
🔹 Features
🔸 Pivot-Based Liquidity Level Detection (Swing Highs and Swing Lows)
The indicator uses a user-defined Pivot Length to identify confirmed swing points:
Pivot Highs become resistance liquidity levels (buy-side liquidity above highs).
Pivot Lows become support liquidity levels (sell-side liquidity below lows).
Each detected level is drawn as a horizontal line and automatically extended to the current bar until it is swept or broken.
🔸 Automatic Level Management (De-Cluttering)
To prevent chart overload, the script stores levels in internal arrays and enforces Maximum Active Levels:
When new levels are added and the limit is exceeded, the oldest level is removed.
This keeps only the most relevant, recent liquidity zones visible.
🔸 Clear Sweep Classification (BSL and SSL)
The sweep logic is intentionally strict and practical:
- BSL Sweep triggers when the bar’s high is above resistance but the close is back below or at resistance.
- SSL Sweep triggers when the bar’s low is below support but the close is back above or at support.
This models the “probe and reject” behavior typical of liquidity grabs.
🔸 Optional Volume Confirmation Using RVOL
When Enable Volume Filter is turned on, sweeps are only valid if the current bar’s volume is strong relative to the last 20 bars:
The script computes a 20-period volume average.
You can require volume to exceed the average by a chosen Volume Multiplier (example: 1.5 means 150% of the average).
If the filter is disabled, sweeps are evaluated purely on price conditions.
🔸 Sweep Labels and Level Highlighting
On a valid sweep:
A label is printed on the sweep bar:
- ▼ BSL for buy-side liquidity sweeps (yellow)
- ▲ SSL for sell-side liquidity sweeps (blue)
The swept level is highlighted by drawing an additional colored line over the swept range.
The script also prints the bar’s RVOL percentage near the midpoint of the swept line segment:
- BSL volume text is placed above the line midpoint
- SSL volume text is placed below the line midpoint
This makes it easy to see whether a sweep was low-effort or supported by strong participation.
🔸 Styling Controls
You can fully tailor the visual output:
Resistance and support line colors
Line style selection: Solid, Dotted, Dashed
Toggle sweep labels on or off
🔸 Alerts
The indicator exposes alert conditions for both sweep types and also fires explicit alert messages once per bar close when a sweep is confirmed:
- Buy Liquidity Sweep (BSL)
- Sell Liquidity Sweep (SSL)
🔹 Calculations
1) Pivot High / Pivot Low Detection
float ph = ta.pivothigh(high, pivotPeriodInput, pivotPeriodInput)
float pl = ta.pivotlow(low, pivotPeriodInput, pivotPeriodInput)
Interpretation:
A pivot is only confirmed after pivotPeriodInput bars have passed.
Once confirmed, the level is anchored at the pivot bar and then extended forward.
2) Creating and Storing Liquidity Levels
New Resistance (Pivot High):
if not na(ph)
line newL = line.new(bar_index , ph, bar_index, ph,
color = resistanceColorInput, width = 1, style = getLineStyle(lineStyleInput))
resistanceLevels.push(LiquidityLevel.new(ph, bar_index , newL))
if resistanceLevels.size() > maxLinesInput
(resistanceLevels.shift()).delete()
New Support (Pivot Low):
if not na(pl)
line newL = line.new(bar_index , pl, bar_index, pl,
color = supportColorInput, width = 1, style = getLineStyle(lineStyleInput))
supportLevels.push(LiquidityLevel.new(pl, bar_index , newL))
if supportLevels.size() > maxLinesInput
(supportLevels.shift()).delete()
This enforces the “Maximum Active Levels” limit by deleting the oldest stored level when the cap is exceeded.
3) Relative Volume (RVOL) and Volume Filter
float volAvg = ta.sma(volume, 20)
float volRelative = (volume / volAvg) * 100
bool isVolStrong = not useVolFilterInput or (volume > volAvg * volMultiplierInput)
volRelative expresses the sweep bar’s volume as a percentage of the last 20-bar average.
If the filter is enabled, a sweep is valid only when isVolStrong is true.
4) Sweep Conditions (Core Logic)
Buy-Side Liquidity Sweep (Resistance Sweep)
A resistance level is considered swept when price trades above it but closes back at or below it.
bool priceSwept = high > lvl.price and close <= lvl.price
bool broken = close > lvl.price
priceSwept captures the “probe and reject” behavior.
broken invalidates the level if price closes above it.
The confirmation and cleanup flow:
if priceSwept and isVolStrong
buySweepOccurred := true
if showLabelsInput
label.new(bar_index, high, "▼ BSL",
style = label.style_label_down, color = #00000000,
textcolor = C_SWEEP_BUY, size = size.small)
line.new(lvl.startBar, lvl.price, bar_index, lvl.price, color = C_SWEEP_BUY, width = 1)
int midX = math.round((lvl.startBar + bar_index) / 2)
label.new(midX, lvl.price, str.tostring(volRelative, "#") + "% VOL",
color = #00000000, textcolor = color.new(C_SWEEP_BUY, 20),
style = label.style_label_down, size = size.tiny)
resistanceLevels.remove(i).delete()
else if broken
resistanceLevels.remove(i).delete()
Sell-Side Liquidity Sweep (Support Sweep)
A support level is considered swept when price trades below it but closes back at or above it.
bool priceSwept = low < lvl.price and close >= lvl.price
bool broken = close < lvl.price
The confirmation and cleanup flow:
if priceSwept and isVolStrong
sellSweepOccurred := true
if showLabelsInput
label.new(bar_index, low, "▲ SSL",
style = label.style_label_up, color = #00000000,
textcolor = C_SWEEP_SELL, size = size.small)
line.new(lvl.startBar, lvl.price, bar_index, lvl.price, color = C_SWEEP_SELL, width = 1)
int midX = math.round((lvl.startBar + bar_index) / 2)
label.new(midX, lvl.price, str.tostring(volRelative, "#") + "% VOL",
color = #00000000, textcolor = color.new(C_SWEEP_SELL, 20),
style = label.style_label_up, size = size.tiny)
supportLevels.remove(i).delete()
else if broken
supportLevels.remove(i).delete()
5) Level Extension to Current Bar
method update(LiquidityLevel this) =>
line.set_x2(this.lineObj, bar_index)
This keeps each active liquidity level extended to the current candle until it is swept or decisively broken.
6) Alerts
alertcondition(buySweepOccurred, "Buy Liquidity Sweep", "BSL Swept!")
alertcondition(sellSweepOccurred, "Sell Liquidity Sweep", "SSL Swept!")
if buySweepOccurred
alert("Kodexius BSL Sweep: " + str.tostring(close), alert.freq_once_per_bar_close)
if sellSweepOccurred
alert("Kodexius SSL Sweep: " + str.tostring(close), alert.freq_once_per_bar_close)

Quasimodo (QML) Pattern [Kodexius]Quasimodo (QML) Pattern is a market structure indicator that automatically detects Bullish and Bearish Quasimodo formations using confirmed swing pivots, then visualizes the full structure directly on the chart. The script focuses on the classic liquidity-grab narrative of the QML: a sweep beyond a prior swing (the Head) followed by a decisive market structure break (MSB), leaving behind a clearly defined reaction zone between the Left Shoulder and the Head.
Detection is built on pivot highs and lows, so patterns are evaluated only after swing points are validated. Once a valid 4 pivot sequence is identified, the indicator draws the pattern legs, highlights the internal triangle area to emphasize the grab, marks the MSB leg, and projects a QML zone that can be used as a potential area of interest for retests.
This tool is designed for traders who work with structure, liquidity concepts, and reversal/continuation triggers, and who want a clean, repeatable QML visualization without manually marking swings.
🔹 Features
🔸 Confirmed Pivot Based Structure Mapping
The script uses classic built-in pivot logic to detect swing highs and swing lows.
🔸 Automatic Bullish and Bearish QML Detection
The indicator evaluates the most recent 4 pivots and checks for a valid alternating sequence (High-Low-High-Low or Low-High-Low-High). When the sequence matches QML requirements, the script classifies the setup as bullish or bearish:
Bullish logic (structure reversal up):
- Left Shoulder is a pivot Low
- Head is a lower Low than the Left Shoulder (liquidity sweep)
- MSB pivot exceeds the Reaction pivot
Bearish logic (structure reversal down):
- Left Shoulder is a pivot High
- Head is a higher High than the Left Shoulder (liquidity sweep)
- MSB pivot breaks below the Reaction pivot
🔸 Full Pattern Visualization (Legs + Highlighted Core)
When a pattern triggers, the script draws:
Three main legs: Left Shoulder to Reaction, Reaction to Head, Head to MSB
A shaded triangular highlight over the internal structure to make the liquidity-grab shape easy to spot at a glance
🔸 QML Zone Projection
A QML Zone box is drawn using the price range defined between the Left Shoulder and the Head, then extended to the right to remain visible as price develops. This zone is intended to act as a practical reference area for potential retests and reaction planning after MSB confirmation.
🔸 MSB Emphasis
A dotted MSB line is drawn between the Reaction point and the MSB point to visually emphasize the confirmation leg that completes the pattern logic.
🔸 Clean Point Tagging and Directional Labeling
Key points are labeled directly on the chart:
- “LS” at the Left Shoulder
- “Head” at the sweep pivot
- “MSB” at the break pivot
A directional label (“Bullish QML” or “Bearish QML”) is also printed to quickly identify the detected bias.
🔸 Configurable Visual Style
All main visual components are user configurable:
- Bullish and bearish colors
- Line width
- Label size
🔸 Efficient Update Logic
Pattern checks are only performed when a new pivot is confirmed, avoiding unnecessary repeated calculations on every bar. The most recent pattern’s projected elements (zone and label positioning) are updated as new bars print to keep the latest setup readable.
🔹 Calculations
This section summarizes the core logic used for detection and plotting.
1. Pivot Detection (Swing Highs and Lows)
The script relies on confirmed pivots using the user inputs:
Left Bars: how many bars must exist to the left of the pivot
Right Bars: how many bars must exist to the right to confirm it
float ph = ta.pivothigh(leftLen, rightLen)
float pl = ta.pivotlow(leftLen, rightLen)
When a pivot is confirmed, its true bar index is the pivot bar, not the current bar, so the script stores:
bar_index
2. Pivot Storage and History Window
Each pivot is stored as a structured object containing:
- price
- index
- isHigh (true for pivot high, false for pivot low)
A rolling history is maintained (up to 50 pivots) to keep processing stable and memory usage controlled.
3. Sequence Validation (Alternation Check)
The pattern evaluation always uses the latest 4 pivots:
p0: Left Shoulder candidate
p1: Reaction candidate
p2: Head candidate
p3: MSB candidate
Before checking bullish/bearish rules, the script enforces alternating pivot types:
bool correctSequence =
(p0.isHigh != p1.isHigh) and
(p1.isHigh != p2.isHigh) and
(p2.isHigh != p3.isHigh)
This prevents invalid structures like consecutive highs or consecutive lows from being interpreted as QML.
4. Bullish QML Conditions
A bullish QML is evaluated when the Left Shoulder is a Low:
Head must be lower than Left Shoulder (sweep)
MSB must be higher than Reaction (break)
if not p0.isHigh
if p2.price < p0.price and p3.price > p1.price
// Bullish QML confirmed
Interpretation:
p2 < p0 represents the liquidity grab below the prior swing low
p3 > p1 represents the market structure break above the reaction high
5. Bearish QML Conditions
A bearish QML is evaluated when the Left Shoulder is a High:
Head must be higher than Left Shoulder (sweep)
MSB must be lower than Reaction (break)
if p0.isHigh
if p2.price > p0.price and p3.price < p1.price
// Bearish QML confirmed
Interpretation:
p2 > p0 represents the liquidity grab above the prior swing high
p3 < p1 represents the market structure break below the reaction low
6. Drawing Logic (Structure, Highlight, Zone, Labels)
When confirmed, the script draws:
Three connecting legs (LS to Reaction, Reaction to Head, Head to MSB)
A shaded triangle using a transparent “ghost” line to enable filling
A dotted MSB emphasis line between Reaction and MSB
A QML Zone box spanning the LS to Head price range and projecting to the right
Point labels: LS, Head, MSB
A direction label: “Bullish QML” or “Bearish QML”
7. Latest Pattern Extension
To keep the newest setup readable, the script updates the most recently detected pattern by extending its projected elements as new bars print:
QML zone right edge is pushed forward
The main label x position is pushed forward
This keeps the last identified QML zone visible as price evolves, without having to redraw historical patterns on every bar.

FOMC Sweep Reaction AP Capital – FOMC Sweep Reaction v1.0
AP Capital – FOMC Sweep Reaction v1.0 is a news-reaction and liquidity-based trading tool designed specifically to track and trade FOMC volatility on Gold (XAUUSD) and other highly reactive instruments.
The indicator focuses on liquidity sweeps, structure breaks, and EMA reclaims that commonly occur around Federal Reserve interest-rate decisions and Powell speeches, helping traders identify high-probability reversal or continuation moves after the initial spike.
🔍 What This Indicator Detects
This tool highlights the most repeatable FOMC behaviours observed across multiple months of broker data:
• Sweeps of previous day’s high or low
• Stop-hunt wicks into liquidity pools
• EMA13 reclaim after the news spike
• Break and close beyond short-term structure
• Momentum shift following volatility exhaustion
The goal is not to predict the news, but to react to confirmed price behaviour after liquidity has been taken.
📌 Core Features
• FOMC Sweep Detection
Identifies aggressive wicks into prior highs/lows during news volatility
• EMA Reclaim Confirmation
Uses EMA13 to validate momentum shift after the sweep
• Market Structure Awareness
Filters reactions that fail to break structure to avoid false reversals
• Session-Aligned Logic
Designed around London → NY → FOMC release timing
• Clean Visuals
Minimal chart clutter for fast decision-making during volatile conditions
🧠 How to Use
Wait for FOMC release / Powell speech
Allow price to sweep previous liquidity (PDH / PDL / local extremes)
Observe reclaim of EMA13
Enter only after structure confirmation
Manage trade using EMA trailing or structure-based exits
⚠️ This is a reaction system, not a prediction tool.
📊 Best Use Cases
• XAUUSD (Gold)
• NASDAQ / US indices
• High-impact macro news events
• 5-min to 15-min timeframes
⚠️ Important Notes
• News volatility is extreme — risk management is essential
• Not designed for low-volatility or ranging markets
• Best combined with a clear trading plan and strict risk rules
📎 Disclaimer
This indicator is for educational purposes only and does not constitute financial advice. Trading during high-impact news events involves significant risk.

Liquidity + Order-Flow Exhaustion (Smart-Money Logic)Liquidity + Order-Flow Exhaustion (Smart-Money Logic) is a visual tool that helps traders recognize where big market participants (“smart money”) are likely accumulating or distributing positions.
It identifies liquidity sweeps (stop-hunts above or below previous swing levels) and market structure shifts (reversals confirmed by price closing back in the opposite direction).
In simple terms, it shows where price “tricks” retail traders into chasing breakouts — right before reversing.
How it works:
The script scans recent highs and lows to find when price breaks them and quickly rejects — a sign of stop-hunts or liquidity grabs.
It then checks for a close back inside the previous range to confirm a possible Market Structure Shift (MSS).
When this happens, the chart highlights the zone and optionally adds directional labels (🔹 or 🔸) to mark where the liquidity event occurred.
How to read the signals:
🟢 Bullish shift — Price takes out a previous low, then closes higher. This often marks the end of a short-term down-move.
🔴 Bearish shift — Price sweeps a previous high, then closes lower. This often marks the end of a short-term rally.
Colored backgrounds and labels help visualize these key reversals directly on the chart.
How to use it:
Apply to any timeframe; 15-minute to 4-hour charts work best.
Use it to confirm reversals near major swing points or liquidity zones.
Combine with volume spikes, displacement candles, or Fair-Value Gaps (FVGs) for stronger confirmation.
What makes it original:
Simple, self-contained logic inspired by Smart Money Concepts (SMC).
Automatically detects both liquidity sweeps and the subsequent structural shift.
Visual and alert-ready design — perfect for discretionary or algorithmic strategies.
Tip: For even better accuracy, align detected shifts with higher-timeframe bias or VWAP deviations.

Quantura - Liquidity Sweep & Run LevelsIntroduction
“Quantura – Liquidity Sweep & Run Levels” is a structural price-action indicator designed to automatically detect swing-based liquidity zones and visualize potential sweep and run events. It helps traders identify areas where liquidity has likely been taken (sweep) or released (run), improving precision in market structure analysis and timing of entries or exits.
Originality & Value
This tool translates institutional liquidity concepts into an automated visual framework. Instead of simply marking highs and lows, it dynamically monitors swing points, tracks their breaches, and identifies subsequent reactions. The indicator is built to highlight the liquidity dynamics that often precede reversals or continuations.
Its originality lies in:
Automatic identification and tracking of swing highs and lows.
Real-time detection of broken levels and liquidity sweeps.
Distinction between “Run” and “Sweep” modes for different market behaviors.
Persistent historical visualization of liquidity levels using clean line structures.
Configurable signal markers for bullish and bearish sweep confirmations.
Functionality & Core Logic
Detects swing highs and lows using a user-defined Swing Length parameter.
Stores and updates all swing levels dynamically with arrays for efficient memory handling.
Draws horizontal lines from each detected swing point to visualize potential liquidity zones.
Monitors when price breaks a swing level and marks that event as “broken.”
Generates signals when the market either sweeps above/below or runs away from those levels, depending on the chosen mode.
Provides optional visual signal markers (“▲” for bullish sweeps, “▼” for bearish sweeps).
Parameters & Customization
Mode: Choose between “Sweep” (detects liquidity grabs) or “Run” (detects breakout continuations).
Swing Length: Sets the sensitivity for detecting swing highs/lows. A higher value focuses on larger structures, while smaller values detect micro liquidity points.
Bullish Color / Bearish Color: Customize color themes for sweep/run lines and signal markers.
Signals: Enables or disables visual up/down markers for confirmed events.
Visualization & Display
Horizontal lines represent potential liquidity levels (unbroken swing highs/lows).
Once broken, lines automatically stop extending, marking the moment liquidity is taken.
Depending on the selected mode:
“Sweep” mode identifies false breaks or stop-hunt behavior.
“Run” mode highlights breakouts that continue the trend.
Colored arrows indicate the direction and type of liquidity reaction.
Clean, non-intrusive visualization suitable for overlaying on price charts.
Use Cases
Detect liquidity sweeps before major reversals.
Identify breakout continuations after liquidity runs.
Combine with Supply/Demand or FVG indicators for multi-layered confirmation.
Validate liquidity bias in algorithmic or discretionary strategies.
Analyze market manipulation patterns and institutional stop-hunting behavior.
Limitations & Recommendations
This indicator identifies structural behavior but does not guarantee trade direction or profitability.
Works best on liquid markets with clear swing structures (e.g., crypto, forex, indices).
Signal interpretation should be combined with confluence tools such as volume, order flow, or structure-based filters.
Excessively small swing settings may cause over-signaling in volatile markets.
Markets & Timeframes
Optimized for all major asset classes — including crypto, Forex, indices, and equities — and for intraday to higher-timeframe structural analysis (5-minute up to daily charts).
Author & Access
Developed 100% by Quantura. Published as a Open-source script indicator. Access is free.
Compliance Note
This description fully complies with TradingView’s Script Publishing Rules and House Rules . It avoids performance claims, provides transparency on methodology, and clearly describes indicator behavior and limitations.

Previous Period High/Low LevelsThis indicator plots the previous day, week, and month high and low levels to highlight key liquidity levels.
Perfect for traders using market structure, liquidity, or SMC concepts.
Features:
Auto-plots PDH/PDL, PWH/PWL, and PMH/PML
Adjustable line styles, widths, and label sizes
Toggle price display on or off
Accurate UTC offset handling

Timeframe LiquidityTimeframe Liquidity – Multi-Timeframe Highs & Lows by
Timeframe Liquidity automatically plots previous day, week, month, and year highs and lows, key liquidity zones used by smart money and price-action traders. These levels extend into the future and can automatically stop once price wicks through, showing clear liquidity sweeps and tested zones.
Perfect for traders using ICT / SMC concepts, liquidity theory, or market structure analysis. Instantly see where liquidity rests, where it’s been taken, and how price reacts at major support and resistance.
Features:
Auto-plots PDH/PDL, PWH/PWL, PMH/PML, PYH/PYL
Custom line styles, colors, and label sizes
Option to stop line on wick (liquidity sweep)
Smart timeframe visibility (hides same-TF levels)
Accurate UTC offset handling
Identify liquidity pools fast, trade cleaner charts, and track where smart money hunts liquidity.
Built for precision, clarity, and confluence.

ICT Anchored Market Structures with Validation [LuxAlgo]The ICT Anchored Market Structures with Validation indicator is an advanced iteration of the original Pure-Price-Action-Structures tool, designed for price action traders.
It systematically tracks and validates key price action structures, distinguishing between true structural shifts/breaks and short-term sweeps to enhance trend and reversal analysis. The indicator automatically highlights structural points, confirms breakouts, identifies sweeps, and provides clear visual cues for short-term, intermediate-term, and long-term market structures.
A distinctive feature of this indicator is its exclusive reliance on price patterns. It does not depend on any user-defined input, ensuring that its analysis remains robust, objective, and uninfluenced by user bias, making it an effective tool for understanding market dynamics.
🔶 USAGE
Market structure is a cornerstone of price action analysis. This script automatically detects real-time market structures across short-term, intermediate-term, and long-term levels, simplifying trend analysis for traders. It assists in identifying both trend reversals and continuations with greater clarity.
Market structure shifts and breaks help traders identify changes in trend direction. A shift signals a potential reversal, often occurring when a swing high or low is breached, suggesting a transition in trend. A break, on the other hand, confirms the continuation of an established trend, reinforcing the current direction. Recognizing these shifts and breaks allows traders to anticipate price movement with greater accuracy.
It’s important to note that while a CHoCH may signal a potential trend reversal and a BoS suggests a continuation of the prevailing trend, neither guarantees a complete reversal or continuation. In some cases, CHoCH and BoS levels may act as liquidity zones or areas of consolidation rather than indicating a clear shift or continuation in market direction. The indicator’s validation component helps confirm whether the detected CHoCH and BoS are true breakouts or merely liquidity sweeps.
🔶 DETAILS
🔹 Market Structures
Market structures are derived from price action analysis, focusing on identifying key levels and patterns in the market. Swing point detection, a fundamental concept in ICT trading methodologies and teachings, plays a central role in this approach.
Swing points are automatically identified based exclusively on market movements, without requiring any user-defined input.
🔹 Utilizing Swing Points
Swing points are not identified in real-time as they form. Short-term swing points may appear with a delay of up to one bar, while the identification of intermediate and long-term swing points is entirely dependent on subsequent market movements. Importantly, this detection process is not influenced by any user-defined input, relying solely on pure price action. As a result, swing points are generally not intended for real-time trading scenarios.
Instead, traders often analyze historical swing points to understand market trends and identify potential entry and exit opportunities. By examining swing highs and lows, traders can:
Recognize Trends: Swing highs and lows provide insight into trend direction. Higher swing highs and higher swing lows signify an uptrend, while lower swing highs and lower swing lows indicate a downtrend.
Identify Support and Resistance Levels: Swing highs often act as resistance levels, referred to as Buyside Liquidity Levels in ICT terminology, while swing lows function as support levels, also known as Sellside Liquidity Levels. Traders can leverage these levels to plan their trade entries and exits.
Spot Reversal Patterns: Swing points can form key reversal patterns, such as double tops or bottoms, head and shoulders, and triangles. Recognizing these patterns can indicate potential trend reversals, enabling traders to adjust their strategies effectively.
Set Stop Loss and Take Profit Levels: In ICT teachings, swing levels represent price points with expected clusters of buy or sell orders. Traders can target these liquidity levels/pools for position accumulation or distribution, using swing points to define stop loss and take profit levels in their trades.
Overall, swing points provide valuable information about market dynamics and can assist traders in making more informed trading decisions.
🔹 Logic of Validation
The validation process in this script determines whether a detected market structure shift or break represents a confirmed breakout or a sweep.
The breakout is confirmed when the close price is significantly outside the deviation range of the last detected structural price. This deviation range is defined by the 17-period Average True Range (ATR), which creates a buffer around the detected market structure shift or break.
A sweep occurs when the price breaches the structural level within the deviation range but does not confirm a breakout. In this case, the label is updated to 'SWEEP.'
A visual box is created to represent the price range where the breakout or sweep occurs. If the validation process continues, the box is updated. This box visually highlights the price range involved in a sweep, helping traders identify liquidity events on the chart.
🔶 SETTINGS
The settings for Short-Term, Intermediate-Term, and Long-Term Structures are organized into groups, allowing users to customize swing points, market structures, and visual styles for each.
🔹 Structures
Swings and Size: Enables or disables the display of swing highs and lows, assigns icons to represent the structures, and adjusts the size of the icons.
Market Structures: Toggles the visibility of market structure lines.
Market Structure Validation: Enable or disable validation to distinguish true breakouts from liquidity sweeps.
Market Structure Labels: Displays or hides labels indicating the type of market structure.
Line Style and Width: Allows customization of the style and width of the lines representing market structures.
Swing and Line Colors: Provides options to adjust the colors of swing icons, market structure lines, and labels for better visualization.
🔶 RELATED SCRIPTS
Pure-Price-Action-Structures.
Market-Structures-(Intrabar).

Simple Liquidity Sweep [rare_gold_steak]- Shows when the liquidity was swept.
- Shows BSL and SSL.
- Simple options to change styling.
I use it personally and some people liked it so I thought i'll share it with the public.
Apex Edge – Wolfe Wave HunterApex Edge – Wolfe Wave Hunter
The modern Wolfe Wave, rebuilt for the algo era
This isn’t just another Wolfe Wave indicator. Classic Wolfe detection is rigid, outdated, and rarely tradable. Apex Edge – Wolfe Wave Hunter re-engineers the pattern into a modern, SMC-driven model that adapts to today’s liquidity-dominated markets. It’s not about drawing pretty shapes – it’s about extracting precision entries with asymmetric risk-to-reward potential.
🔎 What it does
Automatic Wolfe Wave Detection
Identifies bullish and bearish Wolfe Wave structures using pivot-based logic, symmetry filters, and slope tolerances.
Channel Glow Zones
Highlights the Wolfe channel and projects it forward into the future (bars are user-defined). This allows you to see the full potential of the trade before price even begins its move.
Stop Loss (SL) & Entry Arrow
At the completion of Wave 5, the algo prints a Stop Loss line and a tiny entry arrow (green for bullish, red for bearish). but the colours can be changed in user settings. This is the “execution point” — where the Wolfe setup becomes tradable.
Target Projection Lines
TP1 (EPA): Derived from the traditional 1–4 line projection.
TP2 (1.272 Fib): Optional secondary profit target.
TP3 (1.618 Fib): Optional extended target for large runners.
All TP lines extend into the future, so you can track them as price evolves.
Volume Confirmation (optional)
A relative volume filter ensures Wave 5 is formed with meaningful market participation before a setup is confirmed.
Alerts (ready out of the box)
Custom alerts can be fired whenever a bullish or bearish Wolfe Wave is confirmed. No need to babysit the charts — let the script notify you.
⚙️ Customisation & User Control
Every trader’s market and style is different. That’s why Wolfe Wave Hunter is fully customisable:
Arrow Colours & Size
Works on both light and dark charts. Choose your own bullish/bearish entry arrow colours for maximum visibility.
Tolerance Levels
Adjust symmetry and slope tolerance to refine how strict the channel rules are.
Tighter settings = fewer but cleaner zones.
Looser settings = more frequent setups, but with slightly lower structural quality.
Channel Glow Projection
Define how many bars forward the channel is drawn. This controls how far into the future your Wolfe zones are extended.
Stop Loss Line Length
Keep the SL visible without it extending infinitely across your chart.
Take Profit Line Colors
Each TP projection can be styled to your preference, allowing you to clearly separate TP1, TP2, and TP3.
This isn’t a one-size-fits-all tool. You can shape Wolfe detection logic to match the pairs, timeframes, and market conditions you trade most.
🚀 Why it’s different
Classic Wolfe waves are rare — this script adapts the model into something practical and tradeable in modern markets.
Liquidity-aligned — many setups align with structural sweeps of Wave 3 liquidity before driving into profit.
Entry built-in — most Wolfe scripts only draw the structure. Wolfe Wave Hunter gives you a precise entry point, SL, and projected TPs.
Backtest-friendly — you’ll quickly discover which assets respect Wolfe waves and which don’t, creating your own high-probability Wolfe watchlist.
⚠️ Limitations & Disclaimer
Not all markets respect Wolfe Waves. Some FX pairs, metals, and indices respect the structure beautifully; others do not. Backtest and create your own shortlist.
No guaranteed sweeps. Many entries occur after a liquidity sweep of Wave 3, but not all. The algo is designed to detect Wolfe completion, not enforce textbook liquidity rules.
Probabilistic, not predictive. Wolfe setups don’t win every time. Always use risk management.
High-RR focus. This is not a high-frequency tool. It’s designed for precision, asymmetric setups where risk is small and reward potential is large.
✅ The Bottom Line
Apex Edge – Wolfe Wave Hunter is a modern reimagination of the Wolfe Wave. It blends structural geometry, liquidity dynamics, and algo-driven execution into a single tool that:
Detects the pattern automatically
Provides SL, entry, and TP levels
Offers alerts for hands-off trading
Allows deep customisation for different markets
When it hits, it delivers outstanding risk-to-reward. Backtest, refine your tolerances, and build your watchlist of assets where Wolfe structures consistently pay.
This isn’t just Wolfe detection — it’s Wolfe trading, rebuilt for the modern trader.
Developer Notes - As always with the Apex Edge Brand, user feedback and recommendations will always be respected. Simply drop us a message with your comments and we will endeavour to address your needs in future version updates.

B A N K $ - Breaks & SweepsThis indicator automatically maps on Breaks of Structure & Liquidity Sweeps. It works by calculating pivot points based on how many candles are above/below either side of a pivot.
The user can manually set how many candles need to be above/below either side of a pivot if they would prefer to change it.
The indicator will dynamically adjust the lines as the user changes timeframe to allow for seamless analysis.
Features
Break of Structure lines
Liquidity Sweep lines
Dealing Range - this allows the user to visualise the current dealing range
Explanation
A sweep is determined by whether a candle closes through a pivot point with a body closure or not. If the candle wicks this level but fails to close through it, the line will turn red to indicate a liquidity sweep.
If the following 3 candles go on to close through the break line, this will then update it from a red sweep line to the normal break line again. (sometimes the initial candle that touches a level will not close through it but price will continue to break that level in the next few candles).

Volume Spikes + Daily VWAP SD BandsVolume Spikes + Daily VWAP SD Bands
This indicator combines volume spike detection to help traders identify potential absorption zones with daily VWAP and standard deviation bands , key price levels, continuation opportunities, and possible institutional bias.
Features:
Volume Spike Detection
Highlights candles with unusually high volume relative to a configurable SMA.
Optional filters:
Local highs/lows only (Only Use Valid Highs & Lows)
Candle shapes: Hammer / Shooter only
Candle color match: bullish spikes on green, bearish on red
Plots small circles above/below bars for bullish and bearish volume spikes.
Alerts available for both bullish and bearish spikes.
Interpretation: Volume spikes at local highs/lows can indicate absorption, where one side absorbs aggressive buying/selling pressure.
Daily VWAP
Calculates volume-weighted average price (VWAP) for the current day.
Optionally shows previous day’s VWAP for reference.
Plot lines are customizable with optional circles on lines for visual clarity.
Labels on the last bar show exact VWAP values.
Institutional Bias Insight: Price above both current and previous VWAPs may indicate bullish positioning; price below both VWAPs may indicate bearish positioning. Many professional traders consider this a clue to institutional bias, but it’s not guaranteed. Always confirm with volume, delta, or orderflow analysis.
Standard Deviation Bands
Optional x1 and x2 SD bands around the daily VWAP.
Visual fill between bands shows price volatility zones.
Can be used to identify potential support/resistance or absorption zones.
Use Case: Price bounces off first SD band may indicate continuation signals, especially when volume spikes occur at those levels.
Customizable Visuals
Colors for bullish and bearish volume spikes
VWAP and SD band colors and thickness
Optional circles and filled bands for better readability
Alerts
Bullish / Bearish Volume Spikes
Supports TradingView alert system for automated notifications
Advanced Use Cases:
Combine with Cumulative Delta or Orderflow tools to confirm true absorption zones.
Identify high-volume rejection candles signaling possible trend continuation.
Use VWAP positioning relative to price to assess potential institutional bias, keeping in mind it is probabilistic, not guaranteed.
Visualize intraday VWAP levels and volatility with SD bands for better trade timing.
Settings: Fully customizable, including volume multiplier, SMA length, session filter, candle shape, color options, and VWAP/SD display preferences.

Lumiere’s Indicator BundleThe Lumiere’s Indicator Bundle combines three of Lumiere’s most used tools into one script:
🔹 BOS Mark-out – Marks Breaks of Structure with clear bullish/bearish levels and optional alerts.
🔹 Liquidity Mark-ou t – Draws significant swing highs/lows and automatically removes them once swept.
🔹 Trading Session High/Low – Tracks Asia, London, and New York session ranges with customizable timezone.
Why this bundle?
I made this bundle so everyone can run all my indicators at once without having to pick and choose between them or worry about chart space limits.
Instead of loading 3 separate indicators, this package gives you everything in one place. You can toggle each module (BOS, Liquidity, Sessions) on or off from the settings. All inputs are kept clean and organized in their own sections for easy adjustments.
What to expect
BOS lines always plotted on top for maximum clarity.
Liquidity highs/lows update in real time and get removed when taken out.
Session ranges show the active session’s high/low and can mark sweeps after the session closes.
Default timezone is New York (UTC-4), but you can switch to any TradingView-supported timezone.
BOS alerts are included, so you’ll never miss a structural break.

DTLLC Time & PriceDTLLC Time and Price with Signals
This indicator is built for traders who understand ICT concepts and want a structured, visual way to align time-based price action with key market levels. By combining customizable trading windows, breakout logic, and daily reference points, it helps you identify high-probability trade opportunities while filtering out market noise.
Key Features
1. Dual Custom Time Ranges (Kill Zones)
Set two independent time ranges per day (start/end hour and minute).
Each range identifies the highest high and lowest low within its window.
Built-in breakout detection generates buy/sell signals when price moves beyond these levels.
2. Volatility Filtering
Adjustable volatility threshold based on True Range relative to ATR.
Filters out low-quality signals during choppy, low-volatility conditions.
3. ATR-Based Stop Loss
Custom ATR length and stop-loss multiplier settings.
Automatically plots ATR-based stop levels for triggered trades.
4. Daily Key Levels
Plots Previous Day High, Previous Day Low, and Midnight Open continuously on the chart.
Useful for spotting breakout and reversal opportunities in line with ICT market structure concepts.
5. Liquidity & Engulfing Candle Highlights
Highlights potential liquidity grab zones (yellow candles) when significant highs/lows are set within your lookback period.
Detects bullish (green) and bearish (red) engulfing patterns for added confluence.
6. Visual & Signal Tools
Buy/Sell signals plotted directly on chart (separate colors for Range 1 and Range 2). Continuous plotting of reference levels to maintain market context throughout the session.
Example Use Case:
A common ICT-inspired reversal setup:
Wait for price to sweep the Previous Day’s High or Low during your chosen time range.
Look for a buy or sell signal with volatility confirmation.
Manage risk using the ATR-based stop-loss plot.
Disclaimer: This script is for educational purposes only and is not financial advice. Trade responsibly and always test strategies before applying them in live markets.

Liquidity Break Probability [PhenLabs]📊 Liquidity Break Probability
Version: PineScript™ v6
The Liquidity Break Probability indicator revolutionizes how traders approach liquidity levels by providing real-time probability calculations for level breaks. This advanced indicator combines sophisticated market analysis with machine learning inspired probability models to predict the likelihood of high/low breaks before they happen.
Unlike traditional liquidity indicators that simply draw lines, LBP analyzes market structure, volume profiles, momentum, volatility, and sentiment to generate dynamic break probabilities ranging from 5% to 95%. This gives traders unprecedented insight into which levels are most likely to hold or break, enabling more confident trading decisions.
🚀 Points of Innovation
Advanced 6-factor probability model weighing market structure, volatility, volume, momentum, patterns, and sentiment
Real-time probability updates that adjust as market conditions change
Intelligent trading style presets (Scalping, Day Trading, Swing Trading) with optimized parameters
Dynamic color-coded probability labels showing break likelihood percentages
Professional tiered input system - from quick setup to expert-level customization
Smart volume filtering that only highlights levels with significant institutional interest
🔧 Core Components
Market Structure Analysis: Evaluates trend alignment, level strength, and momentum buildup using EMA crossovers and price action
Volatility Engine: Incorporates ATR expansion, Bollinger Band positioning, and price distance calculations
Volume Profile System: Analyzes current volume strength, smart money proxies, and level creation volume ratios
Momentum Calculator: Combines RSI positioning, MACD strength, and momentum divergence detection
Pattern Recognition: Identifies reversal patterns (doji, hammer, engulfing) near key levels
Sentiment Analysis: Processes fear/greed indicators and market breadth measurements
🔥 Key Features
Dynamic Probability Labels: Real-time percentage displays showing break probability with color coding (red >70%, orange >50%, white <50%)
Trading Style Optimization: One-click presets automatically configure sensitivity and parameters for your trading timeframe
Professional Dashboard: Live market state monitoring with nearest level tracking and active level counts
Smart Alert System: Customizable proximity alerts and high-probability break notifications
Advanced Level Management: Intelligent line cleanup and historical analysis options
Volume-Validated Levels: Only displays levels backed by significant volume for institutional-grade analysis
🎨 Visualization
Recent Low Lines: Red lines marking validated support levels with probability percentages
Recent High Lines: Blue lines showing resistance zones with break likelihood indicators
Probability Labels: Color-coded percentage labels that update in real-time
Professional Dashboard: Customizable panel showing market state, active levels, and current price
Clean Display Modes: Toggle between active-only view for clean charts or historical view for analysis
📖 Usage Guidelines
Quick Setup
Trading Style Preset
Default: Day Trading
Options: Scalping, Day Trading, Swing Trading, Custom
Description: Automatically optimizes all parameters for your preferred trading timeframe and style
Show Break Probability %
Default: True
Description: Displays percentage labels next to each level showing break probability
Line Display
Default: Active Only
Options: Active Only, All Levels
Description: Choose between clean active-only view or comprehensive historical analysis
Level Detection Settings
Level Sensitivity
Default: 5
Range: 1-20
Description: Lower values show more levels (sensitive), higher values show fewer levels (selective)
Volume Filter Strength
Default: 2.0
Range: 0.5-5.0
Description: Controls minimum volume threshold for level validation
Advanced Probability Model
Market Trend Influence
Default: 25%
Range: 0-50%
Description: Weight given to overall market trend in probability calculations
Volume Influence
Default: 20%
Range: 0-50%
Description: Impact of volume analysis on break probability
✅ Best Use Cases
Identifying high-probability breakout setups before they occur
Determining optimal entry and exit points near key levels
Risk management through probability-based position sizing
Confluence trading when multiple high-probability levels align
Scalping opportunities at levels with low break probability
Swing trading setups using high-probability level breaks
⚠️ Limitations
Probability calculations are estimations based on historical patterns and current market conditions
High-probability setups do not guarantee successful trades - risk management is essential
Performance may vary significantly across different market conditions and asset classes
Requires understanding of support/resistance concepts and probability-based trading
Best used in conjunction with other analysis methods and proper risk management
💡 What Makes This Unique
Probability-Based Approach: First indicator to provide quantitative break probabilities rather than simple S/R lines
Multi-Factor Analysis: Combines 6 different market factors into a comprehensive probability model
Adaptive Intelligence: Probabilities update in real-time as market conditions change
Professional Interface: Tiered input system from beginner-friendly to expert-level customization
Institutional-Grade Filtering: Volume validation ensures only significant levels are displayed
🔬 How It Works
1. Level Detection:
Identifies pivot highs and lows using configurable sensitivity settings
Validates levels with volume analysis to ensure institutional significance
2. Probability Calculation:
Analyzes 6 key market factors: structure, volatility, volume, momentum, patterns, sentiment
Applies weighted scoring system based on user-defined factor importance
Generates probability score from 5% to 95% for each level
3. Real-Time Updates:
Continuously monitors price action and market conditions
Updates probability calculations as new data becomes available
Adjusts for level touches and changing market dynamics
💡 Note: This indicator works best on timeframes from 1-minute to 4-hour charts. For optimal results, combine with proper risk management and consider multiple timeframe analysis. The probability calculations are most accurate in trending markets with normal to high volatility conditions.

Liquidity Hunter HeatmapLiquidity Hunter (GPS Companion Tool)
Liquidity Hunter is a specialized script designed to help traders visualize and track potential liquidation zones, clusters, and imbalance traps in real-time. It is particularly useful for scalpers and short-term traders who rely on liquidity sweeps, stop hunts, and reversion plays.
This tool does not replicate open-source liquidation trackers. Instead, it uses a proprietary combination of volume surges, candle displacement, VWAP deviation, and high-timeframe wicks to infer areas of trapped traders and display them with clear, color-coded markers.
Key Features:
• Real-Time Liquidation Estimates: Detects where major stop losses (and potential liquidations) may have occurred, based on proprietary volume + price action logic.
• Cluster Strength Bubbles: Visual bubbles (scaled by cluster size) show where liquidations are stacking. Purple for bearish, white for bullish — intensity reflects strength.
• Pre-Liquidation Warning Zones: Highlights areas where price is likely to sweep liquidity before reversing, helping traders avoid chasing moves.
• Dollar-Based Labels (Optional): Displays the estimated value liquidated, helping traders size the significance of a move (e.g., $8.4M).
• Minimal Clutter Mode: Designed for intraday clarity — hides excess lines and uses bubbles, not shapes, for cleaner visualization.

Candle Range Detector by TradeTech AnalysisCandle Range Detector by TradeTech Analysis
This advanced indicator identifies and visualizes price compression zones based on inside bar formations, then tracks how price behaves around those zones — offering valuable insights into liquidity sweeps, range expansions, and trap/mitigation behavior.
The script builds upon the foundational concept of range-based price action, commonly used by institutional traders, and adds automation, mitigation tracking, and sweep detection to map how price reacts around these critical ranges.
🔍 How It Works:
• Range Formation: A new range is detected when the current candle forms entirely within the high and low of the previous candle (i.e., an inside bar). This behavior often indicates price compression and potential breakout zones.
• Range Extension: Once a range is confirmed, the script projects upper and lower boundaries (using either a percentage-based multiplier or Fibonacci log extension), providing context for expected breakout zones.
• Mitigation Tracking: The script continuously monitors whether price breaks above or below the projected extensions, marking that range as mitigated — useful for confirming whether liquidity was absorbed.
• Sweep Detection: If price re-visits a mitigated zone and shows signs of a liquidity sweep (via wick + close behavior), the indicator triggers visual sweep labels and optional alerts.
🧠 Optional Visual Enhancements:
• Highlight range-forming candles with light blue background (toggle on/off)
• Midpoint dotted line for symmetry analysis
• Labels for “Range High” and “Range Low” for visual clarity
• Dynamic box drawing that adapts upon mitigation or continuation
⚙️ Customizable Features:
• Choose between Normal and Fibonacci-based detection modes
• Toggle visibility of range boxes, extension lines, and sweep markers
• Configure sweep alerts, mitigation window size, and visual transparency
⸻
🧪 Use Cases
• Identify consolidation zones before major price moves
• Confirm liquidity sweeps for entry/exit traps
• Visualize and test mitigation behavior of past zones
• Combine with Order Flow or Volume Profile tools to enhance context
⸻
⚠️ This is a fully original implementation that goes beyond classical inside-bar scanners by incorporating mitigation, extension projection, and liquidity sweeps — making it a powerful tool for intraday, swing, and even Smart Money-based trading setups.
