平滑异同移动平均线(MACD)
MACD SlopeShows slopes of macd line, signal line and histogram. A negative and rising slope shows improvement within a downtrend. A positive and falling slope shows deterioration within an uptrend.
EURUSD MACD ALERT 1min Long only Alert Script for AutoviewThis is the Alert Script for the EURUSD 1min Long only script. It is also scripted with the Autoview syntax in the message body of the alert to execute Long at market price and sell open orders at market price. These conditions are set based on the EURUSD 1min Long only script posted. You can adjust as needed.

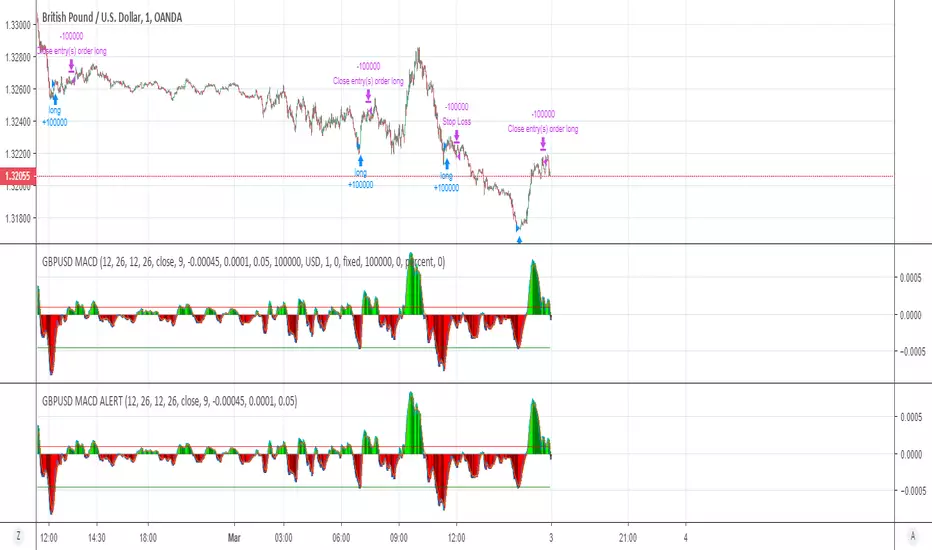
GBPUSD MACD ALERT 1min Long only Alert Script for AutoviewThis is the Alert Script for the GBPUSD 1min Long only script. It is also scripted with the Autoview syntax in the message body of the alert to execute Long at market price and sell open orders at market price. These conditions are set based on the GBPUSD 1min Long only script posted. You can adjust as needed.
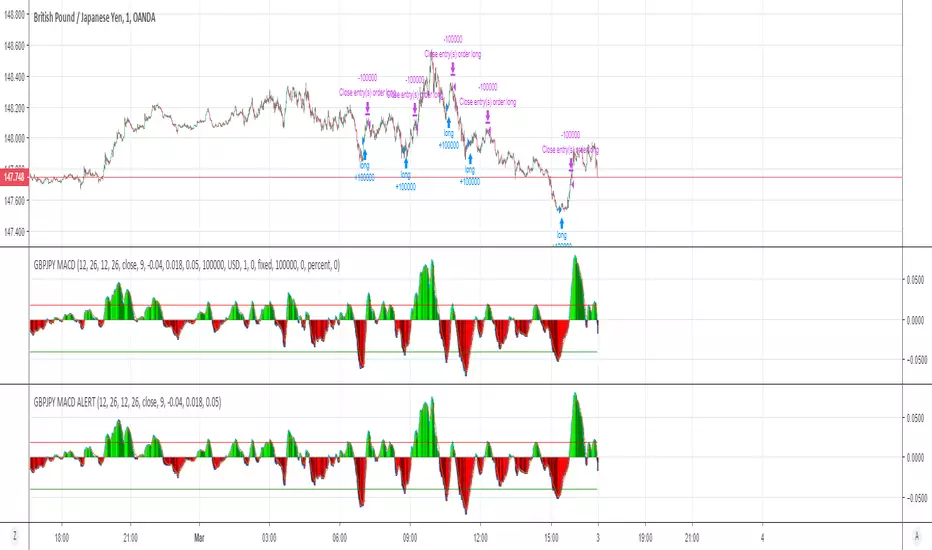
GBPJPY MACD ALERT 1min Long only Alert Script for AutoviewThis is the Alert Script for the GBPJPY 1min Long only script. It is also scripted with the Autoview syntax in the message body of the alert to execute Long at market price and sell open orders at market price. These conditions are set based on the GBPJPY 1min Long only script posted. You can adjust as needed.
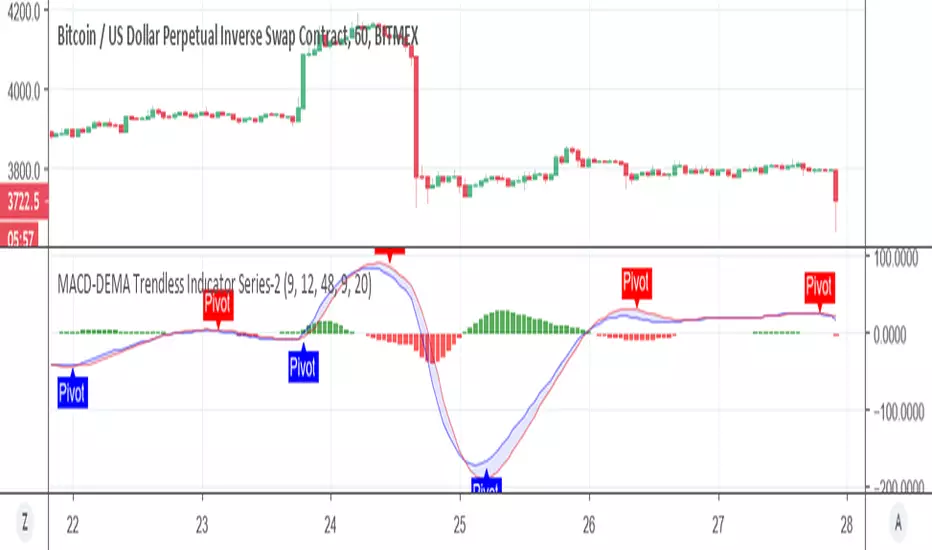
MACD-DEMA Trendless Indıcator Series-2Using This script of MACD DEMA
we play little to add pivot point to the macd so we can get the trend of it better:)
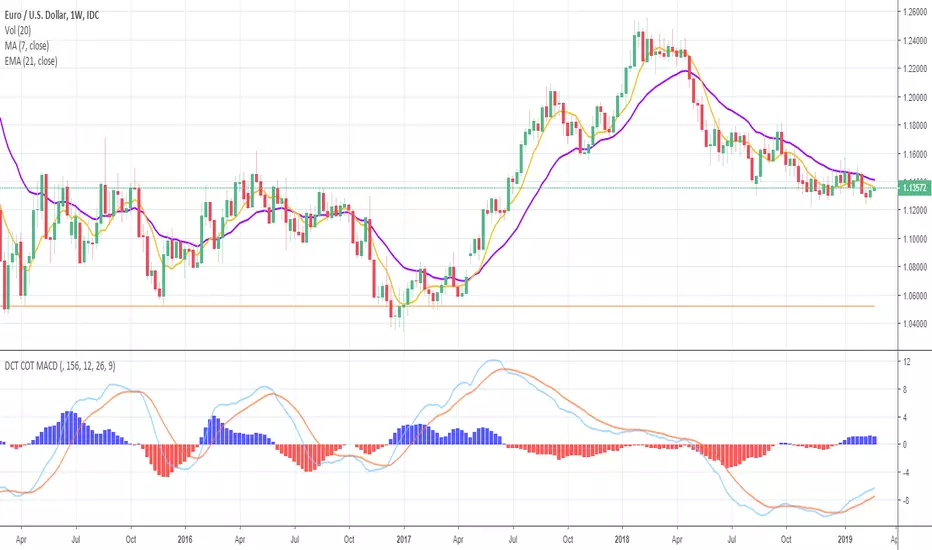
Deckchair Trader COT MACDPlots the COT MACD from the legacy report data from Quandl. Plots the commercial, non commercial and non reportables. Each plot can be hidden as needed.
I've tried to capture the basic dollar based currencies and the futures such as corn , wheat , rice, oil , hogs etc. The symbols required a little translation to match what Quandl is expecting but I think I got most of them. Please let me know of any issues with these.
Part of a suite of COT related indicators based on the excellent book "the commitment of traders bible" by Stephen Briese.
Feb 26, 2018
Release Notes: Quandl have changed their codes :( now they seem to be using the CFTC Id's where are numeric (and can be found in the dump you get from them)
So whereas before for example, GBPUSD was mapped to BP it is now mapped to 096742.
I have gone through the various dumps and tried to map all the symbols I was using, the currency were the easy ones, the wheat, corn etc a little harder to trade down due to variations.
Please let me know if different
Thanks
Tim Titchmarsh
DeckchairTrader
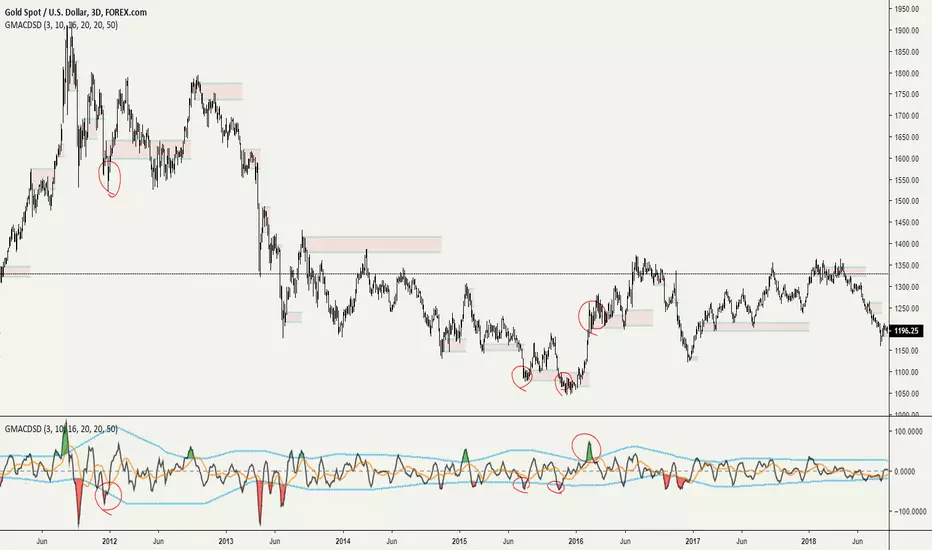
Grimes Modified MACD Supply DemandA follower of mine asked me if I could make a version of my www.tradingview.com script using the MACD. Well it just so happens I was making a few modifications to my MACD script: just as this question came up so I went ahead and threw this together.
The MACD that triggers the SR zones is pictured below, with key trigger points encircled to illustrate how it works.
MACD Enhanced System MTF with optional TSL and Alerts [LTB]This script is developed to analyse MACD, MACD Signal, MACD Histogram movements by using current and higher time frame. Script calculates higher time frame automatically, no manuel entry. there is trailing stop loss line that is optional.
You can change the parameters as you wish.
btw. you should know that MACD is more successful when there is a trend.
I already shared this as a strategy script. Some ppl wanted to see the code.
You might want to see strategy test =>
by LonesomeTheBlue

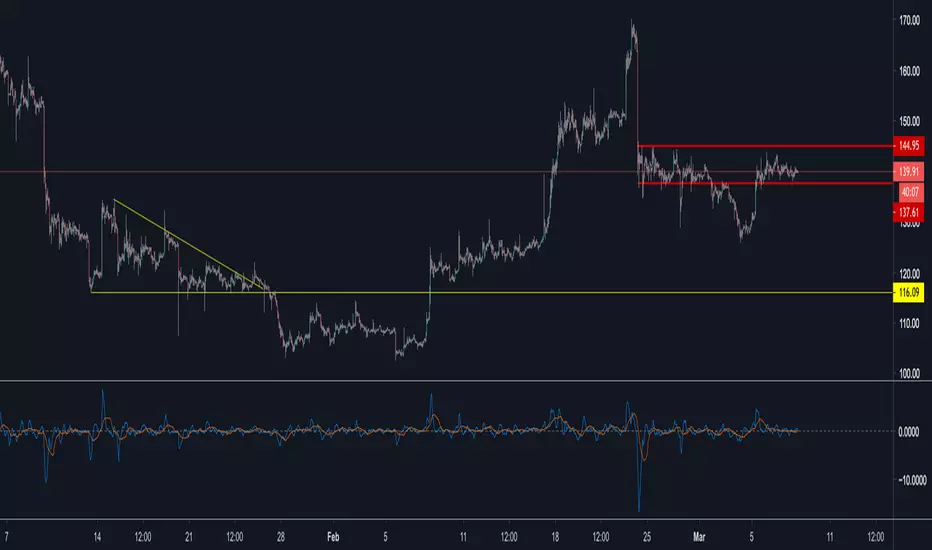
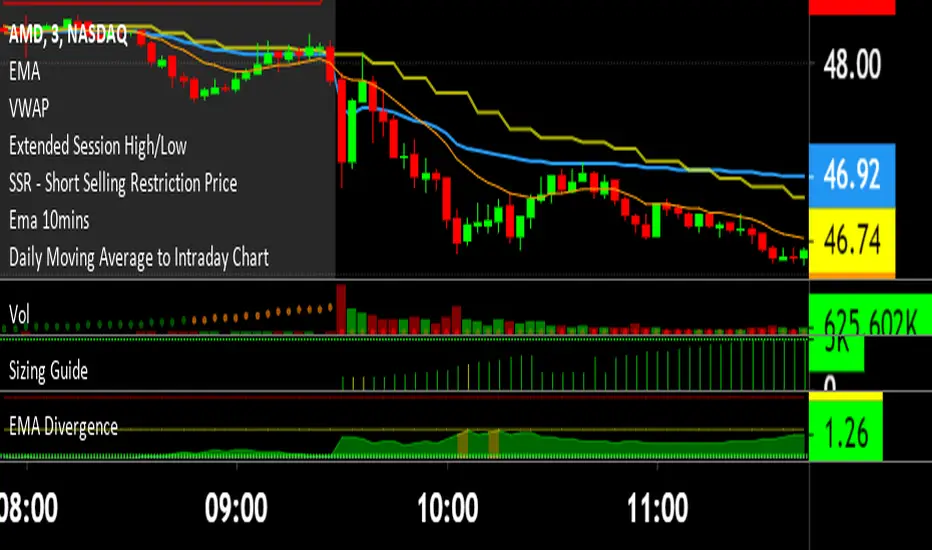
EMA DivergenceThis script automatically calculates the divergence between your favorite exponential moving average and the current price (13 ema default).
Additionally, it displays the area in yellow once the first threshold gets reached (1.5% divergence default) and in red once the second threshold gets reached (1.5% divergence default).
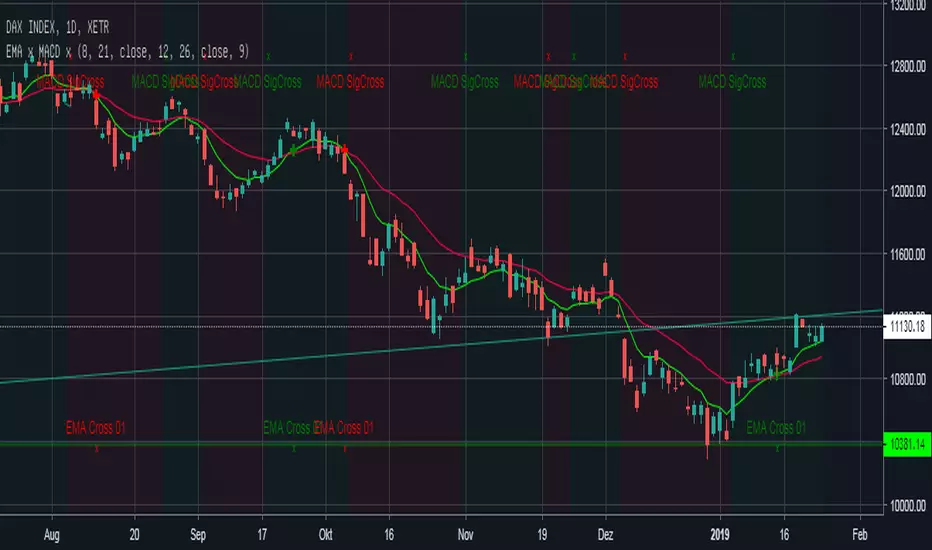
EMA Cross + MACD Signal Cross overlay Einfacher EMA-Cross Indikator mit Indikation der Crosses auf EMA-Linie und am Chart-Bottom +
MACD-Cross wird default an: location.top angezeigt zusätzlich zeigt die Hintergrundfarbe an ob der MACD über (grün) oder unter (rot) seinem Signal liegt.
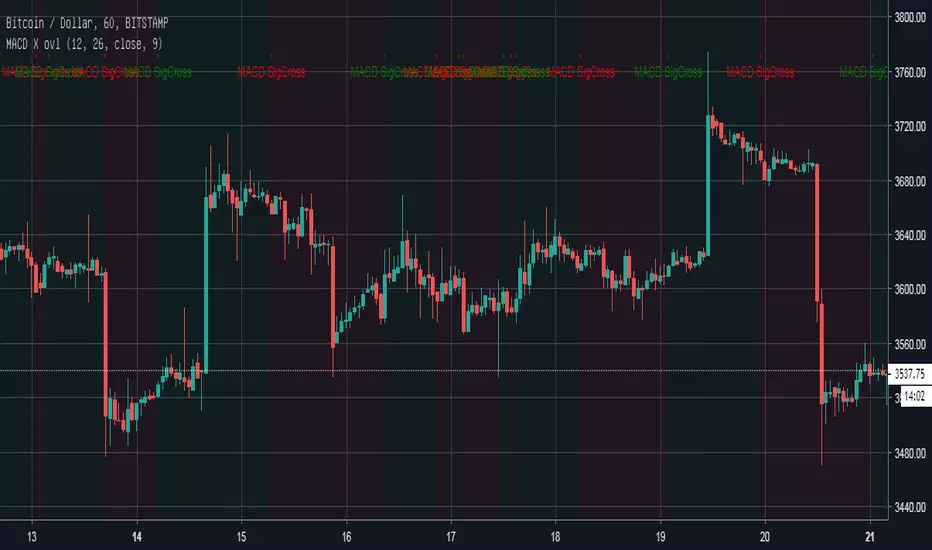
CryptoCoyns MACDS [v2018-12-10]CryptoCoyns MACDS
This indicator implements a standard Moving Average Convergance / Divergance
that works on any chart timeframe. It shows the strength of the current trend.
MACD Crosses are highlighted with yellow circles to make them more obvious.
Strength is indicated by histogram colours moving from Red (weak) through to Light Green (strong):
Red indicates a strong down trend
Yellow indicates a positive change is coming and moving out of a downtrend.
Green indicates a weakening upward trend moving towards a change to a downward trend.
Light Green indicates a strong upward trend
All colours are fully configurable.
If you get some value out of this indicator please consider making
a small donation to my favourite charity the Save the Children's Fund.
Every donation will make a difference to the lives of children.
All donations over $2 are tax deductible. You can donate here:
savethechildrenfundraising.org.au
Copyright (c) 2018, Grant Cause aka CryptoCoyns

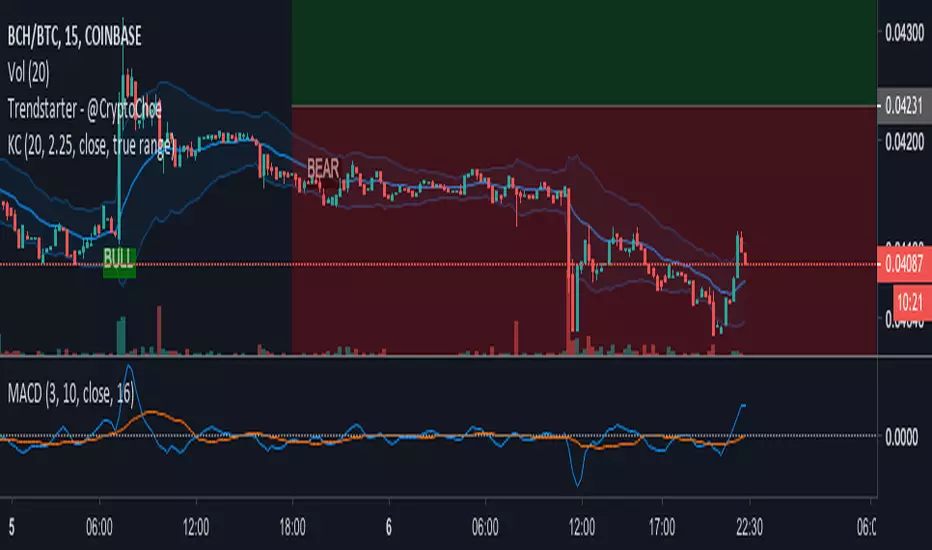
Modified MACD with Zero LineBased on Adam H. Grimes' Modified MACD. Uses a 3/10 simple MA for the fast line and a 16 for the signal line. Added a zero line.
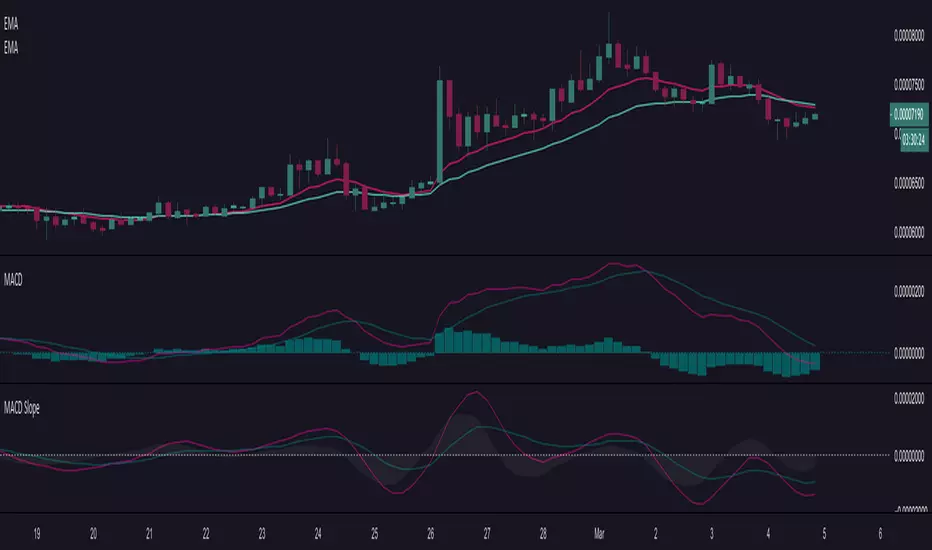
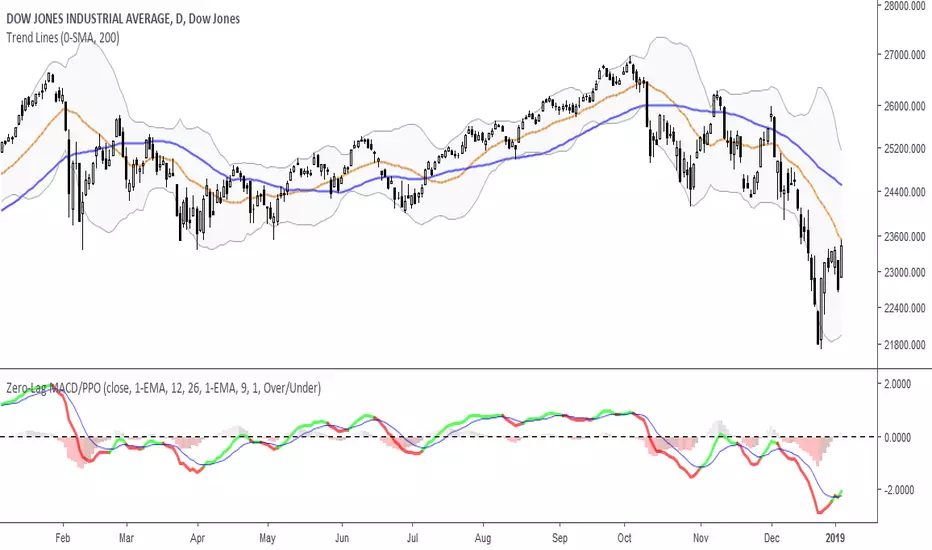
Zero-Lag MACD/PPOMACD/PPO Indicator, with optional faster EMA's to reduce lag.
-Use "MA TYPE" to select SMA, EMA, Double-EMA, Triple-EMA, or Hull as the MACD Source. Default is 'EMA'.
-Use "FAST MA" and "SLOW MA" to set the fast and slow period lengths.
-Use "SIGNAL TYPE" to select SMA, EMA, Double-EMA, Triple-EMA, or Hull as the Signal formula. Default is 'EMA'.
-Use "SIGNAL LENGTH" to set the Signal period length.
-Use "HIST. SIZE" to change the scaling of the histogram and make it stand out more.
-Use "COLOR SIGNALS" to select when to signal green/red on the MACD line.
--- "None" is always black.
--- "Over/Under" will signal based on MACD being over or under the Signal line.
--- "Rising/Falling" will signal based on MACD being over/under the Signal line and both are rising/falling.
-Use "PPO INSTEAD" to use Price Percent Oscillator scaling (works better for long-term and large price fluctuation).
Weekly & Daily Percantage Price OscillatorMy first script.
By Vitali Apirine. Technical Analysis of Stocks & Commodities ( February 2018, Vol.36 Issue 2). Thank you.

Triple Cross of DeathExponential moving averages in red of 4 and 16, exponential moving average of 40 in orange and simple moving average of 200 in yellow to confirm the triple crossing of 4, 16 and 40.
Taken from Lions against gazelles by Jose Luis Carpatos.

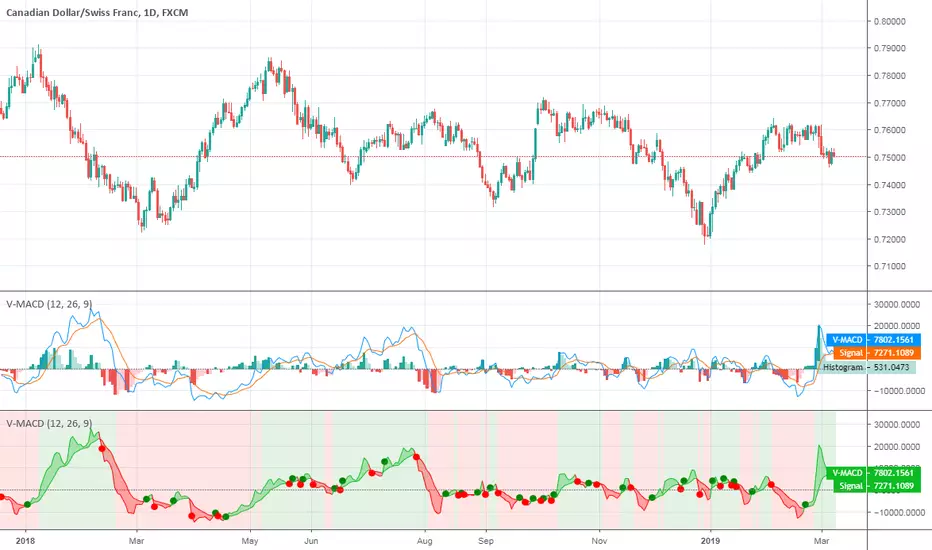
V-MACDHello traders!
This is a variation of classical MACD that uses volume instead of price.
Like and follow for more cool indicators!
Happy Trading!
VW-MACDHello traders!
I am reading "Investing with Volume Analysis: Identify, Follow, and Profit from Trends" by Buff Pelz Dormeier so I am going to implement all indicators that are considered there.
VW-MACD was developed by Buff Pelz Dormeier in 2000 and is based on the difference between a short-term volume-weighted moving average and a long-term volume-weighted moving average. The signal line is traditionally left as an exponential moving average.
Like and follow for more cool indicators!
Happy Trading!

Barssince Playground (Threshold & Persistence)Playground file for implementing MACD with threshold values while visualizing the persistence plot, which counts the amount of spent bars since the MACD delta crossed 0 value in either way.

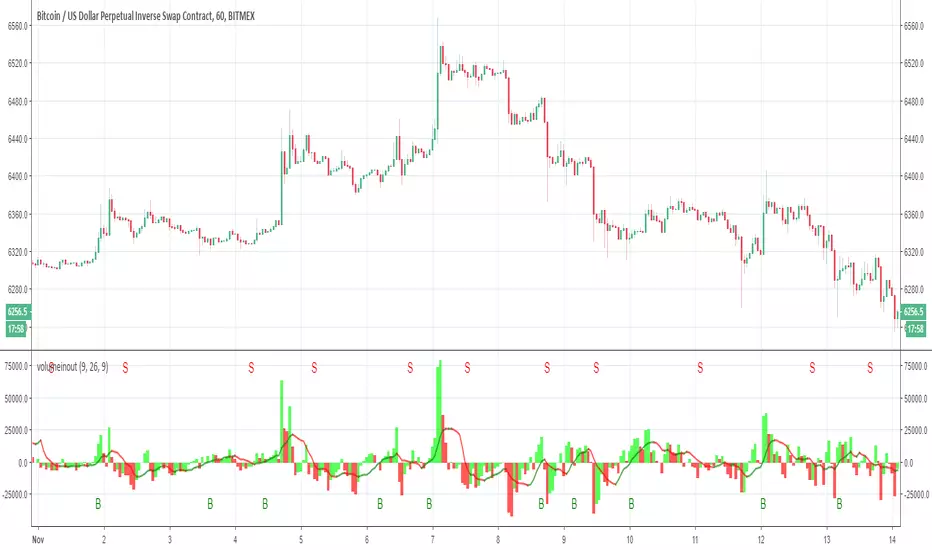
Volume in out as MACD with alerts Lets make the Volume in out as MACD
with alerts (B =buy) S=sell
have fun