Market Regime AnalyzerStatistical regime detection with forward-looking transition probabilities. Combines drift testing, variance ratios, and volume delta to classify markets into 5 regimes and quantify transition probabilities.
What Regime Are We In, and What's Likely Next?
That's the question this indicator answers with statistical rigor and forward-looking probabilities.
The Problem:
Most traders classify regimes arbitrarily: "Bull if price > 200 MA" or "Bear if RSI < 30." These rules ignore statistical significance, volume confirmation, and mean reversion patterns. The result? Late entries, false signals, and confusion when markets transition.
The Solution:
Market Regime Analyzer combines drift detection, variance ratio testing, and volume delta analysis to classify markets into 5 distinct regimes. Then it calculates the probability of transitioning to each regime based on historical patterns.
The Benefit:
Know not just where you are, but where you're likely going - with probabilities, not guesses.
The Five Market Regimes
🟢 Strong Bull (Regime 1)
- Statistically significant upward drift (t-stat > 1.96)
- Strong buying pressure (volume delta > 0.3)
- No mean reversion detected
- **Trade:** Trend-following strategies, ride the momentum
🟢 Weak Bull (Regime 2)
- Upward drift present
- BUT weak volume OR mean reversion detected
- **Trade:** Reduce position size, tighten stops, prepare for consolidation
⚪ Consolidation (Regime 3)
- No statistically significant drift
- Mixed volume signals
- Mean reversion likely present
- **Trade:** Range-trading, avoid trend-following systems
🔴 Weak Bear (Regime 4)
- Downward drift present
- BUT weak volume pressure
- **Trade:** Cautious shorts, reduce exposure, prepare for bounce
🔴 Strong Bear (Regime 5)
- Statistically significant downward drift (t-stat < -1.96)
- Strong selling pressure (volume delta < -0.3)
- No mean reversion detected
- **Trade:** Trend-following shorts, protective puts
The Statistical Framework
1. Drift Detection with T-Statistics
Instead of guessing if there's a trend, we test it statistically.
How it works:
- Calculates mean return over lookback period
- Standardizes by volatility
- Compares to significance threshold (default 1.96 = 95% confidence)
What it tells you:
- T-stat > 1.96: Statistically significant uptrend
- T-stat < -1.96: Statistically significant downtrend
- In between: No significant trend (consolidation)
Why it matters:
Only trades trends that are statistically validated, not just visually apparent.
2. Mean Reversion Testing (Variance Ratio)
Based on Lo & MacKinlay (1988) research, this detects when markets are range-bound.
How it works:
- Compares variance at different time scales
- Variance Ratio < 0.8 indicates mean reversion
What it tells you:
- Mean reversion = NO: Trends can continue
- Mean reversion = YES: Expect price to return to mean, not breakout
Why it matters:
Prevents chasing breakouts in range-bound markets.
3. Volume Delta Analysis
Total volume tells you HOW MUCH traded. Volume delta tells you WHO won.
How it works:
- Buying pressure - Selling pressure = Volume Delta
- Normalized to show relative strength
What it tells you:
- Strong positive delta (>0.3): Buyers in control
- Strong negative delta (<-0.3): Sellers in control
- Weak delta: No clear winner
Why it matters:
Price can move up on weak buying or down on weak selling. Volume delta reveals the truth.
4. Transition Probability Matrix
Historical regime changes predict future regime changes.
How it works:
- Tracks every regime transition over last 100 bars (configurable)
- Builds probability distribution for next regime
- Updates continuously
Example:
Current: Strong Bull
Historical transitions from Strong Bull:
- Stayed Strong Bull: 45%
- Became Weak Bull: 30%
- Became Consolidation: 20%
- Became Weak Bear: 4%
- Became Strong Bear: 1%
What it tells you:
Strong Bull has 75% chance of staying bullish (45% + 30%), only 5% chance of bearish turn.
Why it matters:
Adapts to your specific market's behavior patterns.
How to Use This Indicator
Strategy Adaptation
In Strong Bull/Bear Regimes:
- Use trend-following strategies
- Wider stops, let winners run
- Add to positions on pullbacks
- High confidence in directional trades
In Weak Bull/Bear Regimes:
- Reduce position sizes by 50%
- Tighter stops
- Take profits earlier
- Prepare for regime change
In Consolidation:
- Switch to range-trading strategies
- Avoid trend-following systems
- Sell resistance, buy support
- Wait for regime change before trend trades
Risk Management
Position Sizing:
- Strong regime + high continuation probability (>60%) = Normal size
- Weak regime OR high transition probability = Half size
- Consolidation = Quarter size or skip
Stop Loss Placement:
- Strong regime: Use wider stops (2x ATR)
- Weak regime: Tighter stops (1x ATR)
- Consolidation: Very tight stops (0.5x ATR)
Entry Timing
Best entries:
- Regime just changed to Strong Bull/Bear
- High probability (>50%) of staying in current regime
- No divergence signals present
- Drift and volume delta aligned
Avoid entries:
- High probability of regime change
- Divergence signals appearing
- Mean reversion detected in trending regime
- Weak volume despite price movement
Reading the Dashboard
Current Regime
Color-coded for instant recognition:
- Dark Green = Strong Bull
- Light Green = Weak Bull
- Gray = Consolidation
- Light Red = Weak Bear
- Dark Red = Strong Bear
Annualized Drift
Expected annual return based on recent trend.
- Positive = Upward bias
- Negative = Downward bias
- Near zero = No directional edge
T-Statistic
Measures statistical significance of drift.
- > 1.96 = 95% confident in uptrend
- < -1.96 = 95% confident in downtrend
- Between = Not statistically significant
Mean Reversion
- Yes = Expect price to return to mean (range-bound)
- No = Trends can continue (trending market)
Volume Pressure
Normalized volume delta strength.
- > 0.3 = Strong buying
- < -0.3 = Strong selling
- Near 0 = Balanced
Transition Probabilities
Shows most likely next regime.
- Highest probability = Most likely outcome
- Evenly distributed = High uncertainty
- Concentrated = High confidence in direction
Practical Examples
Example 1: Strong Bull with High Continuation
Dashboard shows:
Current Regime: Strong Bull
Drift: +22% annualized
T-Stat: 3.2
Mean Reversion: No
Volume Pressure: +0.45
Probabilities:
→ Strong Bull: 50%
→ Weak Bull: 25%
→ Consolidation: 20%
→ Bears: 5%
Interpretation:
- Strong uptrend (t-stat 3.2 >> 1.96)
- No mean reversion = trends can continue
- Strong buying pressure (0.45 > 0.3)
- 75% chance stays bullish (50% + 25%)
Action:
- Full position size on long setups
- Use trend-following entries
- Wider stops (2x ATR)
- High conviction trades
Example 2: Weak Bull Before Consolidation
Dashboard shows:
Current Regime: Weak Bull
Drift: +8% annualized
T-Stat: 1.2
Mean Reversion: Yes
Volume Pressure: +0.15
Probabilities:
→ Strong Bull: 10%
→ Weak Bull: 30%
→ Consolidation: 50%
→ Weak Bear: 10%
Interpretation:
- Weak drift (t-stat 1.2 < 1.96)
- Mean reversion detected = range-bound likely
- Weak volume (0.15 < 0.3)
- 50% chance of consolidation
Action:
- Reduce long positions
- Tighten stops
- Prepare for range-bound trading
- Avoid new trend trades
Example 3: Regime Transition Alert
Previous: Weak Bull
Current: Consolidation
Volume divergence signal appeared:
Price made new high, volume delta weakened
Interpretation:
- Trend exhausted
- Buyers losing control
- Regime confirmed the transition
Action:
- Exit trend-following longs
- Switch to range-trading approach
- Wait for new regime before new directional trades
Settings Guide
### Regime Detection Period (50)
Number of bars for statistical calculations.
- **30-40:** More responsive, catches changes faster, more regime switches
- **50 (default):** Balanced for daily/4H charts
- **75-100:** More stable, fewer false regime changes, slower to adapt
Transition History Depth (100)
How much history to use for probabilities.
- **50-75:** Adapts quickly to recent behavior
- **100 (default):** Balanced robustness
- **150-200:** More stable probabilities, slower to adapt
Volume Delta Period (14)
Period for volume calculations.
- **7-10:** More sensitive to volume shifts
- **14 (default):** Standard period
- **20-30:** Smoother, less noise
Significance Threshold (1.96)
T-statistic required for trend classification.
- **1.64:** 90% confidence, more trend regimes detected
- **1.96 (default):** 95% confidence, balanced
- **2.58:** 99% confidence, very conservative, mostly consolidation
Best Practices
Do:
- Wait for regime confirmation (at least 3-5 bars in new regime)
- Use probabilities to size positions appropriately
- Combine with support/resistance for entries
- Respect mean reversion signals
- Adapt strategy to current regime
Don't:
- Trade every regime change immediately
- Ignore high transition probabilities
- Use trend strategies in consolidation
- Override statistical signals with gut feel
- Trade against Strong regimes without clear setup
Timeframe Recommendations
Daily Charts:
- Default settings work well
- Most reliable regime detection
- Best for swing trading
4H Charts:
- Use default or slightly higher lookback (60-75)
- Good for active swing trading
- More regime changes than daily
1H Charts:
- Reduce lookback to 30-40
- More noise, use with caution
- Better for intraday position trading
15M and below:
- Not recommended
- Too much noise for statistical validity
- Regimes change too frequently
Combining with Other Indicators
Works Well With:
Moving Averages
- Use regime for directional bias
- MAs for specific entry/exit points
Support/Resistance
- Regime shows context
- S/R shows specific levels
- High probability at confluence
Volume Profile
- Regime shows regime
- Profile shows where volume is
- Target high-volume nodes
RSI/MACD
- Regime provides context
- Momentum shows entry timing
- Combine for higher probability
Example Combined Setup
Regime: Strong Bull
Price: Above 200 MA
Level: Pullback to support
RSI: Oversold (30)
Volume Delta: Still positive
Setup: Long entry
Reason: Trend intact, healthy pullback, buyers still present
Divergence Signals
The indicator shows volume divergence warnings:
Bearish Divergence (Red Triangle Down)
- Price makes new high
- Volume delta makes lower high
- Warning: Buyers weakening, potential reversal
Bullish Divergence (Green Triangle Up)
- Price makes new low
- Volume delta makes higher low
- Warning: Sellers weakening, potential reversal
How to use:
- Divergence in Strong regime = early warning of regime change
- Confirms when regime actually transitions
- Don't trade divergence alone, wait for regime confirmation
Limitations
This Indicator Cannot:
**Predict black swan events** - Unexpected news overrides all technical regimes
**Work in all markets** - Needs liquid markets with reliable volume data
**Guarantee profits** - Probabilities are not certainties
**Replace fundamental analysis** - Technical regimes can diverge from fundamentals
Works Best:
- Liquid markets (major indices, forex, crypto, large-cap stocks)
- Daily and 4H timeframes
- Combined with other analysis
- With proper risk management
- In normal market conditions
Common Questions
"Why did the regime stay consolidation despite strong price move?"
The indicator detected mean reversion (variance ratio < 0.8), indicating the move will likely reverse. Or the move wasn't statistically significant (t-stat < 1.96). Trust the statistics over visual appearance.
"Probabilities show 30% for each regime. What does that mean?"
High uncertainty. The market is at an inflection point. Reduce position sizes and wait for clearer regime formation.
"Can I use this for day trading?"
Not recommended on timeframes below 1H. Statistical tests need sufficient data. Better suited for swing trading.
"Why does this show Strong Bull when my momentum indicators show weakness?"
Momentum can weaken while the trend remains statistically significant. The indicator focuses on drift and volume, not momentum. Consider it a different perspective.
Technical Notes
Volume Delta Approximation
Uses OHLCV data to approximate order flow:
- Buy volume ≈ Volume on up-closes
- Sell volume ≈ Volume on down-closes
- Delta = Buy - Sell
**Note:** Real order flow (from futures or Level 2) is more precise. This approximation works well on liquid markets.
Statistical Tests
Drift T-Test:
- Null hypothesis: No drift (mean return = 0)
- Reject if |t-stat| > threshold
- Based on standard hypothesis testing
Variance Ratio:
- Compares 2-period variance to 1-period variance
- Ratio = 1 for random walk
- Ratio < 1 for mean reversion
- Threshold of 0.8 based on empirical testing
Transition Probability Implementation
Due to Pine Script v5 limitations (no native 2D arrays), the 5×5 transition matrix is stored as a flat 1D array of 25 elements:
- Position maps to index: `row × 5 + col`
- Example: Transition from Regime 2 to Regime 4 is at index `1 × 5 + 3 = 8`
- Laplace smoothing (0.1) prevents zero probabilities
- Row sums normalized to calculate probabilities
This approach is computationally efficient and maintains statistical accuracy.
No Repainting
All calculations confirmed on bar close. Regime changes appear when the bar closes, not during formation. Historical analysis is accurate.
Alert Conditions
Regime Change
- Triggers when regime transitions to any new state
- Message shows new regime number (1-5)
Bearish Divergence
- Triggers when price makes new high but volume delta doesn't confirm
Bullish Divergence
- Triggers when price makes new low but volume delta doesn't confirm
Disclaimer
FOR EDUCATIONAL PURPOSES ONLY
This indicator uses statistical methods to analyze market regimes. It does not predict the future or guarantee trading success.
Markets are probabilistic, not deterministic. A 70% probability of staying bullish means 30% chance of regime change. Always use proper risk management.
Past regime transitions do not guarantee future transitions. Market structure can change. Statistical relationships can break down.
Never risk more than you can afford to lose. Use stop losses on every trade. Test thoroughly before live trading. Consult a qualified financial advisor.
© 2026 | Open Source
Statistical rigor meets practical application
Market-regime

Volatility Structure Regime Engine (VSgRE)Volatility Structure Regime Engine (VSgRE)
Volatility Structure Regime Engine (VSgRE) is a volatility-based market analysis tool designed to highlight when volatility is likely to expand, without implying trade direction.
The indicator uses a three-layer analytical framework to identify meaningful volatility events while remaining fully direction-agnostic.
🔹 Structure Layer
Defines the broader volatility environment using normalized volatility metrics to distinguish between high- and low-volatility conditions.
🔹 Regime Layer
Identifies volatility compression, expansion, and transition phases, helping traders recognize periods of stored or released market energy.
🔹 Execution Layer
Detects real-time volatility ignition events that signal the start of meaningful expansion.
📊 Signal Types
Strong Signals
Indicate valid volatility expansion events within an active volatility regime.
Elite Signals
Highlight the first volatility expansion following a prolonged compression phase.
Signals are represented using neutral bubbles to avoid bullish or bearish bias.
✅ Key Characteristics
Pure volatility-based logic
Leading, non-directional signals
Clean and minimal chart visuals
State-based, non-repetitive signaling
Suitable for breakout timing, regime analysis, and risk awareness
⚠️ Disclaimer
This indicator is provided for educational and analytical purposes only. It does not constitute financial advice. Trading involves risk, and users are responsible for their own decisions.

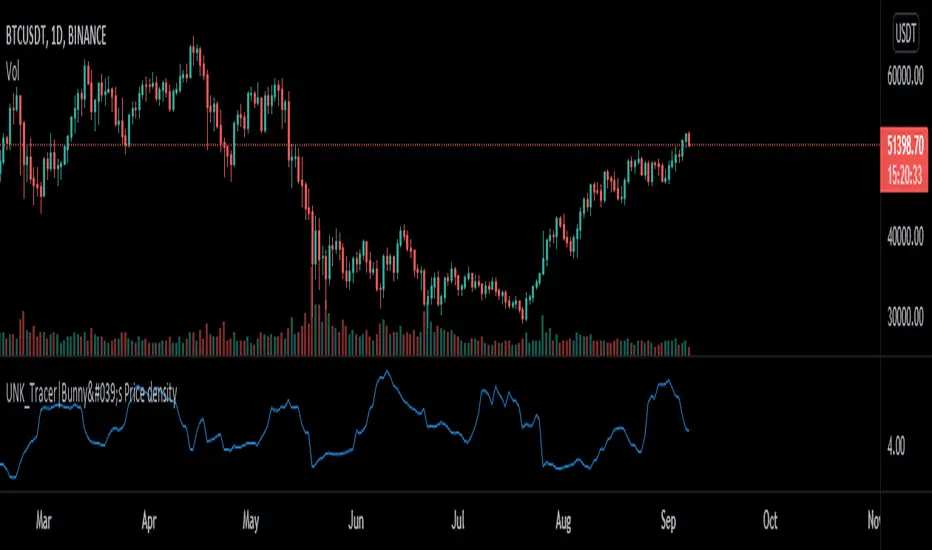
Price density [Measuring Market Noise:Take advantage]$$ Market noise can be problematic to some types of trading strategies yet beneficial to others.
By measuring noise using the 'Price Density' can enable us to improve our
trading edge and turn noise to our advantage.
Robust analysis of noise can inform us when it is best to avoid trend-following
systems (when noise is too high), and vice versa for systems based on a
mean-reverting trading premise (when market noise is low).
__________________________________________________________________________
Using Noise to our advantage
* Two techniques:
-Measure Noise and trade when suitable for the system
~ High noise = avoid trend-following
~ Low noise = avoid mean-reversion
-Match assets to strategies
~ Only trade 'noisy assets' with Mean-reversion Strategies
~ Only trade 'efficient assests' with Trend-following Strategies
## Price density:-
High values = High noise
Low values = Low noise
___________________________________________________________________________
Disclaimer!! Do your own research