Advanced Volume Profile Pro Delta + POC + VAH/VAL# Advanced Volume Profile Pro - Delta + POC + VAH/VAL Analysis System
## WHAT THIS SCRIPT DOES
This script creates a comprehensive volume profile analysis system that combines traditional volume-at-price distribution with delta volume calculations, Point of Control (POC) identification, and Value Area (VAH/VAL) analysis. Unlike standard volume indicators that show only total volume over time, this script analyzes volume distribution across price levels and estimates buying vs selling pressure using multiple calculation methods to provide deeper market structure insights.
## WHY THIS COMBINATION IS ORIGINAL AND USEFUL
**The Problem Solved:** Traditional volume indicators show when volume occurs but not where price finds acceptance or rejection. Standalone volume profiles lack directional bias information, while basic delta calculations don't provide structural context. Traders need to understand both volume distribution AND directional sentiment at key price levels.
**The Solution:** This script implements an integrated approach that:
- Maps volume distribution across price levels using configurable row density
- Estimates delta (buying vs selling pressure) using three different methodologies
- Identifies Point of Control (highest volume price level) for key support/resistance
- Calculates Value Area boundaries where 70% of volume traded
- Provides real-time alerts for key level interactions and volume imbalances
**Unique Features:**
1. **Developing POC Visualization**: Real-time tracking of Point of Control migration throughout the session via blue dotted trail, revealing institutional accumulation/distribution patterns before they complete
2. **Multi-Method Delta Calculation**: Price Action-based, Bid/Ask estimation, and Cumulative methods for different market conditions
3. **Adaptive Timeframe System**: Auto-adjusts calculation parameters based on chart timeframe for optimal performance
4. **Flexible Profile Types**: N Bars Back (precise control), Days Back (calendar-based), and Session-based analysis modes
5. **Advanced Imbalance Detection**: Identifies and highlights significant buying/selling imbalances with configurable thresholds
6. **Comprehensive Alert System**: Monitors POC touches, Value Area entry/exit, and major volume imbalances
## HOW THE SCRIPT WORKS TECHNICALLY
### Core Volume Profile Methodology:
**1. Price Level Distribution:**
- Divides price range into user-defined rows (10-50 configurable)
- Calculates row height: `(Highest Price - Lowest Price) / Number of Rows`
- Distributes each bar's volume across price levels it touched proportionally
**2. Delta Volume Calculation Methods:**
**Price Action Method:**
```
Price Range = High - Low
Buy Pressure = (Close - Low) / Price Range
Sell Pressure = (High - Close) / Price Range
Buy Volume = Total Volume × Buy Pressure
Sell Volume = Total Volume × Sell Pressure
Delta = Buy Volume - Sell Volume
```
**Bid/Ask Estimation Method:**
```
Average Price = (High + Low + Close) / 3
Buy Volume = Close > Average ? Volume × 0.6 : Volume × 0.4
Sell Volume = Total Volume - Buy Volume
```
**Cumulative Method:**
```
Buy Volume = Close > Open ? Volume : Volume × 0.3
Sell Volume = Close ≤ Open ? Volume : Volume × 0.3
```
**3. Point of Control (POC) Identification:**
- Scans all price levels to find maximum volume concentration
- POC represents the price level with highest trading activity
- Acts as significant support/resistance level
- **Developing POC Feature**: Tracks POC evolution in real-time via blue dotted trail, showing how institutional interest migrates throughout the session. Upward POC migration indicates accumulation patterns, downward migration suggests distribution, providing early trend signals before price confirmation.
**4. Value Area Calculation:**
- Starts from POC and expands up/down to encompass 70% of total volume
- VAH (Value Area High): Upper boundary of value area
- VAL (Value Area Low): Lower boundary of value area
- Expansion algorithm prioritizes direction with higher volume
**5. Adaptive Range Selection:**
Based on profile type and timeframe optimization:
- **N Bars Back**: Fixed lookback period with performance optimization (20-500 bars)
- **Days Back**: Calendar-based analysis with automatic timeframe adjustment (1-365 days)
- **Session**: Current trading session or custom session times
### Performance Optimization Features:
- **Sampling Algorithm**: Reduces calculation load on large datasets while maintaining accuracy
- **Memory Management**: Clears previous drawings to prevent performance degradation
- **Safety Constraints**: Prevents excessive memory usage with configurable limits
## HOW TO USE THIS SCRIPT
### Initial Setup:
1. **Profile Configuration**: Select profile type based on trading style:
- N Bars Back: Precise control over data range
- Days Back: Intuitive calendar-based analysis
- Session: Real-time session development
2. **Row Density**: Set number of rows (30 default) - more rows = higher resolution, slower performance
3. **Delta Method**: Choose calculation method based on market type:
- Price Action: Best for trending markets
- Bid/Ask Estimate: Good for ranging markets
- Cumulative: Smoothed approach for volatile markets
4. **Visual Settings**: Configure colors, position (left/right), and display options
### Reading the Profile:
**Volume Bars:**
- **Length**: Represents relative volume at that price level
- **Color**: Green = net buying pressure, Red = net selling pressure
- **Intensity**: Darker colors indicate volume imbalances above threshold
**Key Levels:**
- **POC (Blue Line)**: Highest volume price - major support/resistance
- **VAH (Purple Dashed)**: Value Area High - upper boundary of fair value
- **VAL (Orange Dashed)**: Value Area Low - lower boundary of fair value
- **Value Area Fill**: Shaded region showing main trading range
**Developing POC Trail:**
- **Blue Dotted Lines**: Show real-time POC evolution throughout the session
- **Migration Patterns**: Upward trail indicates bullish accumulation, downward trail suggests bearish distribution
- **Early Signals**: POC movement often precedes price movement, providing advance warning of institutional activity
- **Institutional Footprints**: Reveals where smart money concentrated volume before final POC establishment
### Trading Applications:
**Support/Resistance Analysis:**
- POC acts as magnetic price level - expect reactions
- VAH/VAL provide intermediate support/resistance levels
- Profile edges show areas of low volume acceptance
**Developing POC Analysis:**
- **Upward Migration**: POC moving higher = institutional accumulation, bullish bias
- **Downward Migration**: POC moving lower = institutional distribution, bearish bias
- **Stable POC**: Tight clustering = balanced market, range-bound conditions
- **Early Trend Detection**: POC direction change often precedes price breakouts
**Entry Strategies:**
- Buy at VAL with POC as target (in uptrends)
- Sell at VAH with POC as target (in downtrends)
- Breakout plays above/below profile extremes
**Volume Imbalance Trading:**
- Strong buying imbalance (>60% threshold) suggests continued upward pressure
- Strong selling imbalance suggests continued downward pressure
- Imbalances near key levels provide high-probability setups
**Multi-Timeframe Context:**
- Use higher timeframe profiles for major levels
- Lower timeframe profiles for precise entries
- Session profiles for intraday trading structure
## SCRIPT SETTINGS EXPLANATION
### Volume Profile Settings:
- **Profile Type**: Determines data range for calculation
- N Bars Back: Exact number of bars (20-500 range)
- Days Back: Calendar days with timeframe adaptation (1-365 days)
- Session: Trading session-based (intraday focus)
- **Number of Rows**: Profile resolution (10-50 range)
- **Profile Width**: Visual width as chart percentage (10-50%)
- **Value Area %**: Volume percentage for VA calculation (50-90%, 70% standard)
- **Auto-Adjust**: Automatically optimizes for different timeframes
### Delta Volume Settings:
- **Show Delta Volume**: Enable/disable delta calculations
- **Delta Calculation Method**: Choose methodology based on market conditions
- **Highlight Imbalances**: Visual emphasis for significant volume imbalances
- **Imbalance Threshold**: Percentage for imbalance detection (50-90%)
### Session Settings:
- **Session Type**: Daily, Weekly, Monthly, or Custom periods
- **Custom Session Time**: Define specific trading hours
- **Previous Sessions**: Number of historical sessions to display
### Days Back Settings:
- **Lookback Days**: Number of calendar days to analyze (1-365)
- **Automatic Calculation**: Script automatically converts days to bars based on timeframe:
- Intraday: Accounts for 6.5 trading hours per day
- Daily: 1 bar per day
- Weekly/Monthly: Proportional adjustment
### N Bars Back Settings:
- **Lookback Bars**: Exact number of bars to analyze (20-500)
- **Precise Control**: Best for systematic analysis and backtesting
### Visual Customization:
- **Colors**: Bullish (green), Bearish (red), and level colors
- **Profile Position**: Left or Right side of chart
- **Profile Offset**: Distance from current price action
- **Labels**: Show/hide level labels and values
- **Smooth Profile Bars**: Enhanced visual appearance
### Alert Configuration:
- **POC Touch**: Alerts when price interacts with Point of Control
- **VA Entry/Exit**: Alerts for Value Area boundary interactions
- **Major Imbalance**: Alerts for significant volume imbalances
## VISUAL FEATURES
### Profile Display:
- **Horizontal Bars**: Volume distribution across price levels
- **Color Coding**: Delta-based coloring for directional bias
- **Smooth Rendering**: Optional smoothing for cleaner appearance
- **Transparency**: Configurable opacity for chart readability
### Level Lines:
- **POC**: Solid blue line with optional label
- **VAH/VAL**: Dashed colored lines with value displays
- **Extension**: Lines extend across relevant time periods
- **Value Area Fill**: Optional shaded region between VAH/VAL
### Information Table:
- **Current Values**: Real-time POC, VAH, VAL prices
- **VA Range**: Value Area width calculation
- **Positioning**: Multiple table positions available
- **Text Sizing**: Adjustable for different screen sizes
## IMPORTANT USAGE NOTES
**Realistic Expectations:**
- Volume profile analysis provides structural context, not trading signals
- Delta calculations are estimations based on price action, not actual order flow
- Past volume distribution does not guarantee future price behavior
- Combine with other analysis methods for comprehensive market view
**Best Practices:**
- Use appropriate profile types for your trading style:
- Day Trading: Session or Days Back (1-5 days)
- Swing Trading: Days Back (10-30 days) or N Bars Back
- Position Trading: Days Back (60-180 days)
- Consider market context (trending vs ranging conditions)
- Verify key levels with additional technical analysis
- Monitor profile development for changing market structure
**Performance Considerations:**
- Higher row counts increase calculation complexity
- Large lookback periods may affect chart performance
- Auto-adjust feature optimizes for most use cases
- Consider using session profiles for intraday efficiency
**Limitations:**
- Delta calculations are estimations, not actual transaction data
- Profile accuracy depends on available price/volume history
- Effectiveness varies across different instruments and market conditions
- Requires understanding of volume profile concepts for optimal use
**Data Requirements:**
- Requires volume data for accurate calculations
- Works best on liquid instruments with consistent volume
- May be less effective on very low volume or exotic instruments
This script serves as a comprehensive volume analysis tool for traders who need detailed market structure information with integrated directional bias analysis and real-time POC development tracking for informed trading decisions.
Market

Janmay's Fractal Price FilterJanmay’s Fractal Price Flow Filter
A precision-crafted market bias tool that maps major and minor fractal levels while overlaying a proprietary Price Flow curve.
Built for traders who want structure clarity and momentum insight without lag or noise.
Quick-start strategy:
Uptrend: When the minor fractal sits above the major fractal and price candles stay above the Price Flow curve, conditions favor buying.
Exit/Sell: If price slips back under the Price Flow curve, momentum may be reversing.
Downtrend: Simply flip the logic — minor fractal below major fractal and candles trading below the curve favors selling.
Best use: Optimized for 10–15m charts and currently tested on BTCUSD.
That’s just the tip of the iceberg.
To unlock the full potential of this indicator and advanced setups, contact tradejanmay@gmail.com for further guidance.

Fundur - Market Sentiment A Fundur - Market Sentiment A: Complete Trading Indicator Guide
Indicator Overview
The Fundur - Market Sentiment A is a revolutionary multi-timeframe sentiment analysis indicator that combines advanced ZigZag pivot detection, wave-based structure analysis, and comprehensive market sentiment evaluation into one powerful trading tool. This indicator is designed to identify high-probability reversal points and trend continuations by analyzing market sentiment across 11 different timeframes simultaneously.
What Makes Market Sentiment A Unique?
Market Sentiment A is a sophisticated ZigZag system that utilizes the Market Sentiment B oscillator to perform advanced on-chart analysis against price action. By introducing Histogram-Correlated ZigZag Analysis - a breakthrough methodology that correlates sentiment histogram waves with actual price pivots to identify validated market extremes. Unlike static pivot indicators, Market Sentiment A provides dynamic analysis that adapts to changing market conditions while maintaining precise accuracy in pivot identification.
Core Methodology
The indicator operates on the principle that market sentiment oscillates in measurable waves that precede price movements. By analyzing sentiment patterns across multiple timeframes and correlating them with histogram wave behavior, traders can identify precise entry and exit points with quantifiable strength ratings and comprehensive wave event analysis.
Key Features
🎯 Revolutionary ZigZag System
Histogram-Correlated Detection : Unique correlation between sentiment waves and price pivots
Dynamic Speed Control : High, Medium, Low sensitivity settings for different market conditions
Validated Extremes : Only confirmed pivots are marked with comprehensive validation system
Real-Time Correlation : Live correlation between histogram turns and price extremes
📊 Multi-Timeframe Sentiment Engine
11 Timeframe Analysis : Simultaneous analysis across periods from 8 to 987 bars
Advanced Sentiment Calculation : Proprietary algorithm combining multiple sentiment factors
Momentum Wave Integration : 34-period momentum waves for trend context
Dynamic Smoothing : Optional smoothing for cleaner signals
🧠 Intelligent Wave Event Tracking
Green Wave Events : Bullish histogram wave analysis with comprehensive event detection
Red Wave Events : Bearish histogram wave analysis with detailed event tracking
Event Deduplication : Advanced system prevents duplicate event detection
10+ Event Types : MPIV, HTURN, TRI, SW, VOL, MDIV, HDIV, PDIV and more
⚖️ Advanced Strength Rating System
0-100 Strength Score : Comprehensive strength calculation for every pivot
Multi-Factor Analysis : Based on wave events, trend context, structure, and sentiment
Real-Time Calculation : Dynamic strength scoring as conditions change
Strength Breakdown : Detailed tooltip showing strength components
🎨 Sophisticated Visual System
Validated Pivot Labels : Clear ✓ markers for confirmed extremes
Structure Analysis : HH/HL/LH/LL structure identification with trend context
Dynamic ZigZag Lines : Connecting validated extremes with trend-based coloring
Bar Coloring Options : Momentum swings and market sentiment bar coloring
Comprehensive Tooltips : Detailed information on hover for every pivot
Setup Guide
Step 1: Adding the Indicator
Open TradingView and navigate to your desired chart
Click the "Indicators" button or press "/" key
Search for "Fundur - Market Sentiment A"
Add the indicator to your chart
Step 2: Core System Configuration
ZigZag System Settings
✅ Enable ZigZag System: ON (Core functionality)
ZigZag Speed : Choose based on your trading style:
High Speed : Most sensitive, fastest detection (2-bar lookback) - Best for scalping
Medium Speed : Balanced approach (3-bar lookback) - Recommended for most traders
Low Speed : Most reliable, slower detection (4-bar lookback) - Best for swing trading
✅ Show ZigZag Lines: ON (Visual connection of validated pivots)
Bar Coloring Settings
⚠️ Momentum Swings: OFF (Avoid visual clutter initially)
✅ Market Sentiment: ON (Primary sentiment-based bar coloring)
Step 3: Label Display Configuration
Essential Labels (Recommended Settings)
✅ Show Validated Pivots (✓): ON (Core validated extremes)
⚠️ Show Potential Turns (●): OFF (Reduces noise - enable once familiar)
⚠️ Show Structure Labels: OFF (Start clean, enable for advanced analysis)
⚠️ Include Trend in Structure Labels: OFF (Advanced feature)
✅ Show Strength Rating (💪): ON (Critical for trade quality assessment)
⚠️ Show Market Sentiment Wave Events: OFF (Advanced feature for later)
Label Visual Customization
Label Coloring : Standard (Highs=Red, Lows=Green)
Label Size : Normal
Label Transparency : 0%
Text Transparency : 0%
Step 4: Alert System Setup
✅ Enable Alerts: ON
⚠️ Alert Potential Bullish Turns: OFF (Disabled by design to prevent noise)
⚠️ Alert Potential Bearish Turns: OFF (Disabled by design to prevent noise)
✅ Alert ONLY on Confirmed Extremes: ON (High-quality signals only)
✅ Include Wave Events in Confirmed Alerts: ON (Comprehensive context)
Basic Trading Guide
Understanding the Dynamic ZigZag System
Market Sentiment A is fundamentally a Dynamic ZigZag System that displays validated highs and lows on your price chart. The indicator uses Market Sentiment B wave calculations internally to determine when sentiment waves finish, but these histograms and oscillators are NOT displayed on your chart .
What You See on Your Chart:
✓ Validated Highs : Red checkmarks marking confirmed resistance levels
✓ Validated Lows : Green checkmarks marking confirmed support levels
ZigZag Lines : Connecting validated extremes to show market structure
💪 Strength Ratings : 0-100 scores indicating signal quality
Structure Labels : HH/HL/LH/LL showing trend context
How Validation Works (Behind the Scenes):
High Validation : Uses Market Sentiment B wave analysis to confirm when a price high represents a true resistance level
Low Validation : Uses Market Sentiment B wave analysis to confirm when a price low represents a true support level
Dynamic Detection : Continuously monitors sentiment waves to validate extremes in real-time
Quality Filtering : Only displays the most significant highs and lows based on wave completion
Key Trading Concept:
Focus entirely on the validated highs and lows displayed on your chart. These represent dynamic support and resistance levels that have been confirmed by underlying sentiment analysis. The histogram and oscillator calculations happen internally - your trading decisions should be based on price action around these validated levels.
Entry Strategies
Primary Strategy: Dynamic Support/Resistance Reversals
Setup : Wait for validated pivot with ✓ marker and strength rating displayed on chart
Entry Timing : Enter on the bar when validation occurs or on pullback to the validated level
Direction : Counter-trend to the validated extreme (buy at validated lows/support, sell at validated highs/resistance)
Confirmation : Look for strength rating above 60 for higher probability setups
Structure Context : Consider overall trend using HH/HL/LH/LL structure labels
Secondary Strategy: ZigZag Trend Continuation
Setup : Identify trend direction using consecutive validated highs and lows
Entry : Enter in trend direction when price pulls back to previous validated level
Confirmation : Look for structure labels confirming trend (HH/HL for uptrend, LH/LL for downtrend)
Strength Filter : Use strength ratings above 70 for trend continuation entries
Stop Loss Methodology
For Long Positions (Validated Lows) : Place stop below the validated low price level
For Short Positions (Validated Highs) : Place stop above the validated high price level
Alternative Method : Use previous validated extreme in opposite direction as stop level
Structure-Based Method : Use significant validated levels that would invalidate the trade setup
Buffer Consideration : Add small buffer beyond validated level to account for wicks and spread
Profit Taking Strategy
For Long Positions (Validated Low Entries):
Target 1 : Previous validated high shown on chart (75% of position)
Target 2 : Next significant validated high or key resistance level (50% of remaining 25% = 12.5% of original position)
Target 3 : Extended targets using ZigZag structure analysis and trend context (remaining 12.5% of original position)
Management : Move stop loss to breakeven once first target (TP1) is executed
For Short Positions (Validated High Entries):
Target 1 : Previous validated low shown on chart (75% of position)
Target 2 : Next significant validated low or key support level (50% of remaining 25% = 12.5% of original position)
Target 3 : Extended targets using ZigZag structure analysis and trend context (remaining 12.5% of original position)
Management : Move stop loss to breakeven once first target (TP1) is executed
ZigZag Structure Trading Approach
Sideways Markets : Trade between validated highs and lows - buy at support, sell at resistance
Trending Markets : Use validated levels as pullback entry points in trend direction
Structure Breaks : Watch for breaks of significant validated levels to signal trend changes
Range Identification : Use consecutive validated highs and lows to identify trading ranges
Breakout Trading : Enter when price breaks beyond validated levels with strong momentum
Strength Rating Interpretation
Understanding the 0-100 Strength Score
The strength rating combines multiple factors:
Base Strength (25 points) : Fundamental pivot validation
Wave Events (12 points each) : Number and quality of wave events detected
Trend Context (5-10 points) : Alignment with overall trend direction
Structure Quality (3-8 points) : HH/HL/LH/LL structure strength
Sentiment Position (5-10 points) : Extreme sentiment readings
Momentum Context (5 points) : Momentum divergence confirmation
Strength Categories
90-100 : Exceptional strength - Highest probability setups
75-89 : Strong signal - High confidence trades
60-74 : Good signal - Solid trading opportunities
45-59 : Moderate signal - Use additional confirmation
30-44 : Weak signal - Proceed with caution
Below 30 : Very weak - Generally avoid
Wave Event Reference (Calculation Background)
Understanding Wave Events in Strength Calculations
Wave events are used internally by Market Sentiment A to calculate strength ratings and validate pivots. While these events may appear in alert messages or tooltips, they are not meant for direct trading decisions - they are calculation components that contribute to the overall strength score.
Key Wave Events (For Reference Only)
MPIV↑/MPIV↓ : Momentum pivot detection used in validation process
HTURN : Histogram turn identification used for wave completion
TRI↑/TRI↓ : Triangle pattern detection contributing to strength calculation
SW : Small wave indication affecting pivot quality assessment
VOL : Volume spike detection adding to strength scoring
MDIV↑/MDIV↓ : Momentum divergence contributing to validation strength
HDIV↑/HDIV↓ : Histogram divergence used in pivot confirmation
PDIV↑/PDIV↓ : Price divergence analysis for strength enhancement
How Wave Events Affect Your Trading
Strength Score Impact : More events generally result in higher strength ratings for validated pivots
Alert Context : Events may be mentioned in alerts to provide background on signal quality
Focus on Results : Instead of analyzing individual events, focus on the final strength rating and validated pivot levels
Trust the System : The indicator processes these events automatically - your job is to trade the validated highs and lows
Analysis Setups
Setup 1: Scalping Configuration (1-5 minute charts)
Core Settings:
ZigZag Speed: High (fastest detection for quick scalps)
Show Validated Pivots: ON
Show Strength Rating: ON
Bar Coloring: Market Sentiment
Visual Settings:
Label Size: Small (reduce visual clutter)
ZigZag Lines: ON
Potential Turns: ON (for immediate signals)
Trading Approach:
Focus on strength ratings above 70 for scalp entries
Quick entries at validated highs/lows with immediate execution
Tight stops just beyond validated levels
Target previous validated pivots shown on chart for quick profits
Use ZigZag structure to identify rapid reversal opportunities
Setup 2: Day Trading Configuration (5-15 minute charts)
Core Settings:
ZigZag Speed: Medium (balanced approach)
Show Validated Pivots: ON
Show Strength Rating: ON
Include Wave Events: ON (for context)
Visual Settings:
Label Size: Normal
Show Structure Labels: ON (for trend context)
ZigZag Lines: ON with trend coloring
Trading Approach:
Wait for strength ratings above 60 for quality setups
Use HH/HL/LH/LL structure labels for trend bias
Combine reversal trades at extremes with trend continuation at pullbacks
Hold positions targeting next validated pivot levels
Use ZigZag structure analysis for entry timing and market context
Setup 3: Swing Trading Configuration (1-4 hour charts)
Core Settings:
ZigZag Speed: Low (most reliable signals)
Show Validated Pivots: ON
Show Structure Labels: ON
Include Trend Analysis: ON
Visual Settings:
Label Size: Normal
Show all wave events for comprehensive analysis
Enable all alert types
Trading Approach:
Focus on strength ratings above 75 for swing positions
Emphasize trend continuation using ZigZag structure
Use validated level breaks for major position adjustments
Hold positions across multiple sessions targeting distant validated levels
Use comprehensive structure analysis (HH/HL/LH/LL) for entries/exits
Setup 4: Position Trading Configuration (4H-Daily charts)
Core Settings:
ZigZag Speed: Low (maximum reliability)
Show Validated Pivots: ON
Show Structure Labels: ON
Show all analysis features
Visual Settings:
Clean, comprehensive labeling
Full wave event display
Trend-based coloring for major bias
Trading Approach:
Only trade strength ratings above 80 for position entries
Focus on major ZigZag structure changes and validated level breaks
Use long-term structure analysis (HH/HL/LH/LL) for bias
Hold positions for weeks to months targeting major validated levels
Align with fundamental analysis and major market structure
Setup 5: Multi-Asset Analysis Configuration
For Forex Pairs:
Use Medium to Low speed settings
Focus on major session changes
Pay attention to news event correlation
Use strength ratings above 70
For Crypto Assets:
Medium speed for 24/7 market adaptation
Higher volatility requires strength above 75
Monitor weekend behavior patterns
Consider market sentiment cycles
For Stock Markets:
Align with market hours
Consider earnings and economic events
Use sector-specific analysis
Respect market close/open dynamics
Visual Components
Core Visual Elements
✓ Validated Pivots : Green checkmarks for confirmed lows, red for confirmed highs
● Potential Turns : Small dots showing histogram turn correlations (optional)
ZigZag Lines : Connecting validated extremes with trend-based coloring
💪 Strength Ratings : Numerical strength scores from 0-100
Structure Labels : HH/HL/LH/LL with trend context (optional)
Bar Coloring System
Market Sentiment Coloring : Based on sentiment oscillator position and momentum
Extreme Conditions : Special coloring for extreme overbought/oversold conditions
Momentum Swing Coloring : Alternative coloring based on momentum analysis
Advanced Visual Features
Wave Event Labels : Comprehensive event display within pivot labels
Trend Context : Dynamic trend identification and display
Strength Breakdown : Detailed tooltips showing strength components
Custom Coloring Modes : Standard vs trend-based coloring options
Alert System
Core Alert Types
Validated High Confirmed : When red wave validates ultimate high with full context
Validated Low Confirmed : When green wave validates ultimate low with full context
Trend Change Detected : When structure analysis detects trend shifts
Alert Message Structure
Each alert includes:
Timeframe identification
Signal type (BULLISH/BEARISH)
Structure context (HH/HL/LH/LL)
Strength score with 💪 rating
Exact price level
Wave events context (if enabled)
Setting Up Alerts
Enable desired alert types in indicator settings
Focus on "Confirmed Extremes" alerts for quality
Enable wave events for comprehensive context
Test alerts on historical data first
Set up multiple notification methods
Risk Management Framework
Strength-Based Position Sizing
Strength 90-100 : Maximum position size (3-5% risk)
Strength 75-89 : Large position size (2-3% risk)
Strength 60-74 : Standard position size (1-2% risk)
Strength 45-59 : Small position size (0.5-1% risk)
Below 45 : Avoid or minimal size (0.25% risk maximum)
Stop Loss Guidelines
Primary Method : Always use validated pivot levels for stops
Buffer Method : Add small buffer beyond validation level
Multiple Timeframe : Consider higher timeframe validated levels
Wave Event Context : Adjust stops based on event confluence
Risk-Reward Optimization
Minimum R:R : 1.5:1 for all trades
Preferred R:R : 2:1 or better for strength above 70
Exceptional Setups : 3:1+ for strength above 85
Position Management : Take 75% at TP1, 50% of remaining at TP2, close remaining at TP3
Stop Management : Move stop to breakeven after TP1 execution
Best Practices
Signal Quality Assessment
Always wait for validated pivots with ✓ checkmarks displayed on chart
Prioritize strength ratings above 60 for trade quality
Focus on the validated high/low levels rather than underlying calculations
Consider HH/HL/LH/LL structure labels for directional bias
Use ZigZag line connections to understand market structure flow
Entry Timing Optimization
Enter on validation bar or immediate pullback to validated level
Use lower timeframes for precise entry refinement around validated levels
Wait for strength score calculation completion before entry
Monitor price action around validated highs and lows
Consider multiple timeframe validated level alignment
Exit Strategy Management
Use opposite validated pivots displayed on chart as primary targets
Execute Fundur 3-stage exit: 75% at TP1, 12.5% at TP2, 12.5% at TP3
Move stop loss to breakeven immediately after TP1 execution
Monitor strength ratings of new validated levels that could reverse remaining position
Watch for structure changes (trend breaks) via HH/HL/LH/LL labels for early exit consideration
Common Mistakes to Avoid
Signal Interpretation Errors
Don't trade potential turns without ✓ validation markers
Never ignore strength ratings below 45 - they indicate weak signals
Don't chase signals after significant movement away from validated levels
Avoid overriding clear ZigZag structure and trend context
Don't ignore the relationship between consecutive validated highs and lows
Risk Management Failures
Never risk more than the strength score suggests for position sizing
Don't move stops against validated levels - they represent key structure
Avoid oversizing on "sure thing" setups - even high-strength signals can fail
Don't ignore multiple timeframe validated level context
Never trade without clear invalidation levels (validated highs/lows for stops)
System Usage Mistakes
Don't enable all features immediately - start simple
Avoid changing speed settings mid-session
Don't ignore alert system capabilities
Never disable core validation features
Don't overlook customization for your chart setup
Advanced Techniques
Multi-Timeframe ZigZag Analysis
Use higher timeframe validated levels for major bias and targets
Align lower timeframe entries with higher timeframe validated structure
Look for validated level confluence across timeframes
Monitor strength rating consistency of validated levels across periods
Advanced Structure Pattern Recognition
Identify recurring validated level patterns and their outcomes
Recognize high-probability ZigZag structure sequences
Use historical validated level patterns for target projection
Combine ZigZag analysis with other Fundur technical analysis tools
Advanced Alert Utilization
Create custom alert combinations based on strength thresholds
Use validated level break alerts for position management
Combine strength rating filters with validated pivot alerts
Develop systematic responses to different validated level types
Conclusion
The Fundur - Market Sentiment A indicator represents a breakthrough in technical analysis, providing a dynamic ZigZag system that displays validated highs and lows with unprecedented accuracy. By following the methodologies outlined in this guide and adapting the settings to your trading style, you can harness the full power of this sophisticated system for more precise and profitable trading decisions.
The key to success with Market Sentiment A lies in understanding that it is fundamentally a dynamic support and resistance system. Focus on the validated highs and lows displayed on your chart, use the strength ratings to assess signal quality, and leverage the structure analysis for trend context. Start with conservative settings, focus on high-strength signals, and gradually incorporate advanced features as you become familiar with the system's behavior across different market conditions.
Remember that this indicator provides the tools for identification and analysis - successful trading still requires proper risk management, psychological discipline, and continuous learning. Use the strength rating system as your primary guide, respect the validated pivot methodology, and always prioritize capital preservation over profit maximization.

CHoCH + BOS + LQ Sweep v6.3.8 PRO+The CHoCH + BOS + LQ Sweep PRO indicator is a comprehensive Smart Money Concepts (SMC) tool designed to identify market structure shifts, liquidity sweeps, and key supply-demand zones across multiple timeframes. It helps traders visualize crucial price action patterns like Change of Character (CHoCH), Break of Structure (BOS), and liquidity grabs that often precede significant market reversals or continuations.
This tool is especially suited for traders applying multi-timeframe analysis and liquidity-based trading strategies on Forex, crypto, indices, or commodities.
1. Liquidity Sweeps (LQ Sweeps)
Identifies when price sweeps previous highs/lows (stop hunts/liquidity grabs).
Configurable strength setting to filter minor vs. major sweeps.
Optional stop at wick or stop at close logic for more precise entries.
Old sweeps can be displayed or hidden, with user-defined limits for historical sweeps.
2. Multi-Timeframe (HTF) Sweeps
Displays liquidity sweeps from higher timeframes (M15, H1, H4, D1, W1).
Individual checkboxes allow flexible combinations (e.g., show only H1 & H4 sweeps).
Unique colors for each timeframe to differentiate visually on the chart.
3. Supply/Demand Zones
Automatically plots zones around swing highs and lows.
Zones are dynamically updated and locked once price interacts with them.
Configurable view: Show both bullish/bearish zones or filter for one side only.
Option to display/hide old zones and limit the number of zones shown.
4. Historical Sweep Management
Stores up to 5000 sweeps internally, while adhering to TradingView’s rendering limits (max 500 drawn).
Ensures chart clarity by prioritizing the most recent sweeps.

Market Shift Levels [ChartPrime]Market Shift Levels
This indicator detects trend shifts and visualizes key market structure turning points using Hull Moving Average logic. It highlights potential areas of support and resistance where price is likely to react, empowering traders to spot early trend transitions.
Market Shift Levels are horizontal zones that mark the moment of a directional change in market behavior. These shifts are based on crossovers between two smoothed Hull Moving Averages (HMA), allowing the indicator to detect potential reversals with minimal lag.
Once a shift is detected:
A dashed horizontal Market Shift Level is plotted at the low (for bullish shift) or high (for bearish shift) of the candle.
These levels often become key reaction points during pullbacks and trend retests.
Volume or price labels are added when price wicks into these levels, helping traders gauge the strength of rejection or acceptance.
⯁ KEY FEATURES
Uses HMA-based logic to detect when price momentum shifts.
Plots clean Market Shift Levels (MSLs) that act as dynamic support and resistance.
Automatically colors bars and candles based on the price positioning relative to levels.
Labels wick-based retests with either:
Volume data of the 3-bar cluster (default).
Price level if toggled.
⯁ HOW TO USE
Look for trend shifts where the HMA crossover triggers a new level — this marks a possible structural pivot .
Use the horizontal level as a dynamic support or resistance zone — especially when price returns with wick rejections.
Watch for volume labels near the level — higher values signal stronger rejection and potential continuation.
Combine with confluence tools like Smart Money concepts or Fibonacci levels for added edge.
⯁ EXAMPLE SETUPS
After a bullish shift, wait for price to return and wick into the level — if volume spikes and candle closes strong, it’s a retest confirmation entry .
After a bearish shift, bearish wick rejections with volume may signal short re-entry zones .
⯁ CONCLUSION
The Market Shift Levels indicator offers a visual and data-backed approach to spotting trend reversals and critical retest zones. It’s a simple yet powerful tool to structure your trades around objective, repeatable market behavior — all in real-time.

OPR Asia-New-York [Elykia]This Pine Script indicator, called "OPR Asia-New-York ", displays time-based boxes corresponding to two specific trading periods known as OPR (Opening Price Range):
🎯 Purpose of the Indicator:
To visualize two key market time windows (morning and afternoon) as extended boxes, helping with technical analysis around opening ranges.
🕒 Two sessions displayed as boxes:
🔹 Morning OPR:
Default: from 09:00 to 09:15 (configurable)
The box extends until 10:30.
It captures the highest and lowest candle within this interval.
🔸 Afternoon OPR:
Default: from 15:30 to 15:45
The box extends until 17:30.
Follows the same logic as the morning session.
⚙️ Dashboard Options:
Enable or disable the morning or afternoon box individually
Select the timezone (e.g., GMT+2)
Customize all colors (morning/afternoon boxes, median line)
Set your own start/end/extension times for each session
📦 Each box includes:
A colored rectangle showing the price range (high/low)
A dotted median line between the high and low
The box and line extend until the end time defined
🧠 Usefulness for Traders:
Identify liquidity zones or consolidation areas
Trade setups like liquidity grabs, breakouts, or fakeouts around the OPR
Align with ICT methods or scalping strategies based on session behavior

Morning Structure – Live 30 Min Range📝 Description:
This indicator captures the morning price structure by tracking the high and low during the first 30 minutes after market open (default: 9:30 AM to 10:00 AM, New York time).
🔧 How it works:
At market open, it begins tracking the highest high and lowest low
The high and low lines are dynamic and update in real-time during the first 30 minutes
Once the 30-minute range completes, the lines freeze at their final values
Lines extend horizontally across the rest of the session to mark the "Morning Range"
✅ Key Features:
Tracks live price action during the morning session
Freezes the structure after 30 minutes (or user-defined)
Automatically resets each new trading day
Built-in timezone setting (America/New_York) to align with standard U.S. market hours
Clean visual lines that scroll naturally with the chart
⚙️ Use Cases:
Identify morning breakout zones
Define support and resistance early in the session
Combine with breakout, fade, or range-trading strategies
⚠️ Note:
This version does not include alerts or labels, by design (clean and focused).
Those can be added easily for custom strategies.

Correlation MA – 15 Assets + Average (Optional)This indicator calculates the moving average of the correlation coefficient between your charted asset and up to 15 user-selected symbols. It helps identify uncorrelated or inversely correlated assets for diversification, pair trading, or hedging.
Features:
✅ Compare your current chart against up to 15 assets
✅ Toggle assets on/off individually
✅ Custom correlation and MA lengths
✅ Real-time average correlation line across enabled assets
✅ Horizontal lines at +1, 0, and -1 for easy visual reference
Ideal for:
Portfolio diversification analysis
Finding low-correlation stocks
Mean-reversion & pair trading setups
Crypto, equities, ETFs
To use: set the benchmark chart (e.g. TSLA), choose up to 15 assets, and adjust settings as needed. Look for assets with correlation near 0 or negative values for uncorrelated performance.

FVG Candle HighlighterThis indicator highlights only the true Fair Value Gap (FVG) creator candle — the middle candle in a 3-bar FVG formation — with zero clutter.
🔹 Bullish FVG: Candle is colored if price gaps above the high two bars back
🔹 Bearish FVG: Candle is colored if price gaps below the low two bars back
✨ No boxes. No zones. Just pure, visual price-action accuracy.
🔧 Powered by Pine Script v6
🧠 Based on institutional-style FVG logic
🎯 Ideal for Smart Money / ICT / Order Block strategies

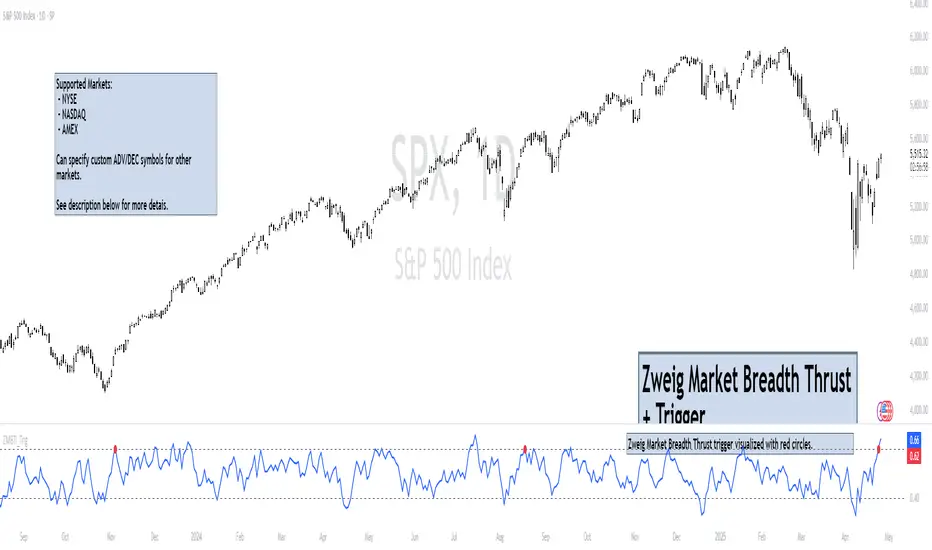
Zweig Market Breadth Thrust Indicator+Trigger [LazyBear x rwak]The Breadth Thrust (BT) indicator is a market momentum indicator developed by Dr. Martin Zweig. According to Dr. Zweig, a Breadth Thrust occurs when, during a 10-day period, the Breadth Thrust indicator rises from below 40 percent to above 61.5 percent.
A "Thrust" indicates that the stock market has rapidly changed from an oversold condition to one of strength, but has not yet become overbought. This is very rare and has happened only a few times. Dr. Zweig also points out that most bull markets begin with a Breadth Thrust.
This version of the Breadth Thrust indicator includes a trigger visualized with red circles, making it easier to spot when the indicator crosses the critical 61.5% level, signaling potential bullish momentum.
All parameters are configurable. You can draw BT for NYSE, NASDAQ, AMEX, or based on combined data (i.e., AMEX+NYSE+NASD). There is also a "CUSTOM" mode supported, so you can enter your own ADV/DEC symbols.
Credit: The original Breadth Thrust logic was created by LazyBear, whose public indicators can be found here , and app-store indicators here .
More info:
Definition of Breadth Thrust
A Breadth Thrust Signal
A Rare "Zweig" Buy Signal
Zweig Breadth Thrust: Redux
Custom Performance TableThis script generates a table designed to provide a concise yet highly customizable overview of the performance of multiple financial instruments, displayed directly on the chart. The table can include up to 40 tickers, each individually configurable, with values updated in real time based on either the current chart timeframe or a specific user-selected timeframe.
NOTE : The update frequency of the table values depends on the refresh rate of the chart's main ticker to which the indicator is applied. To ensure a consistent and reliable data feed, especially when monitoring heterogeneous instruments, it is recommended to apply the indicator to a highly liquid and continuously traded asset, such as BTCUSD.
PERFORMANCE CALCULATION MODES
You can choose from three different performance calculation modes:
1) Change % (Percentage Change)
Displays the percentage change of the current price compared to the previous candle within the selected timeframe.
(Current Price - Previous Price) / Previous Price * 100
This mode provides an immediate and straightforward measure of each instrument's percentage movement, useful for quick visual comparisons of relative strength among assets.
2) Z-Score
The Z-Score measures how much the current price variation deviates from the historical average variation, relative to the standard deviation of those variations.
(Current Variation - Average Variation) / Standard Deviation of Variations
The result indicates how statistically unusual a movement is:
- Values near 0 suggest normal variations.
- Values above ±2 indicate statistically significant deviations.
This is a valuable tool for identifying overbought/oversold conditions or market stress events and is often used in mean reversion strategies.
NOTE : Due to technical constraints, Z-Score can only be calculated when the selected timeframe matches the chart's timeframe exactly.
3) RAROC (Risk-Adjusted Return on Capital)
RAROC expresses an asset's performance in relation to the risk taken, measured through its volatility (standard deviation of price).
Percentage Change / Standard Deviation of Price
It allows for an assessment of return efficiency in relation to volatility.
A high RAROC value indicates a high return relative to the risk, making it a useful tool for comparing assets with different risk profiles. It is especially suitable for portfolio selection and allocation purposes.
TABLE CONFIGURATION
Each ticker can be customized with its own label, colors, and position in the table.
Each row can display the ticker name or a custom label, which, at the user's discretion, can either replace the name or be shown as an informational tooltip.
The table can be placed anywhere on the chart using horizontal and vertical offset parameters. Thanks to offset support, you can, for example, create financial market overview layouts. This can be done by completely “cleaning” the chart from price and indicators using TradingView settings, and then displaying multiple tables simultaneously (see the example chart published here).
Advanced customization options are also available for the table's appearance, including font settings, colors, borders, and more.
CALCULATION TIMEFRAME
The indicator allows the user to force a specific timeframe (Daily, Weekly, Monthly, Yearly) when applied to intraday charts.
However, for Z-Score mode, the selected timeframe must match the chart's timeframe exactly to ensure correct computation. Otherwise, the script will halt until settings are properly adjusted.
USAGE NOTES
Custom Performance Table is a flexible and adaptable tool, suitable for both intraday operations and medium- to long-term analysis. It is designed for traders and analysts who need to compare assets based on quantitative metrics, whether simple (like percentage change) or more advanced and risk-adjusted (such as Z-Score and RAROC).

RiskCalc FX & GoldRiskCalc FX & Gold is a multi-market position sizing tool designed to help you manage risk quickly and accurately. With this script, simply enter your account capital, the percentage of risk you wish to take, and your stop in ticks. Depending on the selected market—Forex or XAUUSD—the script automatically adjusts its calculations:
Forex: Assumes 1 lot equals 100,000 units.
XAUUSD: Assumes 1 lot equals 100 ounces.
The script calculates your risk in dollars and, using a fixed value of 1 USD per tick per lot, determines the ideal position size in both lots and total contracts. Results are displayed in a clear, centralized table at the top of the chart for real-time decision-making.
Perfect for traders operating across multiple markets who need an automated and consistent approach to risk management.

Opal Title: Opal Lines
Short Title: Opal Lines
Description:
Opal Lines is a dynamic overlay indicator that plots horizontal price levels at the open of key market sessions throughout the trading day, based on Eastern Time (ET). Designed for traders who rely on session-based price action, it marks significant intraday events such as the European Open (3:00 AM ET), Gold Open (8:20 AM ET), Regular Market Open (9:30 AM ET), and Globex Open (6:00 PM ET), among others. Each line is color-coded and toggleable via inputs, allowing users to customize which sessions they want to track.
Unlike generic time-based tools, Opal Lines captures the opening price at precise minute intervals and extends these levels across the chart until the daily reset at 5:00 PM ET (except for the Globex line, which persists into the next day). This makes it ideal for identifying support/resistance zones, breakout levels, or reference points tied to major market openings. Traders can use it across forex, futures, equities, or commodities to align their strategies with global session dynamics.
Key Features:
Seven toggleable session lines with distinct colors for easy identification.
Time-specific logic using ET, adaptable to any chart timeframe.
Persistent lines that reset daily, with Globex extending overnight.
Lightweight and overlay-friendly, preserving chart clarity.
How to Use:
Add the indicator to your chart and enable the sessions relevant to your trading style. Watch for price interactions with these levels—e.g., bounces, breaks, or retests—especially during high-volume periods. Combine with other tools like volume or oscillators for confirmation.
Note: Ensure your chart’s timezone is set to “America/New_York” (ET) for accurate alignment.

MTF Fractals [RunRox]🔽 MTF Fractals is a powerful indicator designed to visualize fractals from multiple timeframes directly on your chart, highlight liquidity sweeps at these fractal levels, and provide several additional features we’ll cover in detail below.
We created this indicator because we couldn’t find a suitable tool that met our specific needs on TradingView. Therefore, we decided to develop a valuable indicator for the entire TradingView community, combining simplicity and versatility.
⁉️ WHAT IS A FRACTALS?
In trading, a fractal is a technical analysis pattern composed of five consecutive candles, typically highlighting local market turning points. Specifically, a fractal high is formed when a candle’s high is higher than the highs of the two candles on either side, whereas a fractal low occurs when a candle’s low is lower than the lows of the two adjacent candles on both sides.
Traders use fractals as reference points for identifying significant support and resistance levels, potential reversal areas, and liquidity zones within price action analysis. Below is a screenshot illustrating clearly formed fractals on the chart.
📙 FRACTAL FORMATION
Here’s how fractals form depending on your chosen setting (3, 5, 7, or 9):
▶️ 3-bar fractal – forms when the central candle is higher (for highs) or lower (for lows) than one candle on each side.
▶️ 5-bar fractal – forms when the central candle is higher or lower than two candles on both sides.
▶️ 7-bar fractal – forms when the central candle is higher or lower compared to the three candles on each side.
▶️ 9-bar fractal – forms similarly but requires four candles on each side, making the fractal significantly more reliable and robust.
A higher number of bars ensures stronger fractal levels, highlighting more significant potential reversal points on the chart.
Now that we’ve covered the theory behind fractal formation, let’s explore the indicator’s functionality in more detail.
Below, I’ll explain each feature clearly and illustrate how you can effectively utilize this indicator in your trading.
🕐 MULTI-TIMEFRAME FRACTALS
We realized that displaying fractals only from the current timeframe isn’t always convenient, so we’ve introduced Multi-Timeframe Fractals into this indicator.
Now you can easily display fractals from higher timeframes directly on your current chart, providing you with broader market context and clearer trading signals.
Fractals from Current Timeframe – Fractals identified directly on the chart’s current timeframe.
Fractals from Higher Timeframes – Fractals sourced from higher timeframes and displayed clearly on your current chart for enhanced market perspective.
📈 FRACTAL LINES
Since fractals represent areas of high liquidity, we’ve added an option to extend fractal levels horizontally as Fractal Lines across your chart.
This feature allows you to clearly visualize critical liquidity areas from higher timeframes, directly on your current timeframe chart, as demonstrated in the screenshot below.
With this approach, you can clearly visualize significant fractal levels from higher timeframes directly on your current chart - for example, projecting fractals from the 1-hour (1H) timeframe onto a 3-minute (3m) chart. ✅ This helps you easily identify critical liquidity areas and potential reversal zones without the need to switch between multiple timeframes.
💰 LIQUDITY SWEEP (LIQUDITY GRAB)
To enhance your trading experience, we’ve introduced a feature that clearly identifies liquidity sweeps of fractal levels.
A Liquidity Sweep occurs when a candle closes beyond a fractal line, leaving a wick that pierces through it, signaling that liquidity has been collected at this level.
Below, you’ll find two examples illustrating this functionality:
▶️ Fractal lines from the current timeframe
▶️ Fractal lines projected from higher timeframes
The first example illustrates liquidity being swept from fractals on the current timeframe .
Here, the candle clearly closes beyond the fractal line, leaving a wick through it. This indicates a liquidity sweep at the fractal level, visually highlighting a potential reversal or continuation opportunity directly on your chart.
In the second example, fractals from the higher timeframe are projected onto your current chart.
When a candle on your current timeframe closes beyond an HTF fractal line - leaving a wick through this level - the indicator highlights it clearly. This signals to traders a potential reversal zone, indicating that liquidity has been swept, and price may reverse or significantly react from this area.
You can also enable the display of additional labels on the chart. These labels clearly mark liquidity sweeps at fractal levels, making it easier to visually identify potential reversal points directly on your chart.
⚙️ SETTINGS
Below are the indicator settings with detailed explanations for each parameter.
🔷 Bars in Fractal – Number of candles to the right and left required to form a fractal.
🔷 Fractal Timeframe – Select the timeframe from which you want to display fractals on the current chart.
🔷 Max Age, bars – Number of bars during which the fractal will remain active.
🔷 Show Fractal Line – Display or hide fractal lines.
🔷 Line Style – Choose the style of the line displayed on the chart.
🔷 Line Width – Thickness of the fractal line.
🔷 High Fractal – Style and color of bearish fractals.
🔷 Low Fractal – Style and color of bullish fractals.
🔷 Fractal Label Size – Select the size of fractal labels.
🔷 Show Sweep Labels – Option to display labels when a liquidity sweep occurs.
🔷 Label Color – Color and transparency of the area marked on the chart during a sweep.
🔷 Shade Sweep Area – Show or hide the sweep area shading.
🔷 Area Color – Color and transparency settings for the sweep area.
🔶 We’d love to hear your feedback and any suggestions for additional features you’d like to see in this indicator. We’ll be happy to consider your ideas and continue improving the indicator!

Gabriel's Global Market CapGabriel's Global Market Cap is a comprehensive financial indicator designed to track and analyze the total market capitalization across multiple asset classes. It incorporates various financial markets, including stocks, bonds, real estate, cryptocurrencies, commodities, derivatives, private equity, insurance, OTC markets, and natural resources, to provide a holistic view of global market dynamics.
This indicator integrates Ehlers' Adaptive Dominant Cycle Detection and a custom VIX formula to adjust market values based on volatility and volume fluctuations, allowing for a more refined understanding of market conditions.
Key Features
✅ Multi-Market Analysis – Tracks 10+ global financial sectors, each represented by a key ETF or index.
✅ Normalization & Readability – Converts market cap values into an easy-to-read format (Millions, Billions, Trillions, Quadrillions).
✅ Volatility & Volume Adjustments – Optional VIX-based smoothing and relative volume adjustment for more dynamic readings.
✅ Ehlers’ Cycle Detection – Utilizes dominant cycle length detection to uncover market rhythms and cyclic behavior.
✅ Risk Thresholds & Background Coloring – Identifies overbought and oversold conditions with cyclic bands and background shading.
✅ Customizable Inputs – Users can toggle different market categories on/off for focused analysis.
✅ Interactive Data Table – Displays real-time values for each asset class in a structured table format.
Market Categories & Data Sources
📈 Global Stock Market – iShares MSCI ACWI ETF (ACWI)
💰 Global Bond Market – Vanguard Total World Bond ETF (BNDW)
🏡 Real Estate Market – iShares Global REIT ETF (REET)
₿ Cryptocurrency Market – Total Crypto Market Cap (CRYPTOCAP:TOTAL)
🌾 Commodities Market – Invesco DB Commodity Index Fund (DBC)
📊 Derivatives Market – CME Group (CME)
🏦 Private Equity & VC – ProShares Global Listed Private Equity ETF (PEX)
🛡️ Insurance Market – SPDR S&P Insurance ETF (KIE)
💹 OTC Markets – OTC Markets Group (OTCM)
⛽ Natural Resources – iShares Global Energy ETF (IXC)
Technical Enhancements
1️⃣ Custom Volatility Index (VIX) Calculation (Work In Progress)
Adjusts asset values based on volatility conditions using Ehlers' Cycle Detection.
Higher VIX reduces market cap, while lower VIX stabilizes it.
2️⃣ Adaptive Market Normalization
Converts absolute market values into a relative strength scale (0-100) for better visual analysis.
Uses historical min/max values to adjust dynamically.
3️⃣ Cyclic Analysis & Overbought/Oversold Levels
Detects hidden market rhythms & time cycles.
Calculates upper and lower risk bands based on dominant cycle length.
Applies background shading for visualizing low or high risk periods.
Customization Options
🔧 Enable/Disable Market Categories – Select which asset classes to track.
📊 Toggle VIX & Volume Smoothing – Adjust how market cap reacts to volatility & volume.
🎨 Cyclic Risk Bands – Highlight overbought/oversold conditions with dynamic background colors.
Visual Elements
📉 Market Cap Trends – Each category is plotted with a unique color.
🌎 Total Global Value (TGV) – A combined index representing all selected markets.
🎨 Background Coloring – Indicates high/low risk periods.
📋 Real-Time Data Table – Displays normalized & raw market cap values in an easy-to-read format.
Practical Applications
📊 Macroeconomic Analysis – Track global liquidity and investment shifts across asset classes.
💹 Volatility & Risk Assessment – Identify high-risk market conditions based on cyclic behavior.
📈 Cross-Market Comparisons – See which sectors are leading or lagging in value growth.
🔍 Crypto & Stock Market Trends – Analyze how traditional and digital assets correlate.

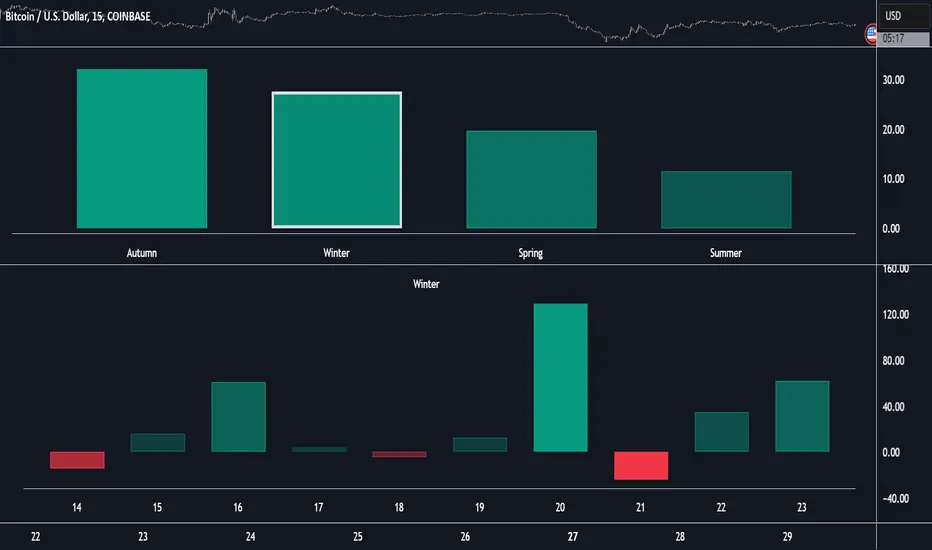
Market Performance by Yearly Seasons [LuxAlgo]The Market Performance by Yearly Seasons tool allows traders to analyze the average returns of the four seasons of the year and the raw returns of each separate season.
🔶 USAGE
By default, the tool displays the average returns for each season over the last 10 years in the form of bars, with the current session highlighted as a bordered bar.
Traders can choose to display the raw returns by year for each season separately and select the maximum number of seasons (years) to display.
🔹 Hemispheres
Traders can select the hemisphere in which they prefer to view the data.
🔹 Season Types
Traders can select the type of seasons between meteorological (by default) and astronomical.
The meteorological seasons are as follows:
Autumn: months from September to November
Winter: months from December to February
Spring: months from March to May
Summer: months from June to August
The astronomical seasons are as follows:
Autumn: from the equinox on September 22
Winter: from the solstice on December 21
Spring: from the equinox on March 20
Summer: from the solstice on June 21
🔹 Displaying the data
Traders can choose between two display modes, average returns by season or raw returns by season and year.
🔶 SETTINGS
Max seasons: Maximum number of seasons
Hemisphere: Select NORTHERN or SOUTHERN hemisphere
Season Type: Select the type of season - ASTRONOMICAL or METEOROLOGICAL
Display: Select display mode, all four seasons, or any one of them
🔹 Style
Bar Size & Autofit: Select the size of the bars and enable/disable the autofit feature
Labels Size: Select the label size
Colors & Gradient: Select the default color for bullish and bearish returns and enable/disable the gradient feature
Comprehensive Volume and Metrics with Pre-Market Volume Data
This script is designed for traders who want a detailed view of market activity, including regular market and pre-market volume, dollar volume, relative volume (RVOL), average daily range (ADR), average true range (ATR), relative strength index (RSI), and the QQQ’s percentage change.
The script includes customizable metrics displayed in tables on the chart for easy analysis, with the option to toggle the visibility of each metric.
Key Features:
Volume and Dollar Volume:
Displays the volume of shares traded during the current day (or pre-market, if enabled).
Includes a calculation of dollar volume, representing the total dollar amount of trades (Volume × Close Price).
Relative Volume (RVOL):
Displays RVOL Day, which is the relative volume of the current day compared to the 2-day moving average.
Shows RVOL 90D, indicating relative volume over the past 90 days.
Both RVOL metrics are calculated as percentages and display the percentage change compared to the standard (100%).
Pre-Market Data:
Includes pre-market volume (PVOL) and pre-market dollar volume (P$ VOL) which are displayed only if pre-market data is enabled.
Tracks volume and dollar volume during pre-market hours (4:00 AM to 9:30 AM Eastern Time) for more in-depth analysis.
Optionally, shows pre-market RSI based on volume-weighted close prices.
Average Daily Range (ADR):
Displays the percentage change between the highest and lowest prices over the defined ADR period (default is 20 days).
Average True Range (ATR):
Shows the ATR, a popular volatility indicator, for a given period (default is 14 bars).
RSI (Relative Strength Index):
Displays RSI for the given period (default is 14).
RSI is calculated using pre-market data when available.
QQQ:
Shows the percentage change of the QQQ ETF from the previous day’s close.
The QQQ percentage change is color-coded: green for positive, red for negative, and gray for no change.
Customizable Inputs:
Visibility Options: Toggle the visibility of each metric, such as volume, dollar volume, RVOL, ADR, ATR, RSI, and QQQ.
Pre-Market Data: Enable or disable the display of pre-market data for volume and dollar volume.
Table Positioning: Adjust the position of tables displaying the metrics either at the bottom-left or bottom-right of the chart.
Text Color and Table Background: Choose between white or black text for the tables and customize the background color.
Tables:
The script utilizes tables to display multiple metrics in an organized and easy-to-read format.
The values are updated dynamically, reflecting real-time data as the market moves.
Pre-Market Data:
The script calculates pre-market volume and dollar volume, along with other key metrics like RSI and RVOL, to help assess market sentiment before the market officially opens.
The pre-market data is accumulated from 4:00 AM to 9:30 AM ET, allowing for pre-market analysis and comparison to regular market hours.
User-Friendly and Flexible:
This script is designed to be highly customizable, giving you the ability to toggle which metrics to display and where they appear on the chart. You can easily focus on the data that matters most to your trading strategy.

Relative Performance Indicator by ComLucro - 2025_V01The "Relative Performance Indicator by ComLucro - 2025_V01" is a powerful tool designed to analyze an asset's performance relative to a benchmark index over multiple timeframes. This indicator provides traders with a clear view of how their chosen asset compares to a market index in short, medium, and long-term periods.
Key Features:
Customizable Lookback Periods: Analyze performance across three adjustable periods (default: 20, 50, and 200 bars).
Relative Performance Analysis: Calculate and visualize the difference in percentage performance between the asset and the benchmark index.
Dynamic Summary Label: Displays a detailed breakdown of the asset's and index's performance for the latest bar.
User-Friendly Interface: Includes customizable colors and display options for clear visualization.
How It Works:
The script fetches closing prices of both the asset and a benchmark index.
It calculates percentage changes over the selected lookback periods.
The indicator then computes the relative performance difference between the asset and the index, plotting it on the chart for easy trend analysis.
Who Is This For?:
Traders and investors who want to compare an asset’s performance against a benchmark index.
Those looking to identify trends and deviations between an asset and the broader market.
Disclaimer:
This tool is for educational purposes only and does not constitute financial or trading advice. Always use it alongside proper risk management strategies and backtest thoroughly before applying it to live trading.
Chart Recommendation:
Use this script on clean charts for better clarity. Combine it with other technical indicators like moving averages or trendlines to enhance your analysis. Ensure you adjust the lookback periods to match your trading style and the timeframe of your analysis.
Additional Notes:
For optimal performance, ensure the benchmark index's data is available on your TradingView subscription. The script uses fallback mechanisms to avoid interruptions when index data is unavailable. Always validate the settings and test them to suit your trading strategy.

Confirmed market structure buy/sell indicatorOverview
The Swing Point Breakout Indicator with Multi-Timeframe Dashboard is a TradingView tool designed to identify potential buy and sell signals based on swing point breakouts on the primary chart's timeframe while simultaneously providing a snapshot of the market structure across multiple higher timeframes. This dual approach helps traders make informed decisions by aligning short-term signals with broader market trends.
Key Features
Swing Point Breakout Detection
Swing Highs and Lows: Identifies significant peaks and troughs based on a user-defined lookback period.
Breakout Signals:
Bullish Breakout (Buy Signal): Triggered when the price closes above the latest swing high.
Bearish Breakout (Sell Signal): Triggered when the price closes below the latest swing low.
Visual Indicators: Highlights breakout bars with colors (lime for bullish, red for bearish) and plots buy/sell markers on the chart.
Multi-Timeframe Dashboard
Timeframes Monitored: 1m, 5m, 15m, 1h, 4h, 1D, and 1W.
Market Structure Status:
Bullish: Indicates upward market structure.
Bearish: Indicates downward market structure.
Neutral: No clear trend.
Visual Table: Displays each timeframe with its current status, color-coded for quick reference (green for bullish, red for bearish, gray for neutral).
Operational Workflow
Initialization:
Sets up a dashboard table on the chart's top-right corner with headers "Timeframe" and "Status".
Swing Point Detection:
Continuously scans the main timeframe for swing highs and lows using the specified lookback period.
Updates the latest swing high and low levels.
Signal Generation:
Detects when the price breaks above the last swing high (bullish) or below the last swing low (bearish).
Activates potential buy/sell setups and confirms signals based on subsequent price movements.
Dashboard Update:
For each defined higher timeframe, assesses the market structure by checking for breakouts of swing points.
Updates the dashboard with the current status for each timeframe, aiding in trend confirmation.
Visualization:
Colors the bars where breakouts occur.
Plots buy and sell signals directly on the chart for easy identification.

Dynamic Market Correlation Analyzer (DMCA) v1.0Description
The Dynamic Market Correlation Analyzer (DMCA) is an advanced TradingView indicator designed to provide real-time correlation analysis between multiple assets. It offers a comprehensive view of market relationships through correlation coefficients, technical indicators, and visual representations.
Key Features
- Multi-asset correlation tracking (up to 5 symbols)
- Dynamic correlation strength categorization
- Integrated technical indicators (RSI, MACD, DX)
- Customizable visualization options
- Real-time price change monitoring
- Flexible timeframe selection
## Use Cases
1. **Portfolio Diversification**
- Identify highly correlated assets to avoid concentration risk
- Find negatively correlated assets for hedging strategies
- Monitor correlation changes during market events
2. Pairs Trading
- Detect correlation breakdowns for potential trading opportunities
- Track correlation strength for pair selection
- Monitor technical indicators for trade timing
3. Risk Management
- Assess portfolio correlation risk in real-time
- Monitor correlation shifts during market stress
- Identify potential portfolio vulnerabilities
4. **Market Analysis**
- Study sector relationships and rotations
- Analyze cross-asset correlations (e.g., stocks vs. commodities)
- Track market regime changes through correlation patterns
Components
Input Parameters
- **Timeframe**: Custom timeframe selection for analysis
- **Length**: Correlation calculation period (default: 20)
- **Source**: Price data source selection
- **Symbol Selection**: Up to 5 customizable symbols
- **Display Options**: Table position, text color, and size settings
Technical Indicators
1. **Correlation Coefficient**
- Range: -1 to +1
- Strength categories: Strong/Moderate/Weak (Positive/Negative)
2. **RSI (Relative Strength Index)**
- 14-period default setting
- Momentum comparison across assets
3. **MACD (Moving Average Convergence Divergence)**
- Standard settings (12, 26, 9)
- Trend direction indicator
4. **DX (Directional Index)**
- Trend strength measurement
- Based on DMI calculations
Visual Components
1. **Correlation Table**
- Symbol identifiers
- Correlation coefficients
- Correlation strength descriptions
- Price change percentages
- Technical indicator values
2. **Correlation Plot**
- Real-time correlation visualization
- Multiple correlation lines
- Reference levels at -1, 0, and +1
- Color-coded for easy identification
Installation and Setup
1. Load the indicator on TradingView
2. Configure desired symbols (up to 5)
3. Adjust timeframe and calculation length
4. Customize display settings
5. Enable/disable desired components (table, plot, RSI)
Best Practices
1. **Symbol Selection**
- Choose related but distinct assets
- Include a mix of asset classes
- Consider market cap and liquidity
2. **Timeframe Selection**
- Match timeframe to trading strategy
- Consider longer timeframes for strategic analysis
- Use shorter timeframes for tactical decisions
3. **Interpretation**
- Monitor correlation changes over time
- Consider multiple timeframes
- Combine with other technical analysis tools
- Account for market conditions and volatility
Performance Notes
- Calculations update in real-time
- Resource usage scales with number of active symbols
- Historical data availability may affect initial calculations
Version History
- v1.0: Initial release with core functionality
- Multi-symbol correlation analysis
- Technical indicator integration
- Customizable display options
Future Enhancements (Planned)
- Additional technical indicators
- Advanced correlation algorithms
- Enhanced visualization options
- Custom alert conditions
- Statistical significance testing

Momentum Cloud.V33🌟 Introducing MomentumCloud.V33 🌟
MomentumCloud.V33 is a cutting-edge indicator designed to help traders capture market momentum with clarity and precision. This versatile tool combines moving averages, directional movement indexes (DMI), and volume analysis to provide real-time insights into trend direction and strength. Whether you’re a scalper, day trader, or swing trader, MomentumCloud.V33 adapts to your trading style and timeframe, making it an essential addition to your trading toolkit. 📈💡
🔧 Customizable Parameters:
• Moving Averages: Adjust the periods of the fast (MA1) and slow (MA2) moving averages to fine-tune your trend analysis.
• DMI & ADX: Customize the DMI length and ADX smoothing to focus on strong, actionable trends.
• Volume Multiplier: Modify the cloud thickness based on trading volume, emphasizing trends with significant market participation.
📊 Trend Detection:
• Color-Coded Clouds:
• Green Cloud: Indicates a strong uptrend, suggesting buying opportunities.
• Red Cloud: Indicates a strong downtrend, signaling potential short trades.
• Gray Cloud: Reflects a range-bound market, helping you avoid low-momentum periods.
• Dynamic Volume Integration: The cloud thickness adjusts dynamically with trading volume, highlighting strong trends supported by high market activity.
📈 Strength & Momentum Analysis:
• Strength Filtering: The ADX component ensures that only strong trends are highlighted, filtering out market noise and reducing false signals.
• Visual Momentum Gauge: The cloud color and thickness provide a quick visual representation of market momentum, enabling faster decision-making.
🔔 Alerts:
• Custom Alerts: Set up alerts for when the trend shifts or reaches critical levels, keeping you informed without needing to constantly monitor the chart.
🎨 Visual Enhancements:
• Gradient Cloud & Shadows: The indicator features a gradient-filled cloud with shadowed moving averages, enhancing both aesthetics and clarity on your charts.
• Adaptive Visual Cues: MomentumCloud.V33’s color transitions and dynamic thickness provide an intuitive feel for the market’s rhythm.
🚀 Quick Guide to Using MomentumCloud.V33
1. Add the Indicator: Start by adding MomentumCloud.V33 to your chart. Customize the settings such as MA periods, DMI length, and volume multiplier to match your trading style.
2. Analyze the Market: Observe the color-coded cloud and its thickness to gauge market momentum and trend direction. The thicker the cloud, the stronger the trend.
3. Set Alerts: Activate alerts for trend changes or key levels to capture trading opportunities without needing to watch the screen continuously.
⚙️ How It Works:
MomentumCloud.V33 calculates market momentum by combining moving averages, DMI, and volume. The cloud color changes based on the trend direction, while its thickness reflects the strength of the trend as influenced by trading volume. This integrated approach ensures you can quickly identify robust market movements, making it easier to enter and exit trades at optimal points.
Settings Overview:
• Moving Averages: Define the lengths for the fast and slow moving averages.
• DMI & ADX: Adjust the DMI length and ADX smoothing to focus on significant trends.
• Volume Multiplier: Customize the multiplier to control cloud thickness, highlighting volume-driven trends.
📚 How to Use MomentumCloud.V33:
• Trend Identification: The direction and color of the cloud indicate the prevailing trend, while the cloud’s thickness suggests the trend’s strength.
• Trade Execution: Use the green cloud to look for long entries and the red cloud for short positions. The gray cloud advises caution, as it represents a range-bound market.
• Alerts: Leverage the custom alerts to stay on top of market movements and avoid missing critical trading opportunities.
Unleash the power of trend and momentum analysis with MomentumCloud.V33! Happy trading! 📈🚀✨

[DarkTrader] Swing OrderflowSwing Orderflow is a indicator that helps traders detect key swing highs and lows in price action. It is designed to enhance your charting experience by highlighting important support and resistance levels while providing clear visual cues on market structure changes. By tracking swing pivots and price trends, this indicator enables traders to make more informed decisions regarding potential entry and exit points in the market.
This indicator is inspired by @Fractalyst Indicator :
The core functionality of the script revolves around detecting swing highs and lows based on a customizable swing period. It identifies these pivots by comparing price movements over a specific time window, marking the points where price either peaks or bottoms out. Swing highs are plotted as resistance levels when the price breaks above a certain threshold, while swing lows are plotted as support levels when price breaks below it. These key points are represented with dotted lines and labels on the chart for easy reference.
Indicator In Use :
Swing High Calculation
A swing high occurs when the high of a specific bar (or candle) is greater than the highs of the surrounding bars within a defined range (called the swing period).
Function used to find the highest price within a specified range : ta.highest(period)
If the current price is greater than the highest price of this period, it's marked as a potential swing high.
A swing high generally represents a resistance level, where the price has reached a peak before declining.
Swing Low Calculation
A swing low occurs when the low of a specific bar is lower than the lows of the surrounding bars within the swing period.
Function used to find the lowest price within a specified range : ta.lowest(period)
If the current price is lower than this lowest price, it's identified as a swing low.
Swing lows represent support levels, where the price reaches a bottom before bouncing back.
These points are plotted on the chart, and the script also tracks whether price breaks above the swing high or below the swing low to determine trends or possible reversals.
BSL (Buy Side Liquidity)
BSL represents the Buy Side Liquidity, where traders are expected to have their buy orders (usually stop-loss orders for short positions).
When the price reaches a swing high, traders who are short may have stop orders placed above this level. Once these levels are breached, the script identifies this as a liquidity area where stop orders get triggered, causing potential upward price movement.
The script marks the swing high with a "BSL" label and line to indicate this key resistance and liquidity zone.
SSL (Sell Side Liquidity)
SSL refers to the Sell Side Liquidity, where traders place sell orders (usually stop-loss orders for long positions).
Swing lows are important levels where traders holding long positions place their stop orders. When the price drops below a swing low, it triggers these sell orders, causing potential downward price movement.
The script marks the swing low with an "SSL" label and line, signaling this key support and liquidity zone.
In essence, BSL and SSL represent areas where liquidity is pooled, making them critical points in price action. These liquidity areas, when breached, often lead to aggressive price moves, allowing traders to anticipate trends.

Relative Strength (Volatility Adjusted)The volatility adjusted relative strength indicator offers a more precise approach to traditional RS indicators by incorporating volatility adjustments into its calculations. This will provide traders with a more nuanced view of relative performance between a selected instrument and a comparison index.
Identifying Relative Strength (RS) and Weakness (RW) against a benchmark like the SPY is crucial for traders, as it highlights institutional activity in an equity, which retail traders rarely achieve on their own. However, the traditional method of simply comparing the rate of change of a stock to the rate of change for the SPY can be flawed. This method often fails to account for the inherent volatility of each stock, leading to misleading RS/RW readings.
Consider two stocks that both move in response to SPY's movements. If SPY moves significantly more than its average (measured by its ATR), and the stock does the same, traditional RS calculations might show strength when, in fact, the stock is just mirroring SPY's increased volatility. For instance, if SPY typically moves $0.25 an hour but suddenly moves $1, and a stock typically moves $0.50 but moves $2, the stock's apparent RS might be overstated, when in reality there is no relative strength for the stock.
By adjusting for volatility using the ATR (Average True Range), we normalize these movements and get a clearer picture of true RS/RW. For example, if SPY moves 5 times its average rate and a stock moves the same multiple of its own ATR, the RS should be considered neutral rather than strong. Similarly if a stock in absolute terms moves $1 while the SPY also moves $1 but the stock usually moves at twice the rate of the SPY, the stock should be considered relatively weak - not neutral.
Usage
Use this to identify stocks with actual strength or weakness compared to the market.
When the RS line is above 0 and above the moving average it indicates a stock with relative strength that is still gaining more strength.
When the RS line is above 0 but above the moving average it indicates a stock with relative strength that is currently losing strength.
When the RS line is below 0 and below the moving average it indicates a stock with relative weakness that is still losing strength.
When the RS line is below 0 but above the moving average it indicates a stock with relative weakness that is starting to gain back some strength.
