FRAMA (Ehlers true modified calculation)Credit goes to Shizaru for the original calculation. I made just a few fixes, so that the calculation is really that of Ehlers. Fixed H2 and L2 period, fixed w natural logarithmPine Script®指标由nemozny提供已更新 1010663
Kaufman Adaptive Moving Average (day)The KAMA will not change when the interval changes from day to something like 5 minutes or 30 minutes. Allows for more precise trading with the same indicator on a different interval.Pine Script®指标由jacobnie2008提供80
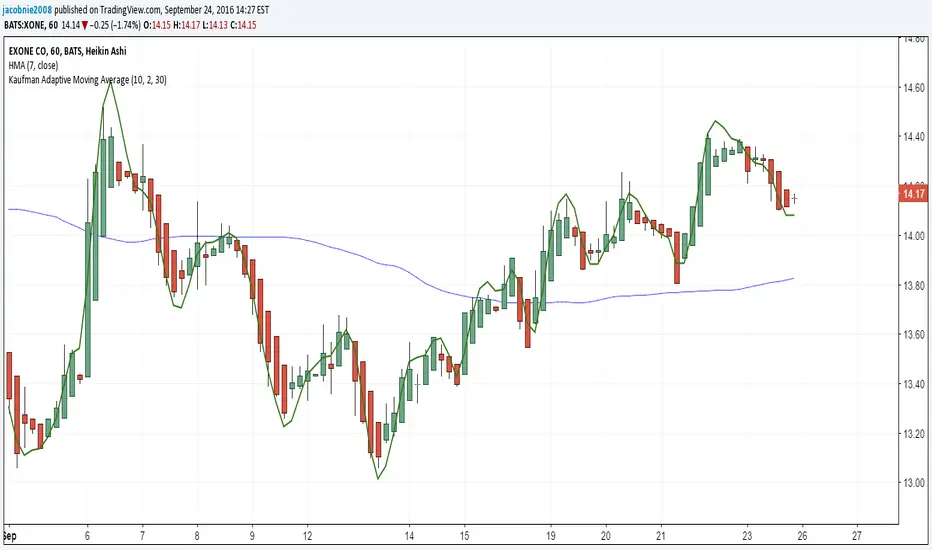
Kaufman Adaptive Moving AverageFrom Stockcharts.com: "Developed by Perry Kaufman, Kaufman's Adaptive Moving Average (KAMA) is a moving average designed to account for market noise or volatility. KAMA will closely follow prices when the price swings are relatively small and the noise is low. KAMA will adjust when the price swings widen and follow prices from a greater distance. This trend-following indicator can be used to identify the overall trend, time turning points and filter price movements." This is different from other users' KAMA's because it allows the user to adjust more parameters that can adjust the indicator in more precise ways without needing to change the source code. Pine Script®指标由jacobnie2008提供11262
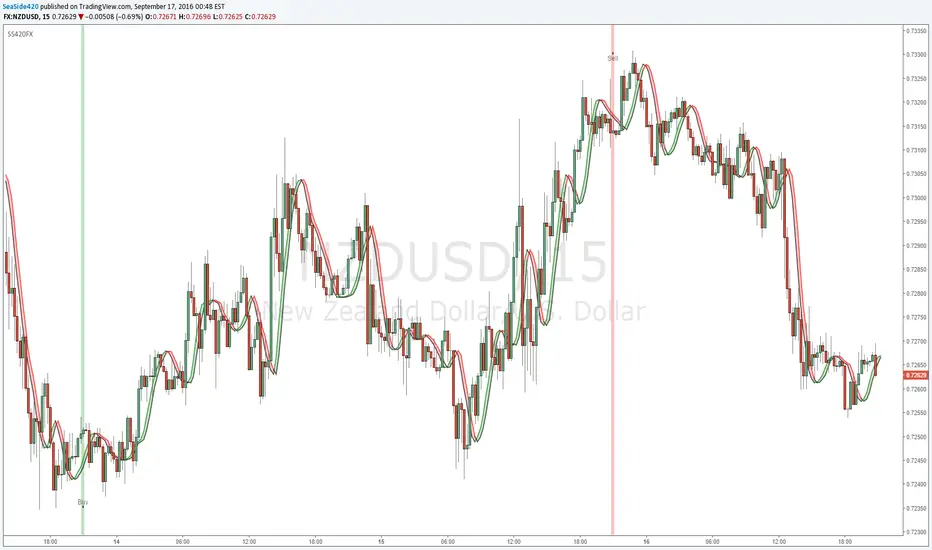
SS420FXTwo Moving_Average cross's & Daily_Candle cross Based on Hull_MA Developed by Alan Hull, it is an indicator, that solves the problem with making a moving average more reactive to current price activity. The Hull Moving Average almost eliminates lag and manages to improve smoothing. The HMA manages to stick to rapid changes in price activity, as it has superior smoothing over a Simple Moving Average of the same period. The HMA employs Weighted Moving Averages (WMA) and dampens the smoothing effect. It can be calculated as follows: HMA(n) = WMA(2*WMA(n/2) – WMA(n)), sqrt(n))Pine Script®指标由SeaSide420提供已更新 33
SS420FXTwo Moving_Average cross's & Daily_Candle cross Based on Hull_MA Developed by Alan Hull, it is an indicator, that solves the problem with making a moving average more reactive to current price activity. The Hull Moving Average almost eliminates lag and manages to improve smoothing. The HMA manages to stick to rapid changes in price activity, as it has superior smoothing over a Simple Moving Average of the same period. The HMA employs Weighted Moving Averages (WMA) and dampens the smoothing effect. It can be calculated as follows: HMA(n) = WMA(2*WMA(n/2) – WMA(n)), sqrt(n))Pine Script®策略由SeaSide420提供已更新 88169
Ichimoku + Daily-Candle_X + HULL-MA_X + MacDIchimoku_cloud + Daily-Candle_cross(DT) + HuLL-MovingAverage_cross + MacD any timeframe, all indicators settings adjustable for fine tuning to pair/timeframe Target Point and Stop Loss settings set SL low to reduce repaint Pine Script®策略由SeaSide420提供已更新 170170 10 K
Triple Guppy CrossGUPPY MULTIPLE ESTIMATED MOVING AVERAGE (EMA) is for Trend Trading. This script uses three sets of crosses to give us an indicator of possible trend reversal. Red cross is the first alert, followed by blue and black. Black cross being the strongest, red cross weakest. More information about Guppy Trading can be found in the link below Pine Script®指标由QuantitativeExhaustion提供22238
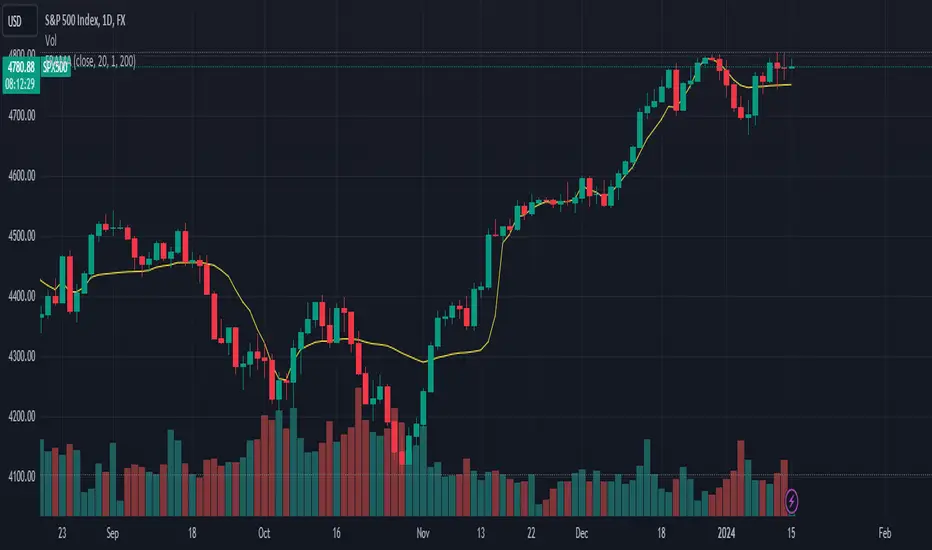
Trend MA 20Simple to use for anyone trading a 20 length moving average. Crossover is signaled once 20 MA crosses 1 MA at close of selected time interval. Pine Script®指标由QuantitativeExhaustion提供11234
WJA double EMASimple indicator with two exponential moving averages and crossover alert. Why didn't this exist already? Pine Script®指标由Wjadevries提供83
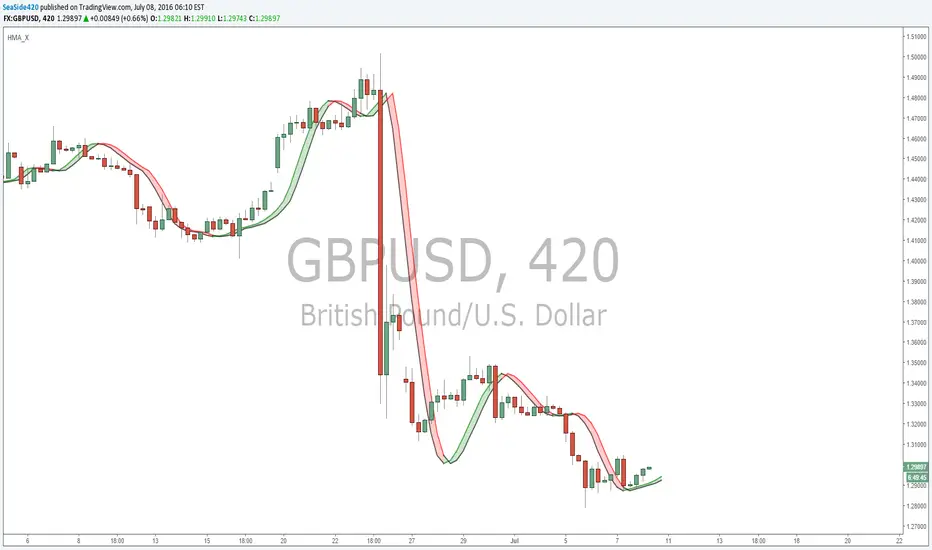
HMA_Xis the Hull Moving Average Cross (simple for Alert friendliness)Pine Script®指标由SeaSide420提供1010467
FRAMA Rate of ChangeFractal Adaptive Moving Average Rate of Change. Use it with FRAMAPine Script®指标由Shizaru提供22424
Chauvenet RadiusThe Chauvenet criterion is a well-known criterion of selection and rejection of the data used by the Physics. It establishes that in an experiment is well to discard the data whose distance from the average is greater than a certain number of the delta. In the stock market if prices move away from the average with a volatility too high are suspect. This principle is embodied in the Chauvenet floor with the definition of two asymptotes and two data areas rejection. The Chauvenet Radius is the quadratic sum of the delta (distance from average) and sigmoid (volatility) and is therefore an obvious market stability index. In fact the moments when price strongly moves away from the average with high volatility coincide with the moments of high instability of the market. It can be considered an evolution of John Bollinger method introduced during the '80. Source: www.performancetrading.itPine Script®指标由Shizaru提供44101
Fractal Dimension Adaptive Moving Average (D-AMA)etfhq.com Overall the D-AMA produced results that were near identical to that of the FRAMA but the D-AMA is a slightly faster average. It is very difficult to pick between the FRAMA and the D-AMA but becuase the FRAMA offers a slightly longer trade duration it the best Moving Average we have tested so far.Pine Script®指标由Shizaru提供22194
Fractal Adaptive Moving Average (real one)Ignore the other one (it contains some errors). On this FRAMA you can play with length, SC and FC. Just read on below links to understand more about this super useful moving average: etfhq.com etfhq.com www.quantshare.com Pine Script®指标由Shizaru提供66 1.1 K
Golden Cross KAMAThe usage is very easy. When the line is green you can open long position, when the line is red you can open short position and when it's black just check by yourself. Usually I use it with RSI and Bollinger Bands , in order to determine when the signal is strong or weak. Just play with fastest and slowest SC to adjust the smoothness.Pine Script®指标由Shizaru提供44313
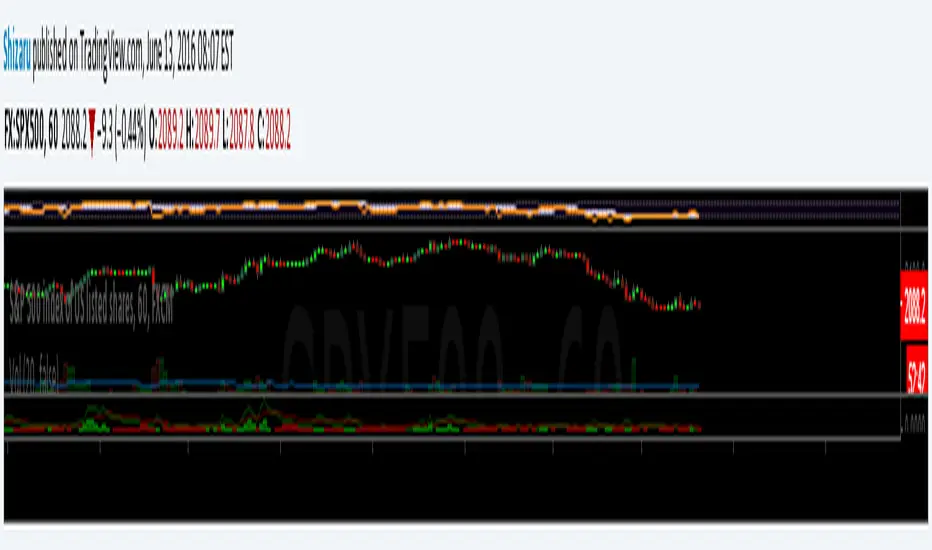
Fractal Adaptive Moving AverageSettings: FRAMA: blue line, SC = 252, FC = 40, length = 252 EMA: orange line, length = 50 FRAMA seems to be the evolution of the current and much-used EMA. The basic strategy is simple: long if the price crosses up the line, short or exit if vice versa. The main difference between EMA and FRAMA is that the first one seems to lag much more than the first one, as we can see from the chart below (crude oil daily chart) FYI etfhq.com quantstrattrader.wordpress.com Pine Script®指标由Shizaru提供88439
Indicator420double hull moving average crossover hull moving average / volume weighted moving average crossover Red dot = SELL Green dot = BUY or Longest MA color change to green = BUY Longest MA color change to red = SELL by SeaSide420Pine Script®指标由SeaSide420提供已更新 33254
4MA StrategyUses 4 Ma cross... Double Hull Moving Averages Volume Weighted Moving Average Weighted Moving Average <<<<< by SeaSide420 >>>>>>Pine Script®策略由SeaSide420提供66 1 K
Double HullMA CrossThe Hull Moving Average (HMA), developed by Alan Hull, is an extremely fast and smooth moving average. In fact, the HMA almost eliminates lag altogether and manages to improve smoothing at the same time. The Hull Moving Average solves the dilemma of making a moving average more responsive to current price activity whilst maintaining curve smoothness. (hoping in less false signals). indicator doubles the input value to make the second HullMA value, then marks the crossoverPine Script®指标由SeaSide420提供已更新 55756
Hausky Simple MA Strategy EURUSD 1HHere is my simple Moving Average crossover strategy for EURUSD 1HPine Script®策略由Hausky提供11111