Engulfing and emaThis is a Pine Script script that helps you see the Engulfing Candlestick and Inside Bar (Boring Candle) candle patterns on the TradingView chart, as well as drawing two Exponential Moving Averages (EMA). Here's a simple explanation:
1. **Candle Pattern**:
- This script identifies the Engulfing Candlestick pattern, which indicates potential changes to the price. If this pattern is detected, the script will show a green (for buy) or red (for sell) arrow above or below that candle.
- The script also identifies the Inside Bar (Boring Candle), which indicates the period area in the market. This candle will be the color you choose (default is orange).
2. **Moving Average (EMA)**:
- This script also plots two Exponential Moving Averages (EMA) on the chart. EMA is a tool that helps you see price trends more clearly.
3. **Risk Management**:
- This script calculates the Stop Loss (SL) and Take Profit (TP) levels for each Engulfing pattern. This helps you manage your trading risks.
- Labels are displayed on the charts for SL and TP, so you know where to place them.
With the help of this script, you can easily identify important patterns in the market and manage your risks better. Make sure to choose a demo account before using it in real trading.
Movingavarage

VARGAS"VARGAS" is an indicator that can be used in all timeframes on charts in the stock, crypto, and commodity markets. It allows trades to be opened according to the intersections of moving averages in different time periods.
It is an indicator using weighted moving averages. Using a weighted moving average has the following benefits for traders:
1) Precision and Smoothness: The WMA typically gives more weight to recent prices and therefore reacts faster to more recent data. This helps you catch price movements faster and recognize trend changes faster. On the other hand, the WMA is smoother than the simple moving average (SMA), which makes it less likely to generate false signals.
2) Trend Identification: The WMA is used to identify and analyze price trends. It is especially important for traders who want to track short-term movements. The WMA is used to assess the direction and strength of the trend.
3) Trading Signals: The WMA is used as part of various trading strategies. It is especially used in moving average crossover strategies. For example, a short-term WMA crossing the long-term WMA to the upside can be considered a buy signal, while a reversal can be interpreted as a sell signal.
4) Adaptability to Volatility: WMA can adapt to volatility by changing weighting factors. Investors can adopt a more flexible approach by assigning different weights based on market conditions and asset classes.
5) Data Correction: WMA can be helpful in reducing data noise. A single large price fluctuation can cause the SMA to be more affected, while the WMA reduces the impact of these fluctuations.
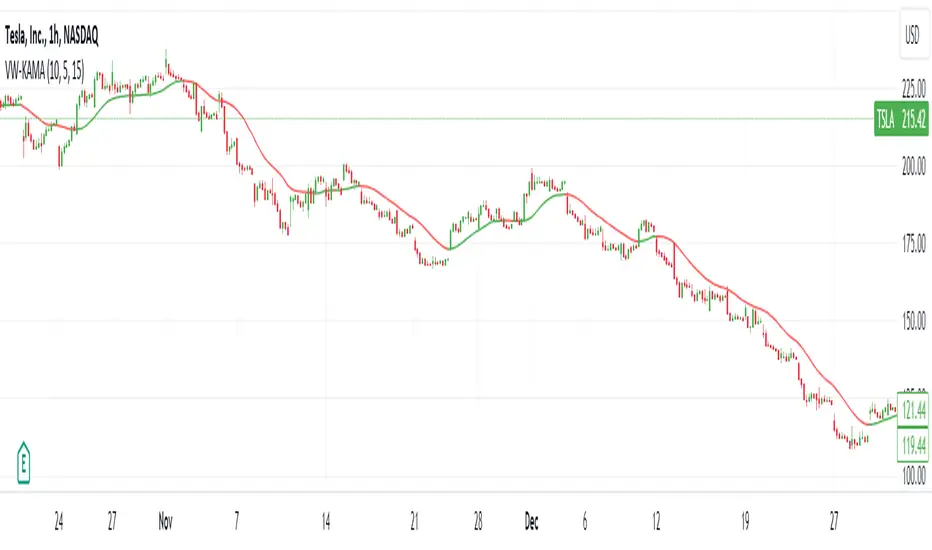
In our VARGAS coding, the intersection times of the 9-day and 15-day weighted moving averages allow us to decide the direction of the trend. The green and red cloud areas following the price candles make the strategy easy for the user to follow.
At the intersection between the 9-day weighted moving average and the 15-day weighted moving average, we can use buy and sell signals as follows:
If the 9-day weighted moving average crosses the 15-day weighted moving average upwards, buy,
Sell if the 9-day weighted moving average crosses the 15-day weighted moving average downwards.
Within the scope of this strategy, GOLDEN CROSS and DEATH CROSS intersections, which guide us for trend changes, are also included in the coding. Thus, it is aimed to add strength to our WMA 9 and WMA 15 intersection strategy as an idea.
VARGAS indicator gives better results for longer periods of 4 hours and above. As the time period increases, the probability of correct results will increase.
**
"VARGAS" hisse senedi, kripto, ve emtia piyasalarındaki grafiklerde her türlü zaman diliminde kullanılabilen bir indikatördür. Farklı zaman periyotlarındaki hareketli ortalamaların kesişimlerine göre işlem açılmasını sağlar.
Ağırlıklı hareketli ortalamalar kullanılarak hazırlanmış bir göstergedir. Ağırlıklı hareketli ortalama kullanmanın yatırımcılara aşağıdaki gibi faydaları bulunmaktadır:
1) Duyarlılık ve Pürüzsüzlük: WMA, tipik olarak son dönem fiyatlarına daha fazla ağırlık verir ve bu nedenle daha güncel verilere daha hızlı tepki verir. Bu, fiyat hareketlerini daha hızlı yakalamanıza ve daha hızlı trend değişikliklerini tanımanıza yardımcı olur. Diğer yandan, WMA, basit hareketli ortalamaya (SMA) göre daha pürüzsüzdür, bu da yanlış sinyal üretme olasılığını azaltır.
2) Trend Belirleme: WMA, fiyat trendlerini belirlemek ve analiz etmek için kullanılır. Özellikle kısa vadeli hareketleri izlemek isteyen yatırımcılar için önemlidir. WMA, trendin yönünü ve gücünü değerlendirmek için kullanılır.
3) Ticaret Sinyalleri: WMA, çeşitli ticaret stratejilerinin bir parçası olarak kullanılır. Özellikle hareketli ortalama crossover stratejilerinde kullanılır. Örneğin, kısa vadeli WMA'nın uzun vadeli WMA'yı yukarı yönlü kesmesi bir alım sinyali olarak kabul edilebilir, tersine dönmesi ise bir satış sinyali olarak yorumlanabilir.
4) Volatiliteye Uyarlanabilirlik: WMA, ağırlıklandırma faktörlerini değiştirerek volatiliteye uyum sağlayabilir. Yatırımcılar, piyasa koşullarına ve varlık sınıflarına göre farklı ağırlıklar atayarak daha esnek bir yaklaşım benimseyebilirler.
5) Veri Düzeltme: WMA, veri gürültüsünü azaltmada yardımcı olabilir. Tek bir büyük fiyat dalgalanması, SMA'nın daha fazla etkilenmesine neden olabilirken, WMA bu dalgalanmaların etkisini azaltır.
VARGAS isimli kodlamamızda ise 9 günlük ve 15 günlük ağırlıklı hareketli ortalamaların kesişme zamanları trendin yönüne karar vermemizi sağlar. Fiyat mumlarını takip eden yeşil ve kırmızı bulut alanları stratejinin kullanıcı tarafından kolaylıkla takip edilmesini sağlamaktadır.
9 Günlük Ağırlıklı hareketli ortalama, 15 Günlük Ağırlıklı hareketli ortalama arasındaki kesişimde al ve sat sinyallerini şu şekilde kullanabiliriz:
Eğer 9 günlük ağırlıklı hareketli ortalama 15 günlük ağırlıklı hareketli ortalamayı yukarı doğru kesiyorsa al,
Eğer 9 günlük ağırlıklı hareketli ortalama, 15 günlük ağırlıklı hareketli ortalamayı aşağı doğru keserse sat.
Bu strateji kapsamında trend değişimleri için bizlere yön veren GOLDEN CROSS ve DEATH CROSS kesişimleri de kodlamanın içerisinde dahil edilmiştir. Böylelikle WMA 9 ve WMA 15 kesişim stratejimize fikir olarak güç katması hedeflenmiştir.
VARGAS indikatörü 4 saat ve üzeri daha uzun periyotlarda daha iyi sonuçlar vermektedir. Zaman periyodu büyüdükçe doğru sonuç verme olasılığı artacaktır.

Adaptive Trend Indicator [Quantigenics]Our Adaptive Trend Indicator is an advanced trading indicator using price and time series analysis to adapt to market trends. It calculates a weighted average of the median price and twice-smoothed average price, then applies a linear regression over twice the user-defined period, generating a trend line. This trend line represents the prevailing market direction and adjusts dynamically based on price fluctuations. When the Adaptive Trend value increases compared to the previous value, the line turns aqua, signaling an upward trend. Conversely, if it decreases, the line turns red, indicating a downward trend. This color coding provides visual guidance for traders. By combining advanced statistical techniques with real-time adaptation, the Adaptive Trend indicator provides timely trend information, supporting traders in navigating various market conditions.
Additionally, this indicator may be applied multiple times to the same chart. Traders may adjust the length of each instance to show a group of trendlines that can indicate when price action is overbought or oversold as well as support or resistance at different indicator lengths. Example below.
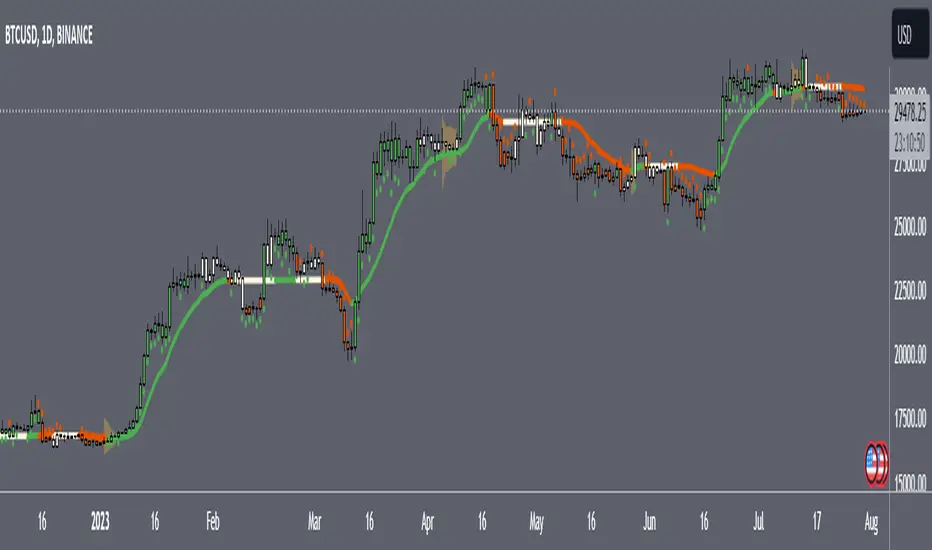
CRYPTO:BTCUSD
CRYPTO:BTCUSD
NASDAQ:TSLA
We hope you enjoy this indicator. Happy Trading!

AI Moving Average (Expo)█ Overview
The AI Moving Average indicator is a trading tool that uses an AI-based K-nearest neighbors (KNN) algorithm to analyze and interpret patterns in price data. It combines the logic of a traditional moving average with artificial intelligence, creating an adaptive and robust indicator that can identify strong trends and key market levels.
█ How It Works
The algorithm collects data points and applies a KNN-weighted approach to classify price movement as either bullish or bearish. For each data point, the algorithm checks if the price is above or below the calculated moving average. If the price is above the moving average, it's labeled as bullish (1), and if it's below, it's labeled as bearish (0). The K-Nearest Neighbors (KNN) is an instance-based learning algorithm used in classification and regression tasks. It works on a principle of voting, where a new data point is classified based on the majority label of its 'k' nearest neighbors.
The algorithm's use of a KNN-weighted approach adds a layer of intelligence to the traditional moving average analysis. By considering not just the price relative to a moving average but also taking into account the relationships and similarities between different data points, it offers a nuanced and robust classification of price movements.
This combination of data collection, labeling, and KNN-weighted classification turns the AI Moving Average (Expo) Indicator into a dynamic tool that can adapt to changing market conditions, making it suitable for various trading strategies and market environments.
█ How to Use
Dynamic Trend Recognition
The color-coded moving average line helps traders quickly identify market trends. Green represents bullish, red for bearish, and blue for neutrality.
Trend Strength
By adjusting certain settings within the AI Moving Average (Expo) Indicator, such as using a higher 'k' value and increasing the number of data points, traders can gain real-time insights into strong trends. A higher 'k' value makes the prediction model more resilient to noise, emphasizing pronounced trends, while more data points provide a comprehensive view of the market direction. Together, these adjustments enable the indicator to display only robust trends on the chart, allowing traders to focus exclusively on significant market movements and strong trends.
Key SR Levels
Traders can utilize the indicator to identify key support and resistance levels that are derived from the prevailing trend movement. The derived support and resistance levels are not just based on historical data but are dynamically adjusted with the current trend, making them highly responsive to market changes.
█ Settings
k (Neighbors): Number of neighbors in the KNN algorithm. Increasing 'k' makes predictions more resilient to noise but may decrease sensitivity to local variations.
n (DataPoints): Number of data points considered in AI analysis. This affects how the AI interprets patterns in the price data.
maType (Select MA): Type of moving average applied. Options allow for different smoothing techniques to emphasize or dampen aspects of price movement.
length: Length of the moving average. A greater length creates a smoother curve but might lag recent price changes.
dataToClassify: Source data for classifying price as bullish or bearish. It can be adjusted to consider different aspects of price information
dataForMovingAverage: Source data for calculating the moving average. Different selections may emphasize different aspects of price movement.
-----------------
Disclaimer
The information contained in my Scripts/Indicators/Ideas/Algos/Systems does not constitute financial advice or a solicitation to buy or sell any securities of any type. I will not accept liability for any loss or damage, including without limitation any loss of profit, which may arise directly or indirectly from the use of or reliance on such information.
All investments involve risk, and the past performance of a security, industry, sector, market, financial product, trading strategy, backtest, or individual's trading does not guarantee future results or returns. Investors are fully responsible for any investment decisions they make. Such decisions should be based solely on an evaluation of their financial circumstances, investment objectives, risk tolerance, and liquidity needs.
My Scripts/Indicators/Ideas/Algos/Systems are only for educational purposes!

MACD Bands - Multi Timeframe [TradeMaster Lite]We present a customizable MACD indicator, with the following features:
Multi-timeframe
Deviation bands to spot unusual volatility
9 Moving Average types
Conditional coloring and line crossings
👉 What is MACD?
MACD is a classic, trend-following indicator that uses moving averages to identify changes in momentum. It can be used to identify trend changes, overbought and oversold conditions, and potential reversals.
👉 Multi-timeframe:
This feature allows to analyze the same market data on multiple time frames, which can be in help to identify trends and patterns that would not be visible on a single time frame. When using the multi-timeframe feature, it is important to start with the higher time frame and then look for confirmation on the lower time frames. This will help you to avoid false signals. Please note that only timeframes higher than the chart timeframe is supported currently with this feature enabled. Might get updated in the future.
👉 Deviation bands to spot unusual volatility:
Deviation bands are plotted around the Signal line that can be in help to identify periods of unusual volatility. When the MACD line crosses outside of the deviation bands, it suggests that the market is becoming more volatile and a strong trend may form in that direction.
👉 9 Moving Average types can be used in the script. Each type of moving average offers a unique perspective and can be used in different scenarios to identify market trends.
SMA (Simple Moving Average): This calculates the average of a selected range of values, by the number of periods in that range.
SMMA (Smoothed Moving Average): This takes into account all data available and assigns equal weighting to the values.
EMA (Exponential Moving Average): This places a greater weight and significance on the most recent data points.
DEMA (Double Exponential Moving Average): This is a faster-moving average that uses a proprietary calculation to reduce the lag in data points.
TEMA (Triple Exponential Moving Average): This is even quicker than the DEMA, helping traders respond more quickly to changes in trend.
LSMA (Least Squares Moving Average): This moving average applies least squares regression method to determine the future direction of the trend.
HMA (Hull Moving Average): This moving average is designed to reduce lag and improve smoothness, providing quicker signals for short-term market movements.
VWMA (Volume Weighted Moving Average): This assigns more weight to candles with a high volume, reflecting the true average values more accurately in high volume periods.
WMA (Weighted Moving Average): This assigns more weight to the latest data, but not as much as the EMA.
👉 Conditional coloring :
This feature colors the MACD line line based on it's direction and fills the area between the MACD line and Deviation band edges to highlight the potential volatility and the strength of the momentum. This can be useful to identify when the market is trending strongly and when it is in a more neutral or choppy state.
👉 MACD Line - Signal Line crossings:
This is a classic MACD trading signal that occurs when the MACD line crosses above or below the signal line. Crossovers can be used to identify potential trend reversals. This can be a bullish or bearish signal, depending on the direction of the crossover.
👉 General advice
Confirming Signals with other indicators:
As with all technical indicators, it is important to confirm potential signals with other analytical tools, such as support and resistance levels, as well as indicators like RSI, MACD, and volume. This helps increase the probability of a successful trade.
Use proper risk management:
When using this or any other indicator, it is crucial to have proper risk management in place. Consider implementing stop-loss levels and thoughtful position sizing.
Combining with other technical indicators:
The indicator can be effectively used alongside other technical indicators to create a comprehensive trading strategy and provide additional confirmation.
Keep in Mind:
Thorough research and backtesting are essential before making any trading decisions. Furthermore, it's crucial to have a solid understanding of the indicator and its behavior. Additionally, incorporating fundamental analysis and considering market sentiment can be vital factors to take into account in your trading approach.
Limitations:
This is a lagging indicator. Please note that the indicator is using moving averages, which are lagging indicators.
The indicators within the TradeMaster Lite package aim for simplicity and efficiency, while retaining their original purpose and value. Some settings, functions or visuals may be simpler than expected.
⭐ Conclusion
We hold the view that the true path to success is the synergy between the trader and the tool, contrary to the common belief that the tool itself is the sole determinant of profitability. The actual scenario is more nuanced than such an oversimplification. Our aim is to offer useful features that meet the needs of the 21st century and that we actually use.
🛑 Risk Notice:
Everything provided by trademasterindicator – from scripts, tools, and articles to educational materials – is intended solely for educational and informational purposes. Past performance does not assure future returns.

Volume-Weighted Kaufman's Adaptive Moving AverageThe Volume-Weighted Kaufman's Adaptive Moving Average (VW-KAMA) is a technical indicator that combines the Volume-Weighted Moving Average (VWMA) and the Kaufman's Adaptive Moving Average (KAMA) to create a more responsive and adaptable moving average.
Advantages:
Volume-Weighted: It takes into account the volume of trades, giving more weight to periods with higher trading volume, which can help filter out periods of low activity.
Adaptive: The indicator adjusts its smoothing constant based on market conditions, becoming more sensitive in trending markets and less sensitive in choppy or sideways markets.
Versatility: VW-KAMA can be used for various purposes, including trend identification, trend following, and determining potential reversal points and act as dynamic support and resistance level.
VCC SmtmWorks better for Cryptos (1W and greater than) timeframes.
This strategy incorporates multiple indicators to make informed trading signals. It leverages the Stochastic indicator to assess price momentum, utilizes the Bollinger Band to identify potential oversold and overbought conditions, and closely monitors Moving Averages to gauge the trend's bullish or bearish nature.
A long signal will be displayed if the following conditions are met:
The Stochastic D and Stochastic K both indicate an oversold condition, with Stochastic K being lower than Stochastic D.
The current Price Low is below the Bollinger Lower Band.
The Price Close is currently below all Moving Averages.
A Death Cross pattern has formed among the Moving Averages.
A short signal will be displayed if the opposite of the long conditions are true:
The Stochastic D and Stochastic K both indicate an overbought condition, with Stochastic K being higher than Stochastic D.
The current Price High is above the Bollinger Upper Band.
The Price Close is currently above all Moving Averages.
A Golden Cross pattern has formed among the Moving Averages.

Speed RailsCentered around a Variable Moving Average (Rail Line). The Variable Moving Average (VMA) is a study that uses an Exponential Moving Average being able to automatically adjust its smoothing factor according to the market volatility. Adjusted the settings of the VMA to move closer to price(quicker). This gives the user the ability to catch moves at support/resistance levels for added confluence.
In addition to the Rail Line or VMA, the indicator makes use of Bollinger Bands in two ways. First, it displays when the Bollinger Bands are in a squeeze and the potential direction of the breakout. The "squeeze" is the central concept of Bollinger Bands. When the bands come close together, constricting the moving average, it is called a squeeze. A squeeze signals a period of low volatility and is considered by traders to be a potential sign of future increased volatility and possible trading opportunities. The Bollinger Bands are also utilized to highlight when price action might reverse. This signals when price closes outside of the bands, quickly reverts and closes within the bands
Dots = Short Term Trend
Rails Bar Color = Medium Term Trend
Rail Line (VMA) = Long Term Trend
Squeeze = Shaded Orange Cloud
Combined with traditional support/resistance levels:
Major and Minor Trend Indicator by Nikhil34a V 2.2Title: Major and Minor Trend Indicator by Nikhil34a V 2.2
Description:
The Major and Minor Trend Indicator v2.2 is a comprehensive technical analysis script designed for use with the TradingView platform. This powerful tool is developed in Pine Script version 5 and helps traders identify potential buying and selling opportunities in the stock market.
Features:
SMA Trend Analysis: The script calculates two Simple Moving Averages (SMAs) with user-defined lengths for major and minor trends. It displays these SMAs on the chart, allowing traders to visualize the prevailing trends easily.
Surge Detection: The indicator can detect buying and selling surges based on specific conditions, such as volume, RSI, MACD, and stochastic indicators. Both Buying and Selling surges are marked in black on the chart.
Option Buy Zone Detection: The script identifies the option buy zone based on SMA crossovers, RSI, and MACD values. The buy zone is categorized as "CE Zone" or "PE Zone" and displayed in the table along with the trigger time.
Two-Day High and Low Range: The script calculates the highest high and lowest low of the previous two trading days and plots them on the chart. The area between these points is shaded in semi-transparent green and red colors.
Crossover Analysis: The script analyzes moving average crossovers on multiple timeframes (2-minute, 3-minute, and 5-minute) and displays buy and sell signals accordingly.
Trend Identification: The script identifies the major and minor trends as either bullish or bearish, providing valuable insights into the overall market sentiment.
Usage:
Customize Major and Minor SMA Periods: Adjust the lengths of major and minor SMAs through input parameters to suit your trading preferences.
Enable/Disable Moving Averages: Choose which SMAs to display on the chart by toggling the "showXMA" input options.
Set Surge and Option Buy Zone Thresholds: Modify the surgeThreshold, volumeThreshold, RSIThreshold, and StochThreshold inputs to refine the surge and buy zone detection.
Analyze Crossover Signals: Monitor the crossover signals in the table, categorized by timeframes (2-minute, 3-minute, and 5-minute).
Explore Market Bias and Distance to 2-Day High/Low: The table provides information on market bias, current price movement relative to the previous two-day high and low, and the option buy zone status.
Additional Use Cases:
Surge Indicator:
The script includes a Surge Indicator that detects sudden buying or selling surges in the market. When a buying surge is identified, the "BSurge" label will appear below the corresponding candle with black text on a white background. Similarly, a selling surge will display the "SSurge" label in white text on a black background. These indicators help traders quickly spot strong buying or selling activities that may influence their trading decisions. These surges can be used to identify sudden premium dump zones.
Option Buy Zone:
The Option Buy Zone is an essential feature that identifies potential zones for buying call options (CE Zone) or put options (PE Zone) based on specific technical conditions. The indicator evaluates SMA crossovers, RSI, and MACD values to determine the current market sentiment. When the option buy zone is triggered, the script will display the respective zone ("CE Zone" or "PE Zone") in the table, highlighted with a white background. Additionally, the time when the buy zone was triggered will be shown under the "Option Buy Zone Trigger Time" column.
Price Movement Relative to 2-Day High/Low:
The script calculates the highest high and lowest low of the previous two trading days (high2DaysAgo and low2DaysAgo) and plots these points on the chart. The area between these two points is shaded in semi-transparent green and red colors. The green region indicates the price range between the highpricetoconsider (highest high of the previous two days) and the lower value between highPreviousDay and high2DaysAgo. Similarly, the red region represents the price range between the lowpricetoconsider (lowest low of the previous two days) and the higher value between lowPreviousDay and low2DaysAgo.
Entry Time and Current Zone:
The script identifies potential entry times for trades within the option buy zone. When a valid buy zone trigger occurs, the script calculates the entryTime by adding the durationInMinutes (user-defined) to the startTime. The entryTime will be displayed in the "Entry Time" column of the table. Depending on the comparison between optionbuyzonetriggertime and entryTime, the background color of the entry time will change. If optionbuyzonetriggertime is greater than entryTime, the background color will be yellow, indicating that a new trigger has occurred before the specified duration. Otherwise, the background color will be green, suggesting that the entry time is still within the defined duration.
Current Zone Indicator:
The script further categorizes the current zone as either "CE Zone" (call option zone) or "PE Zone" (put option zone). When the market is trending upwards and the minor SMA is above the major SMA, the currentZone will be set to "CE Zone." Conversely, when the market is trending downwards and the minor SMA is below the major SMA, the currentZone will be "PE Zone." This information is displayed in the "Current Zone" column of the table.
These additional use cases empower traders with valuable insights into market trends, buying and selling surges, option buy zones, and potential entry times. Traders can combine this information with their analysis and risk management strategies to make informed and confident trading decisions.
Note:
The script is optimized for identifying trends and potential trade opportunities. It is crucial to perform additional analysis and risk management before executing any trades based on the provided signals.
Happy Trading!

Higher Fibonacci EMAOverall image:
If the closing price is higher than the three Fibonacci EMAs (uptrend):
Thanks to @ZenAndTheArtOfTrading and his indicator "Higher Timeframe EMA", URL =
This is a trend-discriminating indicator that uses 3 EMAs.
The Williams Alligator is the underlying philosophy, and we have applied it to capture the larger trend.
It is set up for the current time frame + 2 higher time frames.
One of the upper time legs has a daily EMA length of 13 Fibonacci numbers.
The top-level time leg has a weekly EMA with a length of 5 Fibonacci.
If the current closing price of the ticker leg is higher than these three EMAs, the bar color will be green. If it is lower, it will be red. If it is neither, it will be gray.
If the bar color is green, it suggests that the trend is upward. If it is red, you can consider entering short. If it is gray, it is best not to enter anything.

[MAD] CurveBuilderThe CurveBuilder is a versatile indicator that constructs channels using selectable input averages weighted together.
It also incorporates scalable and shiftable offsets on the resulting bands.
This indicator allows users to customize various settings to tailor the channel construction according to their trading strategy.
here a example screenshot of 3 different settings overlayed
Key Features:
-------------------
1. Moving Average Timeframe: Select the timeframe for the moving average calculation on the middle line.
-------------------
2. Middleline Settings:
Allow you to customize the parameters related to the middle line of the channel.
The middle line is constructed using two moving averages, which can be selected from the various types available.
Here are the details of the Middleline Settings:
1. MA Type: This setting allows you to choose the type of moving average for the first average. You have the following options:
Weighted Moving Average (WMA), Hull Moving Average (HMA), Volume Weighted Moving Average (VWMA), Linear Moving Average (LMA),
Regular Moving Average (RMA), Simple Moving Average (SMA), Exponential Moving Average (EMA), EMA, Ehlers Gaussian,
Ehlers Smoother, Ehlers Supersmoother, Ehlers Butterworth, ChebyshevI, ChebyshevII
Length (1st MA): This parameter allows you to set the length or period of the first moving average. The length determines the number of bars considered in the calculation of the moving average.
2. MA Type: Similar to the first moving average, this setting lets you choose the type of moving average for the second average.
Length (2nd MA): This parameter sets the length or period of the second moving average. The length determines the number of bars considered in the calculation of the moving average.
3. Weighting:
This option allows you to adjust the weighting factor when merging from the first moving average to the second moving average.
By modifying the weighting, you can control the influence of the first average on the second average.
By selecting different moving average types, adjusting their lengths, and modifying the weighting factor, you can fine-tune the behavior of the middle line in the channel.
This flexibility allows you to customize the indicator to align with your preferred trading strategy and market conditions.
Best results are given when there is a maximum hitrate on retraces to the middleline, and many relevant directionchanges are near that line.
-------------------
3. Averaging Settings:
Offset of Curve in Bars: Shifts the indicator into the future by specifying the number of bars.
-------------------
4. Band Settings:
The Band Settings in the Multitimeframe Channel Builder indicator allow you to configure the parameters related to the construction of the bands around the middle line.
The bands provide an upper and lower boundary that help define the width of the channel. Here are the details of the Band Settings:
Band Mode:
This setting determines the method used to calculate the bands. You have the following options:
Off: Bands are turned off, and no calculations are performed.
True Range: Bands are calculated using the True Range.
Average True Range: Bands are calculated using the Average True Range.
Standard Deviation: Bands are calculated using the Standard Deviation.
Rate of Change: Bands are calculated using the Rate of Change.
Relative Strength Index: Bands are calculated using the Relative Strength Index.
Length (Bands):
This parameter sets the length or period used in the calculation of the bands. The length determines the number of bars considered when calculating the bands.
Band 1-3 Multiplicator:
These parameters allow you to adjust the scaling factor for each band. The multiplicative factor determines the width of the bands relative to the middle line.
Higher values result in wider bands, while lower values result in narrower bands.
Offset in % (Bands):
These parameters enable you to specify the offset percentage for each band. The offset represents the distance between the middle line and the bands.
A positive offset moves the bands further away from the middle line, while a negative offset brings the bands closer to the middle line.
By selecting the desired band mode, adjusting the length parameter, and modifying the multiplicators and offsets,
you can customize the width and positioning of the bands.
This flexibility allows you to adapt the indicator to different market conditions and trading strategies.
Note that if the Band Mode is set to "Off," the bands will not be displayed, regardless of the other band settings.
-------------------
5. Band Final Smooth:
The Band Final Smooth settings in the Multitimeframe Channel Builder indicator enable you to apply a smoothing technique to the constructed bands.
By selecting the desired smoothing type and adjusting the length parameter, you can customize the level of smoothing applied to the bands.
This helps to filter out short-term fluctuations and emphasize the underlying trend, providing a clearer visualization of the price channel.
Smooth Bands: This option allows you to enable or disable the smoothing of the bands. When enabled, the indicator applies the selected smoothing technique to the bands.
Smooth Type: You can choose the type of smoothing to apply to the bands. The available options include:
Weighted Moving Average (WMA), Hull Moving Average (HMA), Volume Weighted Moving Average (VWMA), Linear Moving Average (LMA),
Regular Moving Average (RMA), Simple Moving Average (SMA), Exponential Moving Average (EMA), EMA, Ehlers Gaussian,
Ehlers Smoother, Ehlers Supersmoother, Ehlers Butterworth, ChebyshevI, ChebyshevII
Length (Smooth Bands): This parameter sets the length or period of the smoothing technique applied to the bands.
A longer length will result in a smoother representation of the bands, while a shorter length will provide more responsiveness to price changes.
Final Smooth settings are optional, and you can choose to exclude smoothing if it does not align with your trading strategy or preferences.
-------------------
6. Alert Settings:
The Alert Settings in the Multitimeframe Channel Builder indicator allow you to configure the parameters related to the generation of alert notifications based on specific conditions.
Alerts can help you stay informed about potential trading opportunities. Here are the details of the Alert Settings:
Alert Mode: This setting determines the type of alert triggered by the indicator. You have the following options:
Band-outside: Generates an alert when the price moves outside the constructed channel bands.
Band-crossin: Generates an alert when the price crosses above or below the channel bands.
Band-crossout: Generates an alert when the price crosses back inside the channel bands.
Trend: Generates an alert when there is a significant trend change (over or under the middleline).
Oscillator: Generates an alert based on the behavior of the oscillator, if in Oscillator mode.
Spikedetection: This option allows you to enable or disable spike detection in the alerts. When enabled, the indicator considers spikes or sudden price movements when generating alerts.
By selecting the appropriate Alert Mode and configuring spike detection, you can receive alert notifications that align with your trading strategy and help you identify potential trading opportunities.
It's important to note that alert settings alone do not place trades automatically.
They serve as notifications for you to review and analyze the situation before making trading decisions.
Make sure to have a proper understanding of the selected alert mode and its implications in your trading strategy.
-------------------
7. Operation Mode:
The Multitimeframe Channel Builder indicator offers three operation modes: Channels, Oscillator, and Noplot.
This setting determines how the indicator is displayed on the chart and what type of information it provides.
Channels Mode:
When the indicator is set to channel mode, it will be displayed as an overlay on the chart. It generates channel lines based on the selected moving average types and their lengths.
These channels can help identify support and resistance levels or potential price breakout points. The channel lines are plotted on the chart,
providing a visual representation of the price movements within the channels.
Oscillator Mode: In Oscillator mode, the indicator is presented on a separate plane below or above the main chart, which you need to move manually.
It generates an oscillator based on the configured settings, including the selected moving averages and their lengths.
The oscillator provides insights into the market's momentum and overbought/oversold conditions.
It consists of horizontal lines representing different levels, such as upper and lower boundaries, and a middle line.
Traders can analyze the oscillator's movements and crossovers to identify potential trading signals.
Noplot Mode: Setting the indicator to Noplot mode disables all visual plotting on the chart. However, the indicator still generates alerts based on the configured settings.
This mode is useful if you only want to receive alert notifications for trading opportunities without cluttering the chart with additional visual elements.
Channels mode is ideal for analyzing price movements within defined channels,
Oscillator mode provides insights into market momentum, and
Noplot mode allows for focus on alert notifications without visual distractions on the chart.
-------------------
8. Oscillator Settings (Only applicable in Oscillator mode):
Hline from highest to lowest: Set the values for the highest to lowest horizontal lines.
POW-Compression: Adjust the compression factor for the oscillator.
Multiplier: Set the multiplier for the oscillator.
Oscillator Normalization Lockback: Specify the minimum time for normalization in the oscillator.
Detection Length and Filter Length: Set the lengths for the oscillator detection and filter.
Show Acceleration: Enable or disable the display of acceleration.
-------------------
9. Label Settings:
Decimals for Labels: Choose the number of decimals for label values.
Show Alerts (L1, L2, L3): Toggle the visibility of alerts for each level. Alert 1 is a minor alert, 3 a major
Label Color: Set the color for the labels.
Display Lines: Show or hide the lines on the chart.
Display Prices: Show or hide the price levels on the chart.
-------------------
10. Signal Config:
This Indicator offers a signal transmission configuration section specifically for Multibit implementation.
This feature allows you to transmit signals between multiple instances of the indicator, creating a daisychain effect. Here are the details of the Multibit implementation settings:
Signal Type: This setting determines the type of signal transmission used. You have the following options:
MultiBit: Enables the Multibit signal transmission.
MultiBit_pass: Enables the Multibit signal transmission with infusion.
NoInput: Disables the signal transmission.
Select Incoming Indicator: This parameter allows you to select the incoming indicator for signal transmission. You can choose any valid input source, such as the closing price or another indicator.
Channel configuration:
Channel long signal 1: Specify the channel used to transmit long signals for the first instance in the daisychain. Choose a value from -1 to 15 to represent different channels.
Channel short signal 1: Specify the channel used to transmit short signals for the first instance in the daisychain. Choose a value from -1 to 15 to represent different channels.
Channel long signal 2: Specify the channel used to transmit long signals for the second instance in the daisychain.
Channel short signal 2: Specify the channel used to transmit short signals for the second instance in the daisychain.
Channel long signal 3: Specify the channel used to transmit long signals for the third instance in the daisychain.
Channel short signal 3: Specify the channel used to transmit short signals for the third instance in the daisychain.
Channel Sideways only: Specify the channel used to transmit signals related to sideways movements.
Channel Trend: Specify the channel used to transmit signals related to trend movements.
Here's a overview of the current settings.
-------------------
Librarys used:
djmad/Signal_transcoder_library
djmad/MAD_MATH
djmad/Mad_Standardparts

Fibonacci Levels on Any Indicator [By MUQWISHI]▋ INTRODUCTION :
A “Fibonacci Levels on Any Indicator” can be applied to any indicator to draw Fibonacci levels based on provided conditions of two price points to produce a sequence of horizontal line levels starting from 0% to 100% in addition to extension levels. The 0% level is measured as the start of retracement, while the 100% level is the beginning of the extension levels. This tool was developed to be easy to add to any indicator, and it could be valuable to some traders in terms of managing trades by setting targets and reducing risk in the trend direction.
_______________________
▋ USAGE:
➤ NEEDS TO IDENTIFY 4 ELEMENTS:
1. Starting Point. What’re the conditions / When will the drawing of the Fibonacci levels begin?
2. Ending Point. What’re the conditions / When will the drawing of the Fibonacci levels end?
3. High Point. What is the price for a 100% Fibonacci level (0% for the downside)?
4. Low Point. What is the price for a 0% Fibonacci level (100% for the downside)?
➤ STARTING & ENDING POINTS CONDITIONS:
Need to specify the condition when the drawing of Fibonacci levels starts and ends, and the indicator shows different prepared conditions.
New Phase: Import a value (plot) from an existing indicator, where its status changes from NaN to a real number.
Crosses Above/Below: Import a value(1) (plot) from an existing indicator, where it crosses above/below value(2).
Reversal Up/Down: Import a value(1) (plot) from an existing indicator, where it rises/decreases than the previous value(1).
First/Last Bar: Useful to draw stationary Fibonacci levels.
➤ UPPER & LOWER PIVOTS (0% & 100%):
Need to specify the two price points representing 0% & 100% Fibonacci levels to expose the sequence of Fibonacci lines.
Upper Pivot. By default, the ATR Upper Band. It’s possible to import a custom value from an existing indicator.
Lower Pivot. By default, the ATR Lower Band. It’s possible to import a custom value from an existing indicator.
➤ FIBONACCI STYLING OPTIONS:
Ability to customize line & label style, color, reverse, and hide/show levels.
_______________________
▋ IMPLEMENTATION:
Here are some examples of implementing the indicator.
Note: All presented examples below are for demonstration purposes, and they're not trading suggestions.
# Example 1: (Reversal Up/Down)
We want to implement Fibonacci levels on the Hull MA by mohamed982 . Our requirements are as follows:
Fibonacci levels start when the Hull MA reverses up.
Fibonacci levels end when the Hull MA reverses down.
Upper Pivot is the ATR Upper Band.
Lower Pivot is the ATR Lower Band.
After adding the required indicator (Hull MA), here’re the implementation and results
# Example 2: (Crosses Above/Below)
We want to implement Fibonacci Level on the Squeeze Momentum by LazyBear . Our requirements are as follows:
Fibonacci levels start when the Squeeze Momentum histogram crosses above 0.
Fibonacci levels end when the Squeeze Momentum histogram crosses below 0.
Upper Pivot is the Bollinger Upper Band.
Lower Pivot is the Bollinger Lower Band.
After adding the required indicators (Squeeze Momentum & Bollinger Band), here’re the implementation and results
# Example 3: (Crosses Above/Below)
We want to implement Fibonacci Level on the Crossing Moving Averages. Our requirements are as follows:
Fibonacci levels start when the 20-EMA crosses above 100-MA.
Fibonacci levels end when the 20-EMA crosses below 100-MA.
Upper Pivot is the ATR Upper Band.
Lower Pivot is the ATR Lower Band.
After adding the required indicators (20-EMA & 100-MA), here’re the implementation and results
# Example 4: (New Phase: When the previous value is NaN, and the current value is a real number.)
We want to implement Fibonacci Level on the Supertrend. Our requirements are as follows:
Fibonacci levels start when an up-Supertrend (green) line shows up.
Fibonacci levels end when a down-Supertrend (red) line shows up.
Upper Pivot is the down-Supertrend.
Lower Pivot is the up-Supertrend.
After adding the required indicator (Supertrend), here’re the implementation and results
# Example 5: (First/Last Bar)
We want to implement Fibonacci Level between two points, 330 & 300. Our requirements are as follows:
Fibonacci levels start at first bar on the chart.
Fibonacci levels end at last bar on the chart.
Upper Pivot is 330.
Lower Pivot is 300.
Here’re the implementation and results.
To customize the number of bars back (like 50 bars)
_______________________
▋ Final Comments:
The “Fibonacci Levels on Any Indicator” is made to apply on other indicators for planning Fibonacci Levels.
It can be implemented in different ways, along with presented examples.
This indicator does not work with plots that were developed by drawing classes.
Please let me know if you have any questions.
Thank you.

Buy/Sell singal with RSI, MA, RSI DIV1. Overview
I'll explain a strategy that uses the simple but powerful technical analysis techniques RSI, MA, VOLUME, and RSI Divergence to identify Buy/Sell signals. This strategy utilizes Pine Script of TradingView.
Our strategy is based on four fundamental components.
- RSI (Relative Strength Index)
- MA (Moving Averages)
- Volume
- RSI Divergence
By using these four techniques together, we can find potential buy/sell signals.
2. Code Interpretation
To understand the TradingView code we used, let's examine each section one by one.
- RSI Calculation: RSI is a technical indicator that measures the relative strength of a price and is often used to identify overbought or oversold conditions. In our code, we calculate the RSI over a given period.
- Moving Averages: This code calculates short-term and long-term moving averages. Moving averages represent the average price over a specific period and are used to identify long-term price trends. Their intersections are considered potential buy/sell signals.
- RSI Divergence: RSI divergence represents a mismatch between the price trend and the RSI trend. It occurs when the price makes a new high or low, but the RSI does not. This indicates a weakening of the price trend and is considered a powerful signal of trend change.
- Volume Calculation: When the volume of transactions occurring during a specific period is x times more than the average volume, it is considered a signal of trend change.
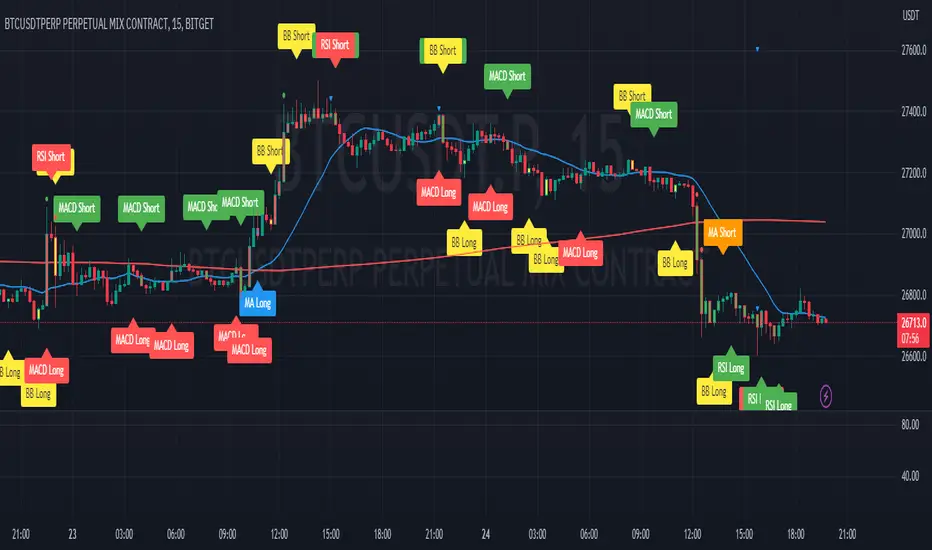
- Buy/Sell Signals: Each technical indicator generates buy or sell signals. These signals are marked as labels on the chart. In our strategy, buy/sell signals are generated when the RSI exits overbought or oversold zones, when the moving averages cross, and when RSI divergence occurs.
3. Signal Detection
3.1 Buy/Sell Signals Using RSI
The RSI indicator has a value between 0 and 100, with values over 70 generally considered the overbought zone and those under 30 as the oversold zone.
A buy signal is generated when the RSI rises from the oversold zone.
Conversely, a sell signal is generated when the RSI falls from the overbought zone.
3.2 Detecting Buy/Sell Signals Through Moving Average Crosses
Moving averages help identify price trends.
A buy signal is generated when the short-term moving average crosses the long-term moving average upward.
Conversely, a sell signal is generated when the short-term moving average crosses the long-term moving average downward.
The color of each bar can be changed according to each signal.
3.3 Detecting Signals When Volume is X Times Higher Than Average
When the volume is x times higher than average, a marker is placed above each bar.
A green marker is displayed when the buy volume is high.
A red marker is displayed when the sell volume is high.
4. Conclusion
This technical analysis strategy is very simple but effective. Using RSI, moving averages, volume, and RSI divergence, you can find effective buy/sell signals.
By leveraging Pine Script in TradingView, you can easily apply this strategy and find signals in real-time.
Always remember that risk management is important in trading. This strategy may not be effective in all market conditions, so always use appropriate risk management strategies alongside it.
----------------------------------------------------------------------------------------------------------------------------------------------------------------------------------------------------------------------------------------------------------------------------------------------
1. 개요
간단하지만 강력한 기술적 분석 전략인 RSI, MA, VOLUME, RSI Divergence를 사용한 Buy/Sell 신호 표시 전략에 대해 설명드리겠습니다.
이 전략은 트레이딩뷰의 Pine Script를 활용합니다.
우리의 전략은 다음 네 가지 기본 구성 요소에 기반합니다.
- RSI (Relative Strength Index)
- MA (Moving Averages)
- 거래량
- RSI Divergence
이 네 가지 기법을 함께 사용하여 잠재적인 매수/매도 신호를 찾아냅니다.
2. 코드 해석
우리가 사용한 트레이딩뷰 코드를 이해하기 위해 각 섹션을 하나씩 살펴보겠습니다.
RSI 계산: RSI는 가격의 상대적 강도를 측정하는 기술적 지표로, 과매수 또는 과매도 조건을 식별하는 데 자주 사용됩니다. 우리의 코드에서는 주어진 기간 동안의 RSI를 계산합니다.
이동평균: 이 코드에서는 단기 이동평균과 장기 이동평균을 계산합니다. 이동평균은 특정 기간 동안의 가격 평균을 나타내며, 가격의 장기적인 트렌드를 식별하는 데 사용됩니다. 이들의 교차점은 잠재적인 매수/매도 신호로 간주됩니다.
RSI Divergence: RSI 다이버전스는 가격 추세와 RSI 추세 사이의 불일치를 나타냅니다. 가격이 새로운 고점 또는 저점을 만들면서 RSI가 그렇지 않을 때 발생합니다. 이것은 가격 트렌드의 약화를 나타내며 강력한 트렌드 변화 신호로 간주됩니다.
VOLUME 계산 : 특정 구간동안의 평균 거래량보다 x배 이상 거래량이 많이 발생하였을때 트렌드 변화 신호로 간주됩니다.
매수/매도 신호: 각 기술적 지표는 매수 또는 매도 신호를 생성합니다. 이러한 신호는 차트에 라벨로 표시됩니다. 우리의 전략에서는 RSI가 과매도 또는 과매수 영역을 벗어날 때, 이동평균이 교차할 때, 그리고 RSI 다이버전스가 발생할 때 매수/매도 신호를 생성합니다.
3. 신호 감지
3.1 RSI를 활용한 매수/매도 신호
RSI 지표는 0에서 100 사이의 값을 가지며, 일반적으로 70 이상은 과매수 영역, 30 이하는 과매도 영역으로 간주됩니다.
과매도 영역에서 RSI가 상승하면 매수 신호가 생성됩니다.
반대로, 과매수 영역에서 RSI가 하락하면 매도 신호가 생성됩니다.
3.2 이동평균 교차로 매수/매도 신호 감지
이동평균은 가격의 트렌드를 식별하는 데 도움이 됩니다.
단기 이동평균이 장기 이동평균을 상승으로 교차하면 매수 신호가 생성됩니다.
반대로, 단기 이동평균이 장기 이동평균을 하락으로 교차하면 매도 신호가 생성됩니다.
각 신호에 따라 해당 봉의 색깔도 변경할 수 있습니다.
3.3 평균 거래량보다 x배 이상 거래량이 발생했을 때 신호 감지
평균 거래량보다 x배 이상 거래량이 발생했을 때 각 봉 위에 표시가 됩니다.
매수 거래량이 많을 경우 초록색으로 표시가 됩니다.
매도 거래량이 많을 경우 빨간색으로 표시가 됩니다.
* 모든 기준이 되는 수치와 색상은 설정에서 개인의 취향에 맞게 설정 가능합니다.
4. 결론
이 기술적 분석 전략은 매우 간단하지만 효과적입니다. RSI, 이동평균, 거래량, RSI 다이버전스를 사용하여 효과적인 매수/매도 신호를 찾을 수 있습니다.
트레이딩뷰의 Pine Script를 활용하여 이 전략을 쉽게 적용하고, 실시간으로 신호를 찾아낼 수 있습니다.
항상 거래에 있어서는 리스크 관리가 중요하다는 점을 명심하십시오. 이 전략이 모든 시장 상황에 효과적이지는 않을 수 있으므로, 항상 적절한 리스크 관리 전략을 함께 사용해야 합니다.
PivotBoss Tool (PART 1)Hello Everyone,
This indicator is being published on TradingView to help traders solve their multiframe analysis issue and at the same time get additional information of different timeframe like - Strength, Momentum and Central Pivot Range relationships all under one single frame.
This indicator is based on the concepts of Secrets of Pivot Boss by Mr.Frank Ochoa and strives to provide more insightful information of pivot points and other general indicators being used by traders on day-to-day basis in the simplest format possible so that traders of all kinds can relate to the same.
Below is the brief information of the indicator table you see in the layout of the above chart -
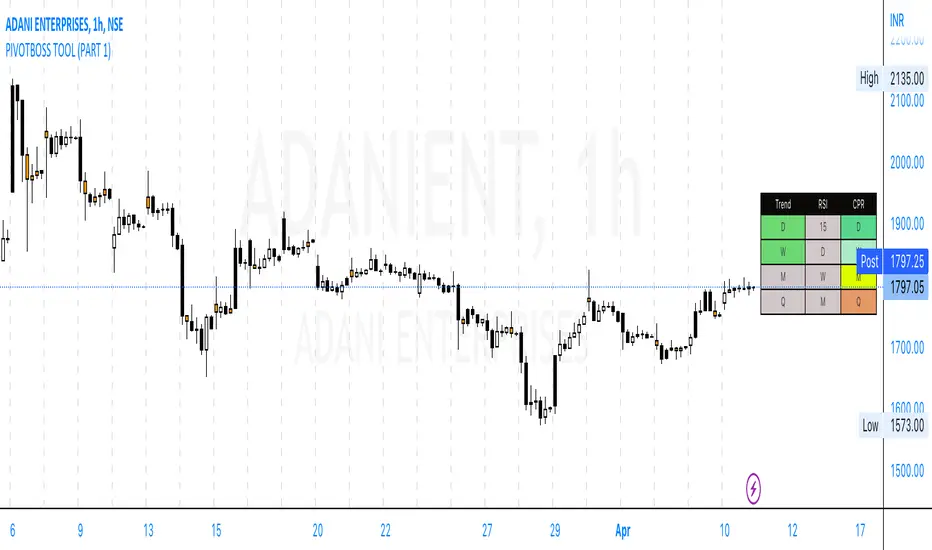
-This is the most interesting part of the indicator where the user gets to the Pivot Trend, RSI strength and Central Pivot Range (CPR) relationship all under one table which comes to be very handy during Intraday trading and Swing/Positional Trading.
#Pivot Trend
This column gives the user the information regarding price movement near to pivot points across multiple timeframes in a single frame which gives the user the accessibility to track the trend in different time frames, to make the information readily available colour code are included in the table which is customisable in the hands of the user and below is the explanation for the same -
- GREEN (Above H3)
- GREY (Between H3-L3)
- RED (Below L3)
#RSI
This column gives the user the information regarding price movement near to RSI values across multiple timeframes in a single frame which gives the user the accessibility to track the momentum in different time frames, to make the information readily available colour code are included in the table which is customisable in the hands of the user and below is the explanation for the same -
- GREEN (Above 70)
- GREY (Between 30 to 70)
- RED (Below 30)
#Central Pivot Range (CPR) Relationship
This column gives an idea of the trend direction and intensity which is exactly formulated according the concepts of PivotBoss Book and it also states the relationship of CPR's with customisable colour codes in the indicator settings, to make the information readily available colour code are included in the table which is customisable in the hands of the user and below is the explanation for the same -
There are generally six possible relationships for CPR compared to previous CPR where the timeframe can be variable but the relationship identification stays constant which is depicted as below -
- GREEN
1) Dark Green denotes "Higher Value CPR Relationship"
2) Light Green denotes "Overlapping Higher Value CPR Relationship"
- RED
3) Dark Red denotes "Lower Value CPR Relationship"
4) Light Red denotes "Overlapping Lower Value CPR Relationship"
- GREY
5) Denotes "Outside Value CPR Relationship"
- YELLOW
6) Denotes "Inside Value CPR Relationship"
This is a very basic tool created to identify Strength, Momentum and Central Pivot Relationship (CPR) across different timeframes so that the user is able to identify the broader aspect of the stock in a single frame and thus can execute his trading skills with optimum efficiency.
This indicator will be updated with time and depending on community's feedback and requirements.
Credits -
- Mr. Frank Ochoa (Concepts and ideas from the book 'Secrets of PivotBoss' )
- TradingView (Providing a platform to traders to simply their trading through 'PineScript')
Regards,
Mukkull
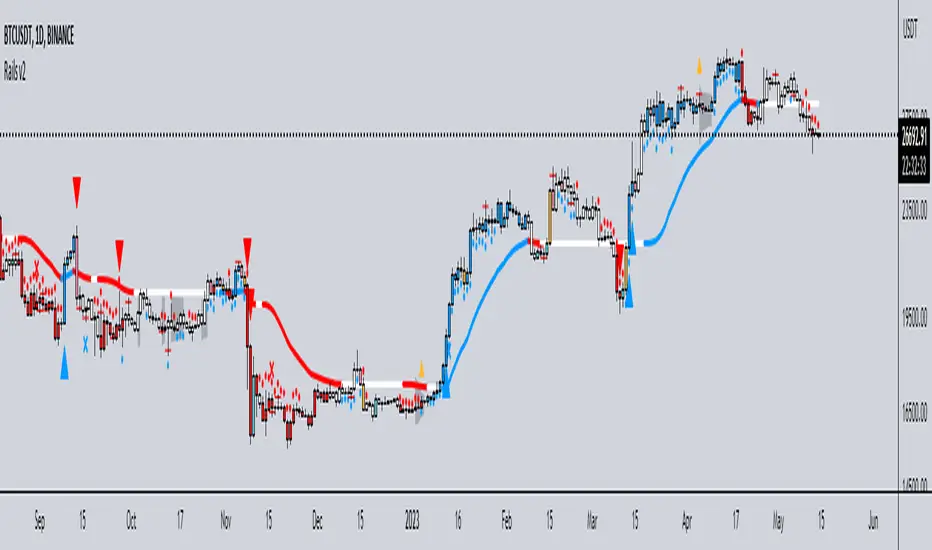
Rails v2Centered around a Variable Moving Average (Rail Line). The Variable Moving Average (VMA) is a study that uses an Exponential Moving Average being able to automatically adjust its smoothing factor according to the market volatility.
In addition to the Rail Line or VMA, the indicator makes use of Bollinger Bands in two ways. First, it displays when the Bollinger Bands are in a squeeze and the potential direction of the breakout. The "squeeze" is the central concept of Bollinger Bands. When the bands come close together, constricting the moving average, it is called a squeeze. A squeeze signals a period of low volatility and is considered by traders to be a potential sign of future increased volatility and possible trading opportunities. The Bollinger Bands are also utilized to highlight when price action might reverse. This signals when price closes outside of the bands, quickly reverts and closes within the bands
The indicator makes use of the Hull Moving Average as a method to quickly capture price action moves thanks to its ability to eliminate lag while managing to improve smoothing at the same time.
Finally, the indicator utilizes Volume Point of Control (VPOC) to determine points in price where the highest amount of volume was traded. Unlike the market profile, the indicator will plot the Volume POC per candle. The script will also plot Trapped Volume. This is important as it tends to serve a signal for reversal. The more price moves away from the trapped volume, Long/Short traders might be forced to cover and price could quickly move away from the area.
DEFAULT SIGNALS: All signals can be turned Off/On by user
Dots = Short Term Trend
Rails Bar Color = Medium Term Trend
Rail Line (VMA) = Long Term Trend
Crossover of Moving Averages = X
Volume Pulse = Large Up/Down Triangle
Potential Bullish Reversal = Light Blue Candle
Potential Bearish Reversal = Pink Candle
Potential Reversal Confirmation = Orange Candle
Squeeze = Shaded White Cloud
Potential Breakout Direction = Small Golden Triangle
Hull Moving Average = Thin Golden Line
Volume POC = Thin Horizontal White Line on Candle
Volume Threshold POC = Thin Horizontal Yellow Line on Candle
Trapped Volume POC = Thin Horizontal Red Line on Candle
Rail Line Levels [s3]Plots support/resistance lines based on a neutral signal (white portion) of the Rail Line (variable moving average) for a period of time designated by the user (defaults to 9 bars). Support/Resistance lines will be removed after a period of tests and can be determined by the user (defaults to 26). Support/Resistance is deemed not as important or strong after several touches or tests. The trailer uses a combination of the calculation for the Rail Line (variable moving average) and an ATR to show the overall trend direction.
The indicator is centered around a Variable Moving Average. The Variable Moving Average (VMA) is a study that uses an Exponential Moving Average being able to automatically adjust its smoothing factor according to the market volatility.
In addition to the VMA, the indicator makes use of the ATR which measures market volatility by decomposing the entire range of an asset price for that period. The true range is taken as the greatest of the following: current high less the current low; the absolute value of the current high less the previous close; and the absolute value of the current low less the previous close.

EMA Power Ranking [wbburgin]This is one of my favorite indicators I've developed. It measures the strength of an uptrend or a downtrend and produces signals for when that trend is weakening.
From my time trading I have learned that moving averages are not good signals to determine trend changes, because they are lagging indicators. However, we can use a moving average system - and the rates of change of the moving averages and the widths between them - to determine when the trend is changing faster than we can using the moving averages themselves. This makes moving averages super useful because we are essentially predicting mean reversal. Then, if we do the same for multiple moving averages of multiple lengths, we can have a pretty accurate perspective of when the price trend is about to reverse.
You can choose which type of MA works best for you, despite the script name. I've found that inverse volatility is the most accurate, but all of my ELMA (elastic MA) signals are also less frequent.
Calculations
The script calculates whether the differences between five moving averages of different lengths are increasing or decreasing, and if the moving averages are positioned properly compared to each other.
When looking at two moving averages, if the width between the moving averages is increasing, and the faster moving average is above the slower moving average the trend is bullish , because the price is outpacing both MA's upwards.
Vice versa, if the width between the moving averages is increasing, and the faster moving average is below the slower moving average the trend is bearish , because the price is outpacing both MA's downwards.
It's deceptively simple. The indicator flags a reversal to the downside immediately after a bullish trend loses momentum, and a reversal to the upside immediately after a bearish trend loses momentum.
Quick note: This isn't a trade setup - I strongly advise that if you are to use this indicator with any strategy, you make sure that there is a stop loss and possibly stop sell as well. The indicator is great at predicting trend reversions, but also falls prey to continuations of both downtrends and uptrends. Best for use in oscillating markets.
Quick note 2: Forgot to mention the precision factor, which goes from 0 (default) to 2. Each step up uses an additional moving average for greater accuracy (i.e. when they are coordinated in a bullish trend, bearish trend, etc.).

Ratio Smoothed, Volume Weighted Moving AverageThis is experimental moving average doesn't use a period/length but instead buffers the price per share and transfers that price per share at a given ratio per bar while also releasing the previous values at a decay ratio.
The idea is that volume is the engine by which the price moves but spikes in volume can cause noise. By having a buffer of price per share units, this VWMA style indicator can behave more like a WMA combined with volume (VAWMA) but smooths out the noise of recent volume. The end result is a price movement that is smooth but also still based strongly up on the average price per share and will always eventually catch up to the true price per share value.
A metaphor to understand this could be a bucket with a hole in it where water is flowing sporadically into the bucket. The level of water in the bucket may change drastically but instead of all the water emptying out immediately, it is throttled by the hole in the bottom. As the level rises, the water pressure increases and the flow increases so that the virtual bucket never has a chance to fill up but also never really empties either.

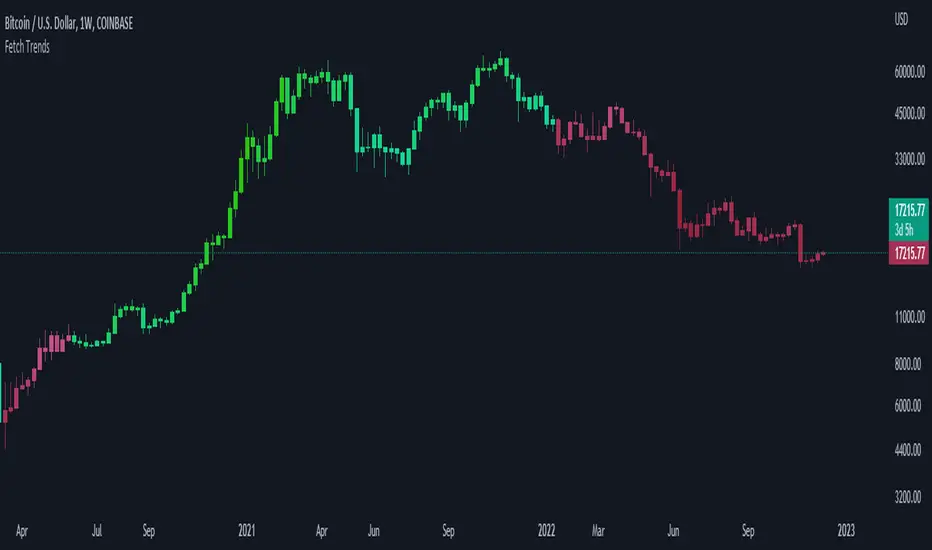
Fetch TrendsThis indicator can be used as a tool to measure the strength of the current trend. It is also trying to achieve to alert traders on when a trend can shift.
In order to achieve this, it uses three simple indicators:
1: 9 Simple moving average
2: 50 Simple moving average
3: Rsi (14)
The moving averages are used to define the current trend of the market, and the rsi is used to measure the strength. We use a color gradient to reach our second goal with this indicator.
The gradient is calculated based on the rsi value, which means the trader can use this indicator to visualize the strength of the current trend. It also helps to alert the trader when the trend starts to shift.
Lets say we use green to signal a strong positive trend, and blue for a weak positive trend. The candles are green in a strong uptrend, and are getting more blue once the trend starts to weaken.
As soon as the trend shifts from bullish to bearish, the bars become a diferent color.
Pranoyama - The Aurora BorealisENG:
The "aurora borealis" indicator has 2 operating modes. To enable it, go to the settings in the arguments section and check the boxes.
1) In the upper part of settings page you may turn on colored of classic candles by heiken ashi candles color. All high low open and close of candles will stay classic. Only color will change. Also you may find there, a moving average which has been added to determine the trend. This moving average is based on Heiken Ashi candles.
2) In the middle of the settings, there is a box which turn on the "Aurora borealis" indicator, it based on Heiken ashi candles and helps to determine the trend.
3) At the bottom of the settings page, you can change the color of candles/aurora.
РУС:
Индикатор "полярное сияние" имеет 2 режима работы. Для его включения войдите в настройки в раздел аргументы и поставьте галочки в соответствующих чек-боксах.
1) В Верхней части страницы настроек имеется возможность включить подсветку свечей в цветах Хейкен Аши. При этом все хаи, лои, открытия и закрытия останутся классическими. Кроме-того добавлена скользящая средняя для определения тренда, которая строится на основе свечей Хейкен Аши.
2) В середине страницы настроек имеется возможность включить индикатор "Полярное сияние", в честь которого назван индикатор/ Он не является свечами хейкен аши, но строится на основе этих свечей и помогает определить тренд.
3) В нижней части страницы настроек можно изменять цвет свечей/сияния

Ghost Ninja Moving Average by HassonyaThe Ghost Ninja Moving Average indicator contains three ema averages. These are ema 21, ema 55 and ema 233.
The values of the averages appearing on the screen are adjusted according to their own lengths. If you want, you can change the settings from the "Numbers of bars back" setting.
The 1st moving average (EMA-21) will follow the price and will disappear if the price is above it. It will only appear where needed.
The 2nd moving average (EMA-55) will be red if not orange when EMA-21 is greater than EMA-55.
The 3rd moving average (EMA-233) will appear if EMA-55 is greater than it, otherwise it will not.
The system will also display Golden and Death crosses.
I hope you will be satisfied using it. Yours sincerely. Happy Trading
TÜRKÇE AÇIKLAMA
Ghost Ninja Hareketli Ortalama indikatörü, üç adet ema ortalaması barındırıyor. Bunlar ema 21, ema 55 ve ema 233 tür.
Ortalamaların ekranda gözükme değerleri, kendi uzunluklarına göre ayarlanmıştır. İsterseniz ayarları "Numbers of bars back" ayarından değiştirebilirsiniz.
1nci hareketli ortalama olan (EMA-21), fiyatı izleyerek eğer fiyat onun üzerindeyse gözükecek değilse yok olacak. Sadece gerektiği yerlerde gözükecek.
2nci hareketli ortalama(EMA-55), EMA-21 EMA-55'ten büyük olduğunda turuncu değilse kırmızı olacak.
3ncü hareketli ortalama(EMA-233), Eğer EMA-55 ondan büyükse gözükecek yoksa gözükmeyecek.
Sistem aynı zamanda Golden ve Death crossları da gösterecek.
Güle güle kullanın. Bereket bulun. Sevgiler

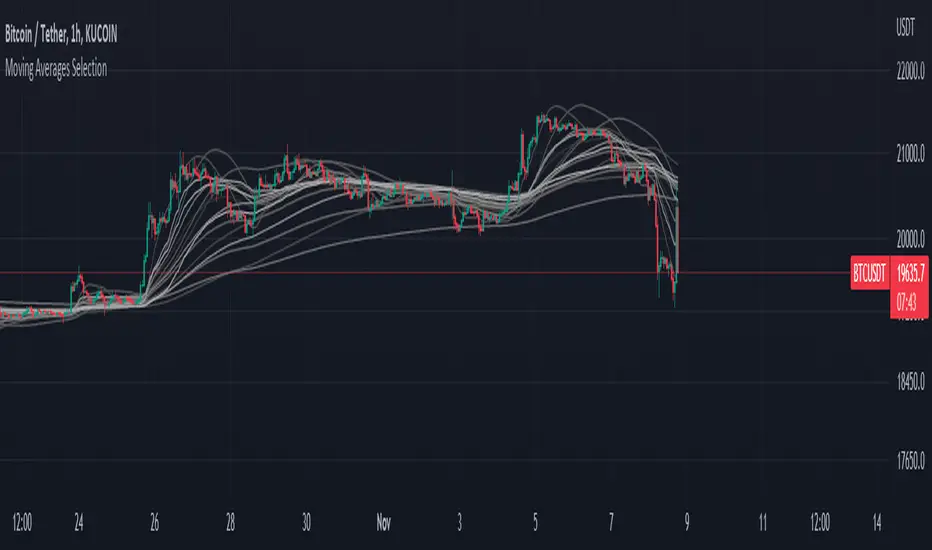
Moving Averages SelectionHello everyone, I present my first script. In it I collect a group of fully configurable moving averages, both in color, value and selection of the ones we want to observe.
The moving averages I collect are 3 of each of the following types:
EMA: An exponential moving average ( EMA ) is a type of moving average (MA) that places a greater weight and significance on the most recent data points.
SMA: It is simply the average price over the specified period. The average is called "moving" because it is plotted on the chart bar by bar, forming a line that moves along the chart as the average value changes.
HMA: The Hull Moving Average ( HMA ) attempts to minimize the lag of a traditional moving average while retaining the smoothness of the moving average line. Developed by Alan Hull in 2005, this indicator makes use of weighted moving averages to prioritize more recent values and greatly reduce lag.
RMA: The Rolling Moving Average, sometimes referred to as "Smoothed Moving Average", gives the recent prices most weighting, though the historic prices are also weighted, each given less weighting further back in time.
WMA: The weighted moving average ( WMA ) is a technical indicator that traders use to generate trade direction and make a buy or sell decision. It assigns greater weighting to recent data points and less weighting on past data points.
I am open to any opinion and advice for improvement, greetings, I hope you find it useful :)
Rolling MACDThis indicator displays a Rolling Moving Average Convergence Divergence . Contrary to MACD indicators which use a fix time segment, RMACD calculates using a moving window defined by a time period (not a simple number of bars), so it shows better results.
This indicator is inspired by and use the Close & Inventory Bar Retracement Price Line to create an MACD in different timeframes.
█ CONCEPTS
If you are not already familiar with MACD, so look at Help Center will get you started www.tradingview.com
The typical MACD, short for moving average convergence/divergence, is a trading indicator used in technical analysis of stock prices, created by Gerald Appel in the late 1970s. It is designed to reveal changes in the strength, direction, momentum, and duration of a trend in a stock's price.
The MACD indicator(or "oscillator") is a collection of three time series calculated from historical price data, most often the closing price. These three series are: the MACD series proper, the "signal" or "average" series, and the "divergence" series which is the difference between the two. The MACD series is the difference between a "fast" (short period) exponential moving average (EMA), and a "slow" (longer period) EMA of the price series. The average series is an EMA of the MACD series itself.
Because RMACD uses a moving window, it does not exhibit the jumpiness of MACD plots. You can see the more jagged MACD on the chart above. I think both can be useful to traders; up to you to decide which flavor works for you.
█ HOW TO USE IT
Load the indicator on an active chart (see the Help Center if you don't know how).
Time period
By default, the script uses an auto-stepping mechanism to adjust the time period of its moving window to the chart's timeframe. The following table shows chart timeframes and the corresponding time period used by the script. When the chart's timeframe is less than or equal to the timeframe in the first column, the second column's time period is used to calculate RMACD:
Chart Time
timeframe period
1min 🠆 1H
5min 🠆 4H
1H 🠆 1D
4H 🠆 3D
12H 🠆 1W
1D 🠆 1M
1W 🠆 3M
You can use the script's inputs to specify a fixed time period, which you can express in any combination of days, hours and minutes.
By default, the time period currently used is displayed in the lower-right corner of the chart. The script's inputs allow you to hide the display or change its size and location.
Minimum Window Size
This input field determines the minimum number of values to keep in the moving window, even if these values are outside the prescribed time period. This mitigates situations where a large time gap between two bars would cause the time window to be empty, which can occur in non-24x7 markets where large time gaps may separate contiguous chart bars, namely across holidays or trading sessions. For example, if you were using a 1D time period and there is a two-day gap between two bars, then no chart bars would fit in the moving window after the gap. The default value is 10 bars.
//
This indicator should make trading easier and improve analysis. Nothing is worse than indicators that give confusingly different signals.
I hope you enjoy my new ideas
best regards
Chervolino
