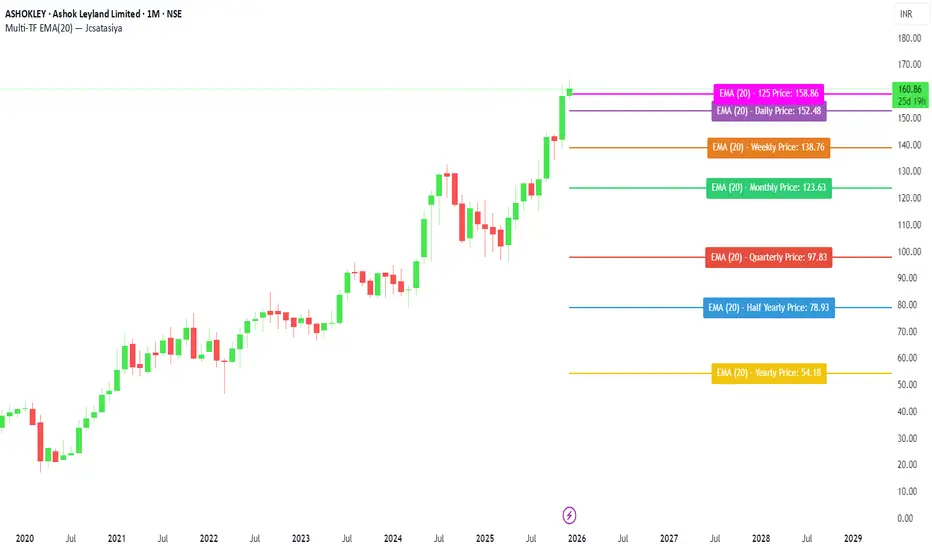
Multi-TF EMA(20) — JcsatasiyaOverview
This indicator plots 7 multi-timeframe EMA(20) lines on any chart and displays a clean dynamic label for each EMA showing:
Full timeframe name (Yearly, Half-Yearly, Quarterly, Monthly, Weekly, etc.)
EMA(20) value formatted with exactly 2 decimals
A label that is positioned automatically to the right of the latest candle
White text for maximum readability
Color-coded lines for each timeframe
All EMA lines extend horizontally and update in real-time when new candles form on the selected timeframes.
✅ Key Features
• 7 Custom Timeframes
Choose any timeframe for each EMA (Yearly, 6-Month, 3-Month, Monthly, Weekly, Daily, 4H, etc.)
• Horizontal EMA Levels
Each EMA is drawn as a fixed horizontal level, making structure and bias easier to analyze.
• Dynamic Label Placement
Labels automatically position:
Horizontally: Left, Middle, or Right of the right-side future area
Vertically: Above, Middle, or Below the EMA line
• Clean Readable Labels
Always white text
Shows: EMA (20) – Timeframe Price: 123.45
Price always displays with 2 decimals
Label style auto-adjusts based on position
• Color Customization
Each timeframe EMA has its own color picker.
• All EMA Thickness Unified
Set one line thickness for all EMA lines.
• Reliable Multi-TF Accuracy
Uses request.security() with proper lookahead handling.
⭐ Why This Indicator Is Useful
This tool makes it extremely easy to visualize where your chart sits relative to major multi-timeframe EMA levels.
You immediately see:
Higher-timeframe trend direction
Bias zones
Key support/resistance EMA levels
Long-term vs short-term trend alignment
Price interaction with institutional EMAs
Perfect for day traders, swing traders, and position traders.
📘 HOW TO USE
1️⃣ Add to Chart
After adding the indicator, open the Settings → Inputs panel.
2️⃣ Choose the 7 Timeframes
For each slot, select your desired timeframe (example setup):
Yearly
Half Yearly
Quarterly
Monthly
Weekly
Daily
4H
3️⃣ Customize Colors
Pick a different color for each EMA for clarity.
4️⃣ Choose Label Placement
Use the label position controls:
Vertical: Upper / Middle / Below
Horizontal: Left / Middle / Right (relative to right-side future space)
5️⃣ Adjust Line Thickness (Optional)
A single slider controls the thickness of all 7 EMAs.
📝 NOTES
The indicator places labels 2–50 bars into the future depending on chosen position.
Labels are always visible and readable due to white text.
EMA values always show exactly two decimals, even for crypto, indices, and forex.
Works on any market and any chart timeframe.
移动平均线
All of MAsCustom indicator with my favorite multiple MAs.
Can switch to different timeframe source.
Default SMAs:
9
20
50
50 @ 2min
200
200 @ 2min
400 @ 2min
800

All Macro LevelsA comprehensive overlay indicator that displays key macro-level support and resistance zones using widely-followed moving averages across multiple timeframes.
Features
Bull Market Support Band (BMSB)
- Weekly 20 SMA and 21 EMA with customizable fill
- A popular indicator for identifying bull market trends - price holding above the band typically signals strength
Daily 12/21/25 EMA Bands
- Three daily EMAs (12, 21, 25) with fill between the outer bands
- Useful for tracking short-term momentum and trend direction
Long-Term Weekly Moving Averages
- 100-Week MA - Intermediate cycle support
- 200-Week MA - Major cycle support level
- 300-Week MA - Deep value zone
- Each MA can be configured as SMA or EMA
Customization
- Toggle each indicator group on/off independently
- Full color customization for lines, fills, and labels
- Adjustable line widths
- Optional custom symbol input to display levels from a different asset
- Real-time labels showing current values at chart edge
Use Cases
- Identify macro support/resistance levels
- Spot potential buy zones during corrections
- Confirm bull/bear market conditions
- Multi-timeframe analysis on a single chart

QuantumFlowTrader V1QuantumFlowTrader V1 — Adaptive Institutional Flow Framework
Overview
QuantumFlowTrader V1 is a precision-built visual tool that fuses institutional structure, dynamic volatility, and balance zones into one unified system.
It is designed to help traders align with the market’s internal flow without relying on lagging indicators or fixed settings.
Core Components
1. Adaptive EMA Clouds — Structural Flow
Layered exponential moving averages adapt to current conditions, clearly showing when market structure is aligned or in transition. Cloud color and intensity adjust automatically to reflect real-time directional bias.
2. Dynamic VWAP + Deviation Zones
Includes a self-adjusting VWAP with optional deviation bands (VWAP Deviation Zones) that reflect institutional fair-value areas — places where price often reacts, pauses, or mean-reverts.
The VWAP line shifts color based on price positioning.
3. Quantum ATR Engine — Multi-Layer Volatility Sync
A proprietary multi-ATR engine detects when volatility signals align in one direction across multiple sensitivities.
Arrows appear only on full directional agreement, signaling high-conviction flow moments.
4. Session Visualization + Arrow Filtering
Background shading highlights key trading sessions (Asia, London, USA).
You can optionally disable arrow signals during specific sessions for a cleaner view.
Features & Alerts
- Toggle EMA Clouds, VWAP, Deviation Zones, and ATR Arrows independently.
- Customize all colors, transparencies, and visual styles.
- Built-in alerts for bullish and bearish arrow signals.
Compatibility
Works on all assets: Forex, Crypto, Stocks, Indices, Futures.
Fully adaptive across all timeframes — intraday to swing.
No optimization needed — smart parameters adjust automatically.
Strategy Alignment Tip
QuantumFlowTrader V1 adapts to any trading strategy and acts as a directional compass for market flow.
It becomes especially powerful when combining multiple timeframes — for example, using the 1H and 15M charts to define trend alignment, and then executing entries on lower timeframes in the direction of that flow.
Note: Entry setups are defined by each trader’s individual system.
This indicator does not provide entry points — it highlights multi-timeframe alignment and directional bias.
To request access, contact via TradingView profile.

Smart MACD Crossover█ OVERVIEW
Smart MACD Crossover is an indicator designed for traders who trade based on MACD line crossovers. It significantly reduces the number of false crossover signals by adding a breakout-box confirmation mechanism. Price must close outside the box created at the moment of the MACD crossover for a signal to trigger. The script also includes optional scaled MACD lines on the price chart, candle coloring, multi-layer “fog” visualization, fully customizable entry signals, automatic Take Profit / Stop Loss levels and a real-time table.
█ CONCEPTS
Standard MACD crossovers frequently produce noise, especially in ranging markets. Smart MACD Crossover attempts to solve this issue: a horizontal box is drawn at the exact bar where the crossover occurs, and a trade signal is generated only when price actually breaks out of that box. By default, the show_only_matching filter is enabled — signals are shown only when the breakout direction matches the original MACD crossover direction (bullish box → long only, bearish box → short only).
█ FEATURES
Fully configurable classic MACD (default 12/26/9)
Optional MACD & Signal lines scaled and plotted directly on the price chart (show_macd_overlay)
Trend-based candle coloring
One-Side Histogram Fog:
- 6 layers above and 6 layers below hl2
- layer height based on average candle size × offset_mult (default 0.7)
- increasing transparency (base 80 + increment 4) for depth effect
- fully customizable colors
Breakout Boxes:
- created on every MACD crossover
- default height = high-low of the signal candle
- optional extension using average candle size × box_multiplier
- semi-transparent fill (85) with colored borders, extended right until breakout
Signals:
- Triangles or “BUY” / “SELL” labels
- show_only_matching filter (enabled by default) — only direction-consistent breakouts generate signals
- when disabled, every box breakout generates a signal according to breakout direction
- Built-in alerts: BUY and SELL
Take Profit / Stop Loss:
- TP1, TP2, TP3 and SL levels drawn automatically after each confirmed signal
- two modes: Candle Multiplier (based on average candle size) or Percentage
- all multipliers/percentages fully adjustable in “Risk Management Settings”
- real-time table in the top-right corner showing current TP/SL prices
█ HOW TO USE
Add via Pine Editor → paste code → Add to Chart.
Settings overview:
- MACD Settings: lengths and source
- Risk Management Settings: TP/SL mode, multipliers/percentages, average candle period
- MACD Overlay Lines: toggle scaled MACD lines on price chart
- Fog: enable/disable, adjust height and transparency
- Visual Settings: candle coloring
- Boxes: optional size multiplier (use_box_multiplier)
- Signals: choose Triangles or Labels, enable/disable direction filter
Signal meaning:
- Triangle below bar / “BUY” label → upward breakout from a box created after bullish MACD crossover
- Triangle above bar / “SELL” label → downward breakout from a box created after bearish MACD crossover
- Open boxes = pending breakout zones
- Fog below price = bullish pressure, fog above price = bearish pressure
█ APPLICATIONS
The indicator reduces false signals coming from plain MACD crossovers. For additional trend confirmation, the scaled MACD lines can be enabled.
Entry into a position is triggered by the BUY/SELL signal generated after the breakout. The TP1–TP3 and SL levels are drawn automatically only for convenience and as a quick reference – they are fully optional and traders can (and usually should) use their own preferred exit strategies, trailing stops, partial closes, or other money-management methods.
█ NOTES
- Due to MACD line scaling onto the price chart, classic MACD divergences cannot be identified

EMA Cloud TrendEMA Cloud Trend (Dual-Layer)
A clean and popular two-layer EMA cloud indicator:
• Inner cloud (EMA 8 – EMA 18): Bright yellow with 80% transparency
• Outer cloud (EMA 18 – EMA 36): Green (bullish) or Red (bearish) with 70% transparency
Trend direction is determined by the position of the fast EMA (8) relative to the slow EMA (36):
- Green outer cloud → Bullish bias
- Red outer cloud → Bearish bias
Fully transparent design that doesn’t hide price action. Perfect for trend confirmation, swing trading, and as a visual background filter.
Lightweight • No repainting • Works on all markets and timeframes
Enjoy the clouds!
EMA Cloud Trend (Çift Katmanlı)

BTC STH Proxy vs Realized Price (RP) Ratio | STH : LTH📊 REALIZED PRICE MARKET SIGNAL
Indicator that builds a Short-Term Holder (STH) price proxy using a configurable moving average of Bitcoin’s market price and compares it to Bitcoin’s Realized Price (RP) derived from on-chain data.
Realized Price (RP) is calculated from CoinMetrics Realized Market Cap divided by Glassnode circulating supply.
STH Proxy is a user-defined moving average (EMA/SMA/WMA) of BTC price, designed to mimic the behavior of the true STH Realized Price.
Users can adjust the MA type, length, and RP smoothing to closely replicate the STH curve seen on Glassnode, Bitbo, and Bitcoin Magazine Pro.
Optionally, the indicator can display the STH/RP ratio, which highlights transitions between market phases.
This tool provides a simple but effective way to visualize short-term vs long-term holder cost-basis dynamics using only publicly accessible on-chain aggregates and price data.
----------
💡TLDR: An alt take on the Short-Term Holder Realized Price / Long-Term Holder Realized Price cross model | (STH/LTH cross)
- A mix of MAs are used to mimic STH.
- RP here used as a proxy for the long-term holder (LTH) cost basis.
- Bull/Bear signals are generated when the STH proxy crosses above or below RP.
⭐ Free to use • Leave feedback • Happy trading!

Price Action Strategy v2.0 [Ista]💎 Overview
Price Action Strategy v2.0 is a comprehensive, all-in-one institutional trading toolkit designed for visual traders who demand precision. Unlike standard indicators, this tool focuses on the narrative of price by combining advanced Market Structure, Institutional Order Flow, and Predictive Analytics into a single, non-cluttered interface.
The core philosophy of this script is "Clean Precision". It filters out noise and presents only the most critical decision-making data via smart chart overlays and a state-of-the-art Analytic Dashboard.
🚀 Key Features
1. 🏛️ Institutional Order Blocks (Origin Scan Engine)
This is not a standard pivot-based OB indicator. We utilize a proprietary "Origin Scan" algorithm that:
Detects the exact origin candle responsible for a structural break (BOS).
Filters out weak blocks, keeping only the most significant institutional footprints.
Smart Management: Limits active blocks to the 3 most recent per side (Support/Resistance) to keep charts clean.
Ghost Mode: When an Order Block is broken, it doesn't just disappear; it turns into a faint "Ghost" level, allowing you to see historical reactions without visual clutter.
2. 🔮 Echo Forecast (Predictive Path)
A powerful forecasting engine based on Pattern Similarity:
Scans historical price action (Evaluation Window) to find patterns mathematically similar to the current market state.
Projects the most likely future path (Forecast Window) directly onto the chart.
Uses a cumulative calculation method to smooth out noise and provide a realistic trajectory.
Visual Coding: The forecast line thickens and changes color based on the Confidence Score (Correlation %). High confidence patterns (>80%) are highlighted in deep green.
3. 📊 ISTA Command Center (Analytic Dashboard)
A professional, compact, and right-aligned dashboard that acts as your trading HUD. It monitors 8 vital market vitals in real-time:
Market Structure: Real-time Swing trend direction.
HTF Trend: Higher Timeframe bias (Price Action based).
Momentum: Current & HTF RSI status (Overbought/Oversold).
MACD: Signal crossover status.
Smart Money Flow (MFI): Detects institutional accumulation/distribution.
Volatility (ATR%): Current market volatility percentage.
Forecast Confidence: The statistical reliability of the current Echo Forecast.
4. 📉 Dynamic EMAs
Includes three key moving averages (20, 200, 1440) with dynamic transparency logic. They fade into the background when not interacting with price, ensuring they are there when you need them but invisible when you don't.
🛠️ How to Use
Identify Trend: Look at the Dashboard. If Structure and HTF Trend align (e.g., both Bullish), look for longs.
Wait for Pullback: Wait for price to return to a Bullish Order Block.
Confirm: Check the Forecast line. Does it suggest a bounce? Check MFI and RSI on the dashboard for oversold conditions.
Execute: Use the Order Block edges for precise entry and invalidation points.
⚙️ Settings
Swing Length: Adjust sensitivity of the structure (Default: 10).
Evaluation Window: How far back the Echo Forecast looks for patterns (Default: 300).
Dashboard: Fully customizable position and size.
Developed by Soheil_kheiri | Ista Web Analytics

that1618guy EMA 9/21 Crossover ETA + ProjectionCrossover ETA + Projection to estimate when the 9 crosses the 21 and vice versa
Uses the cross up and cross down on HTF to validate trending moves

Ind-Suite: The Ultimate Strategic Dashboard [Gap/Dow/MA/SR]概要 Ind-Suiteは、トレードに必要な4つの重要な要素(窓、市場構造、移動平均線、水平線)を1つのインジケーターに統合した包括的なトレーディング・スイートです。 このツールの目的は、単一のサインに頼るのではなく、複数の根拠が重なる「コンフルエンス(Confluence)」を視覚的に発見することにあります。
機能モジュール 設定画面の「⚡ MODULE TOGGLES ⚡」から、各モジュールのON/OFFを瞬時に切り替えられます。
Module A: Gaps (窓)
未埋めの窓(Gap)をボックスで表示します。
価格が引き寄せられるターゲットとして機能します。一定期間経過した窓は自動的に非表示になります。
Module B: Dow Structure (ダウ理論と構造)
ZigZagラインによる波の描画と、トレンド状態の判定。
BOS (Break of Structure): トレンド継続のブレイクポイントにラベルを表示。
下落トレンド時は背景色が変化し、視覚的にトレンドを把握できます。
Module C: Safe Scaffold (足場と勢い)
EMA (9/20) & VWAP: トレンドフォローのための主要な移動平均線。
Bollinger Bands: ボラティリティの確認用(ON/OFF可能)。
Signal: EMAクロスとバンド幅拡大(スクイーズからのエクスパンション)を検知したロングサインを表示。
Module D: S/R Guardian (水平線)
過去のPivot点をベースに、意識されやすいサポート・レジスタンスラインを自動描画します。
強度に基づいてラインが統合され、重要度が高い価格帯を可視化します。
推奨される使い方 すべてのモジュールを常にONにする必要はありません。チャートが情報過多にならないよう、必要な機能だけを選択して表示してください。 例えば、「S/Rライン」での反発、「Dow Structure」でのBOS、「Gap」の埋め完了など、3つ以上の根拠が重なるポイントは、優位性の高いエントリーポイントとなります。
--------------
Overview Ind-Suite is a comprehensive trading suite that integrates four essential elements (Gaps, Market Structure, Moving Averages, and Support/Resistance) into a single indicator. The goal of this tool is not to rely on a single signal, but to visually identify "Confluence" where multiple factors align.
Feature Modules You can instantly toggle each module ON/OFF via the "⚡ MODULE TOGGLES ⚡" in the settings.
Module A: Gaps
Highlights unclosed gaps with boxes.
These act as price magnets/targets. Old gaps are automatically hidden after a set period.
Module B: Dow Structure (Trend & Market Structure)
Draws ZigZag waves and determines trend status based on pivot points.
BOS (Break of Structure): Labels are displayed at key breakout points confirming trend continuation.
Background color changes during downtrends for instant visual recognition.
Module C: Safe Scaffold (Momentum & MAs)
EMA (9/20) & VWAP: Key moving averages for trend following.
Bollinger Bands: For volatility analysis (Toggle available).
Signal: Displays Long signals upon EMA crossover combined with BBW expansion (volatility breakout).
Module D: S/R Guardian (Support & Resistance)
Automatically draws S/R zones based on historical pivot points.
Levels are merged based on proximity, visualizing significant price zones.
Recommended Usage It is not necessary to keep all modules ON at all times. Toggle features as needed to keep your chart clean. High-probability setups are often found where multiple factors converge (Confluence). For example: A bounce off an "S/R Line," confirmed by a "BOS" in Dow Structure, coinciding with a "Gap" fill.

50 EMA HLC Tejas50 EMA with All important sources. Made it with 50 EMA and Based on my understanding and observations.

Hull Moving Averages x 4Default Hull Lengths Included
The defaults are:
HMA 14
HMA 35
HMA 55
HMA 89
These are classic Fibonacci-style progression lengths, which work well for trend structure.

BEM Scalping & Trend Continuation ToolThe BEM Scalping & Trend Continuation Tool highlights 3-candle pullback structures into moving averages and visualizes potential continuation areas within ongoing trends. The script includes two pullback detectors using configurable moving averages, a trend-direction average, VWAP, signal markers, and dynamic swing-level tracking. These elements are designed to support visual analysis of short-term momentum, pullbacks, and structural behavior across different markets and timeframes.
How It Works:
The script identifies descending 3-bar patterns (for bullish pullbacks) and ascending 3-bar patterns (for bearish pullbacks). Pullbacks are highlighted when they interact with a selected moving average and meet additional structural criteria. Optional markers plot when such patterns occur.
Swing levels are detected using pivots, extended forward, and removed when invalidated.
Intended Use:
This tool supports discretionary and rule-assisted chart analysis by highlighting pullbacks, trend context, and market structure. It does not generate predictions or financial advice, and its signals do not imply performance or outcomes.
⭐ Core Features
1️⃣ Highlighted Pullback Bars (Fast + Deep Retracements)
The tool uses two customizable moving averages:
MA1 (default 9) → Fast trend pullback
MA2 (default 45) → Deeper retracement pullback
The script highlights candles when the price creates a structured 3-bar pullback into either moving average. Colors automatically reflect bullish or bearish continuation conditions.
2️⃣ Trend Direction Filter
A longer moving average (default 102) provides directional bias.
This helps traders visually stay aligned with the dominant trend.
3️⃣ VWAP Integration
VWAP is included as a dynamic institutional support/resistance level.
Useful for intraday bias, mean reversion, and trend continuation confluence.
4️⃣ Automated Pullback Signals
Triangle signals appear when a pullback meets all conditions:
Bullish/Short-term long
Bearish/Short-term short
Deep Bullish pullback (MA45)
Deep Bearish pullback (MA45)
These optional markers provide clear visual confirmation.
5️⃣ Smart Swing Lines (Auto-Structure Tracking)
Swing highs and lows are automatically detected and projected forward.
Broken levels self-remove to keep the chart clean.
Great for structure trading, liquidity analysis, and break-of-structure confirmation. To help identify the best possible scenario for the trend continuation pullback work A+.
🔍 How the Pullback Logic Works
The BEM Scalping & Trend Continuation Tool uses a 3-bar structural pattern:
Bullish Pullback Pattern
The High of the first candle needs to be higher than the second one, and the high of the second needs to be higher than the third, moving down in a pullback to the moving average.
Price wicks into MA
Open above MA (rejection)
Continuation expected upward
Bearish Pullback Pattern
The Low of the first candle needs to be lower than the second one, and the low of the second one needs to be lower than the third one, moving upward to the moving average.
Price wicks into MA
Open below MA (rejection)
Continuation expected downward
Bars are highlighted in different colors based on MA1(fast) or MA2(slow and deeper) pullback.
📘 How to Trade the System (Optional Use Case)
(Not predictive; for discretionary workflow support.)
LONG Scenario
Price above Trend MA
Price above VWAP (optional confluence)
Gold (MA9) or Blue (MA45) bullish pullback highlight
Bullish triangle plotted
Entry: candle close or break of signal candle high
Stop: below MA or swing low
Target: next liquidity level, swing high, or trail with MA9
SHORT Scenario
Price below Trend MA
Price below VWAP
Purple (MA9) or Deep Violet (MA45) bearish pullback highlight
Bearish triangle plotted
Entry: candle close or break of signal candle low
Stop: above MA or swing high
Target: next swing low or break structure
*
This tool is for charting and better visualization of pullback and trend continuation only.
It does not guarantee profits.
Always combine with proper risk management.

Weeknights Guppy Trend Strength OscillatorBuilt a Guppy Oscillator which takes 22 different EMA's and uses an ATR to provide slope normalisation. The goal is to help the user determine strength of trend and see if momentum is slowing
On its own I doubt it will provide a full trading system but I believe it can help provide confluence to ones trading decisions
Left it open source

CapitalFlowsResearch: PEMACapitalFlowsResearch: PEMA — Price Extension
CapitalFlowsResearch: PEMA is a visual regime indicator that measures how far price is trading from its dynamic equilibrium and translates that behaviour into a clean, colour-coded background. Instead of simply showing whether price is above or below a moving average MA, the tool evaluates how unusual that distance is relative to recent behaviour, creating a normalized “extension score” that adapts across assets and timeframes.
The indicator then highlights periods where price enters meaningful positive or negative extension zones, using customizable thresholds and optional smoothing to control signal sensitivity. The result is a subtle but powerful overlay that helps reveal when markets are operating in balanced conditions, when they’re stretched, and when early signs of exhaustion or continuation may be emerging—without cluttering the chart or exposing the underlying mechanics.

Multi-Filter & RSI Overheat Analyzer (Invite Only)🚀 Multi-Filter & RSI Overheat Analyzer (Invite Only)
The Trend-RSI Pro is an advanced, multi-layered analysis tool designed for invite-only subscribers. Its primary function is to provide an instant, high-conviction visual filter of current market conditions by combining three essential technical analyses: EMA trend direction, ADX trend strength, and RSI overbought/oversold momentum.
💡 Key Features and Analysis Logic
This indicator simplifies complex market structure analysis by using a dynamic Background Color filter. The color instantly tells the user the dominant market state, eliminating the need to manually check multiple windows.
The background turns Teal when the Exponential Moving Averages (EMA) are in a strong Bullish Alignment (Short > Medium > Long) and the ADX value exceeds the user-defined Strength Threshold (default 25.0), confirming a Strong Uptrend. Conversely, the background turns Red when the EMAs are in a strong Bearish Alignment (Short < Medium < Long) and the ADX confirms a Strong Downtrend. Any other combination of EMA alignment or a weak ADX reading results in a Gray background, which alerts the user to a Ranging, Weak, or Transitional Market where caution is advised.
To complement the trend analysis, the indicator features RSI Overheat Alert Icons to preemptively analyze potential trend exhaustion. When the Relative Strength Index (RSI) enters the Overbought zone (default >= 70.0), a Red Triangle Down appears above the price bar, warning of potential selling pressure. Conversely, when the RSI enters the Oversold zone (default <= 30.0), a Green Triangle Up appears below the price bar, suggesting potential buying interest.
For users who wish to confirm the underlying components, the indicator also plots the three EMA Lines (Short, Medium, Long) directly on the chart, and the raw ADX Value is plotted in a separate pane, allowing for detailed tracking of strength changes over time. All key parameters, including EMA periods, ADX thresholds, and RSI limits, are fully customizable in the settings.
⚠️ Disclaimer and Usage Guideline
This tool is strictly an analytical aid and not a trading signal or financial advice. Users should utilize the Background Color as their primary context filter, only seeking trades aligned with the indicated strong trend color. The RSI alerts serve as timely warnings for potential short-term reversals within a larger trend. Trading carries substantial risk, and this indicator must always be combined with the user's independent analysis and robust risk management strategies.

Bravfaux 9 Kit ProBravfaux 9 Kit Pro — The Cleanest, Meanest, Purple-Drenched Trend & Reversal System on Trading View
Built from the ground up for traders who want zero lag, crystal-clear signals, and that signature purple aesthetic.
What’s inside & what each piece actually does:
1. Bravfaux 9 Ribbon (the glowing magenta line that hugs the 9 SMA)
• Ultra-responsive 3rd-generation TEMA-style calculation (the real “secret sauce” Bravo 9)
• Acts as dynamic micro-support/resistance and early warning for momentum shifts
• When price rides the ribbon → trend is strong. When it diverges → exhaustion coming.
2. 9 SMA & 200 SMA (aqua + white)
• Your classic trend filters. Price above both = bullish bias, below both = bearish bias.
3. Fauxrple Nurple Clouds (those huge purple/blue clouds)
• Visual exaggeration of 20-period Bollinger Bands using an auto-adjusting Fibonacci multiplier (1.9× on 1–3 min charts up to 3.0× on daily+)
• Price kissing the very tip of the cloud = “Nurple Zone” → highest-probability reversal area
• Actual entry triggers fire only when price closes outside the hidden fib bands (not the visible clouds).
4. Bravfaux 9 Counter (7-8-9 labels)
• Counts consecutive bars price stays on the correct side of the 9 SMA after a cross
• 7–8–9 sequence = institutional momentum confirmed
• The legendary “9” label is the single highest win-rate signal in the entire kit.
5. Whale Alerts (green/red “W”)
• Fires only when price has already done 7–9 Bravfaux count + a massive volume spike + candle body > 1.8× ATR
• These are the real “smart money” absorption candles everyone tries to catch.
6. Fauxrple Nurple Triangles (big purple arrows)
• The money printer: triggers only on a completed Bravfaux 9 count + close outside the hidden fib band
• LONG = purple triangle below bar (short-term reversal to upside)
• SHORT = purple triangle above bar (short-term reversal to downside)
• Historically 75–85 % win rate on 5-min and higher timeframes when used with confluence.
7. Purple Trend / Reversal Candles
• Triple-smoothed T3-based coloring (closest public version of the original purple candle logic)
• Bars turn bright magenta when extreme momentum meets hidden mean-reversion → very high-probability reversal or continuation candle.
8. Auto Fib Multiplier
• Automatically scales the hidden fib-band distance based on time frame so the Nurple signals stay perfectly calibrated from 1-minute scalping to daily swings. You can also override manually.
All alerts included:
• Fauxrple Nurple LONG / SHORT
• Whale Buy / Sell
• Purple Reversal Candle
Zero repainting. Zero lag on the signals that matter. Pure price + volume + momentum.
If it’s glowing purple and throwing 9s and triangles — you already know what time it is.
Welcome to the Bravfaux 9 Kit Pro.

MA Distance RibbonMA Distance Ribbon – Premium Multi-MA Deviation Oscillator
This indicator displays the real-time distance (in price units) between the current price and 10 different moving averages (periods 20 to 200, step 20) in a separate pane below the chart.
Key Features
10 simultaneous deviation lines forming a smooth, colorful “ribbon”
Instant visual feedback:
Green shades = price is below the MA (potential oversold / bullish momentum)
Purple/Magenta shades = price is above the MA (potential overbought / bearish pressure)
Gradient transparency: shorter periods = bolder colors, longer periods = softer tones for perfect visual hierarchy
Supports SMA, EMA, WMA, HMA and VWMA
Clean zero line + elegant info table showing current distance for each period
No clutter on the price chart (overlay=false)
How to use
Ribbon expanding upward in purple → strong bullish momentum, possible over-extension
Ribbon expanding downward in green → strong bearish momentum, possible oversold condition
Convergence toward zero → price returning to equilibrium with the selected MAs
Works excellently as a trend-strength filter, mean-reversion signal source or overbought/oversold confirmation tool
Perfect for scalpers, swing traders and algo developers who want a clear, beautiful and highly informative deviation panel.
Clean code | Professional look | Instant insight
MA Distance Ribbon – see the hidden pulse behind every moving average.

EMA Signals + HTF S/R + Diagonal (5-15m)Описание на русском
Скрипт строит две экспоненциальные скользящие средние (быструю и медленную EMA), а также SMA20 и SMA50, и использует их для генерации пошаговых сигналов входа. При пересечении EMA9 и EMA12 вверх выше SMA20 под свечой появляется зелёный круг, а когда после этого обе EMA оказываются выше SMA50, под ценой появляется плашка LONG; аналогично при пересечении вниз ниже SMA20 рисуется красный круг над свечой, и после ухода EMA под SMA50 формируется плашка SHORT.
Горизонтальные зоны поддержки и сопротивления вычисляются по пивотам старшего таймфрейма (по умолчанию 1 час) через request.security, каждая зона рисуется прямоугольником на графике и сопровождается подписью с ценой уровня и текущим количеством касаний ценой (Touches: N), которое считается на активном ТФ. Дополнительно скрипт строит одну диагональную линию поддержки: она протягивается от последнего ключевого минимума (pivot low с заданной «силой») к текущей цене и динамически обновляется при появлении нового важного минимума, рядом с линией отображается подпись Trend.
Description in English
This script combines EMA‑based signals, dynamic higher‑timeframe support/resistance zones, and a diagonal trendline from the latest key swing low. It plots two exponential moving averages (fast and slow EMA) along with SMA20 and SMA50, and uses them to create step‑by‑step entry signals: when EMA9 crosses above EMA12 while both are above SMA20, a green circle is shown below the bar, and once both EMAs move above SMA50 after that, a LONG label is printed below price; conversely, when EMA9 crosses below EMA12 while both are below SMA20, a red circle appears above the bar, and after both EMAs move below SMA50, a SHORT label is displayed above price.
Horizontal support and resistance zones are derived from pivot highs and lows on a higher timeframe (1‑hour by default) using request.security; each zone is drawn as a rectangle on the chart and annotated with the level price and the current number of touches by price (Touches: N), counted on the active timeframe. In addition, the script plots a single diagonal support line from the most recent key swing low (pivot low with configurable strength) towards the current price, updating it whenever a new important low appears, and shows a small “Trend” label near this line

VWAP + EMA9 + RSI Scalping (Edu)VWAP + EMA9 + RSI Scalping (Edu) is an intraday scalping indicator combining VWAP, EMA9 and RSI to identify high-probability long and short entries. Designed for low timeframes (1m–5m), it aligns micro-trend and momentum to generate clean and fast setups. Works on stocks, indices, forex and crypto.

MACD Above Signal & Price Above VWAP IndicatorThis strategy provides a buy signal with a green arrow pointing up when three conditions are met. The MACD has to be above the signal line. The settings for MACD can be adjusted, but the default is the standard settings for MACD. The second condition is the price has to be above the VWAP line. The third condition is that the price of the current candle needs to be higher than the HIGH price of the previous candle.

Price Action Signals Filtered +EMA🚀 Price Action Signals Filtered + EMA (Dual Confirmation)
💡 Indicator Overview
This indicator is a powerful tool designed to identify potential trend reversals or continuations using Price Action Pivot signals, but it filters them with an Exponential Moving Average (EMA) to ensure dual confirmation.
The indicator's purpose is to generate signals only when a Price Action confirmation aligns with a confirmed market trend (above or below the EMA), thereby reducing noise and increasing signal reliability.
✨ Key Features and Logic
1. Price Action (Pivot) Detection
The indicator automatically detects local low (Pivot Low) and local high (Pivot High) points.
Pivot Low: A potential market bottom.
Pivot High: A potential market top.
2. Price Action Confirmation
After a Pivot is detected, the indicator waits for subsequent confirmation from the closing prices of the candles:
Bullish Confirmation: After a Pivot Low, the indicator requires N consecutive candles (where N is defined in the settings) to close above the previous candle's close. This indicates buying pressure.
**Bearish Confirmation: After a Pivot High, the indicator requires N consecutive candles to close below the previous candle's close. This indicates selling pressure.
3. Trend Filter (EMA) - Dual Confirmation! 🎯
This is the critical component. A confirmed Price Action signal must align with the trend defined by the Exponential Moving Average (EMA):
Bullish Signal (Buy): Generated ONLY if the Bullish Price Action Confirmation occurs while the price (Close) is ABOVE the EMA (default 20 periods).
Bearish Signal (Sell): Generated ONLY if the Bearish Price Action Confirmation occurs while the price (Close) is BELOW the EMA.
This serves as a dual confirmation, ensuring the signal is captured in the direction of the broader market trend.
📈 How to Use
Look for the Signal: Wait for the shape (triangle, circle, or arrow) to appear on the chart.
Verify Confirmation: Know that the signal has already passed through the dual filter: Price Action and EMA.
Bullish signals appear below the bar when the price is ABOVE the EMA.
Bearish signals appear above the bar when the price is BELOW the EMA.
Risk Management: Always use this indicator in combination with your risk management strategy and technical analysis.
📝 Additional Notes
The indicator uses barstate.isconfirmed to accurately plot signals on the candle close.
The EMA line is also plotted on the chart for visual trend verification.
This indicator is a tool only and does not constitute financial advice. Always perform your own analysis and research.

Moving Average Ribbon by AbrarIndicator Description — Moving Average Ribbon (Multi-TF Enhanced)
The Moving Average Ribbon (Enhanced) is a powerful trend-analysis tool that displays up to 7 customizable moving averages along with a Weekly SMA 150 for higher-timeframe confluence. Each MA can be individually configured with length, source, type (SMA/EMA/WMA/SMMA/VWMA), and color.
The script also features automatic labels on the latest bar, allowing traders to instantly identify each moving average on the chart without confusion.
This indicator is designed to help traders:
Visualize trend strength and direction
Spot dynamic support/resistance zones
Identify momentum shifts
Incorporate higher-timeframe confirmation through the Weekly SMA 150
Whether you trade intraday or swing, this ribbon provides a clean and flexible layout to understand market structure at a glance.
